
Many organizations are beginning to use containers due to the flexibility they provide over traditional virtual machine infrastructure. This technology allows infrastructure teams to increase agility, and adapt to changing business needs, by quickly deploying portable and scalable containerized applications.
However, due to their complexity, container environments have introduced new challenges in monitoring the various levels of the infrastructure stack. In order to most accurately identify the root cause of an issue, IT Operations teams now require visibility into metrics generated from the underlying server, the container itself, as well as the orchestration tool being utilized to manage the containerized workloads and services.
One way to collect information and provide insight into the interconnected components of your container infrastructure is to use Prometheus. Prometheus is an agentless solution that relies on scraping metrics from defined HTTP endpoints, or targets. Let’s dive into how to use Prometheus for agentless server monitoring using LogStream.
It is important to remember that Prometheus only pulls back metrics, and does not collect full logs from components being monitored. While there are various infrastructure and application endpoints that can be exposed, the steps we’ll walk through below will focus specifically on how to use Prometheus out of the box, to monitor a single-server container environment. We will install Prometheus via Helm, review key components, configure Prometheus as a LogStream Source, and then preview the data within LogStream before routing it to a downstream system of analysis for further review.
Using Prometheus for Agentless Monitoring: Install via Helm
As prerequisites for this exercise, we’ve configured an EC2 server to run with the following components, and we assume working knowledge of related container environments:
Docker
Kubernetes tools: kubelet, kubeadm, kubectl
Kind: to create a local Kubernetes cluster using Docker container nodes (minikube is another popular alternative)
Git and Helm: to pull and install the latest Prometheus Helm chart
Once you’ve configured your server to run a Kubernetes cluster, and installed Helm and the relevant Prometheus repositories, you will be able to quickly deploy Prometheus and begin monitoring critical endpoints.
At the time of publishing, Prometheus 9.4.1 was the latest stable version. In the command below, we have named our Helm install prometheus, and have downloaded the kube-prometheus-stack chart from the prometheus-community repository.
$ ./helm install prometheus prometheus-community/kube-prometheus-stack --version "9.4.1"
After the installation is complete, we can review the individual components that were configured and deployed by running:
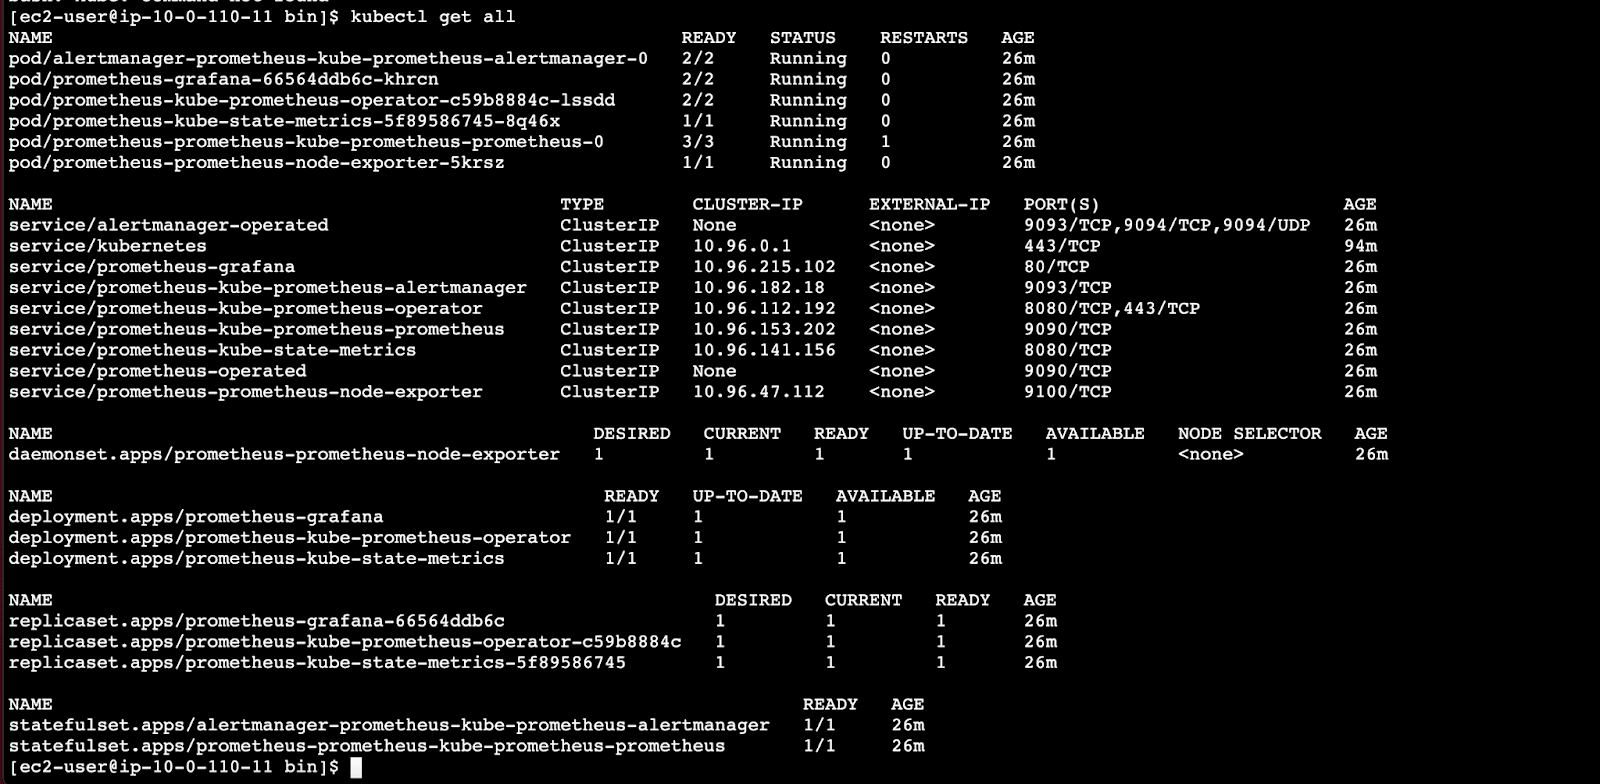
$ kubectl get all
The screenshot below shows the output, listing first the pods and then the services of the different Prometheus stack components.
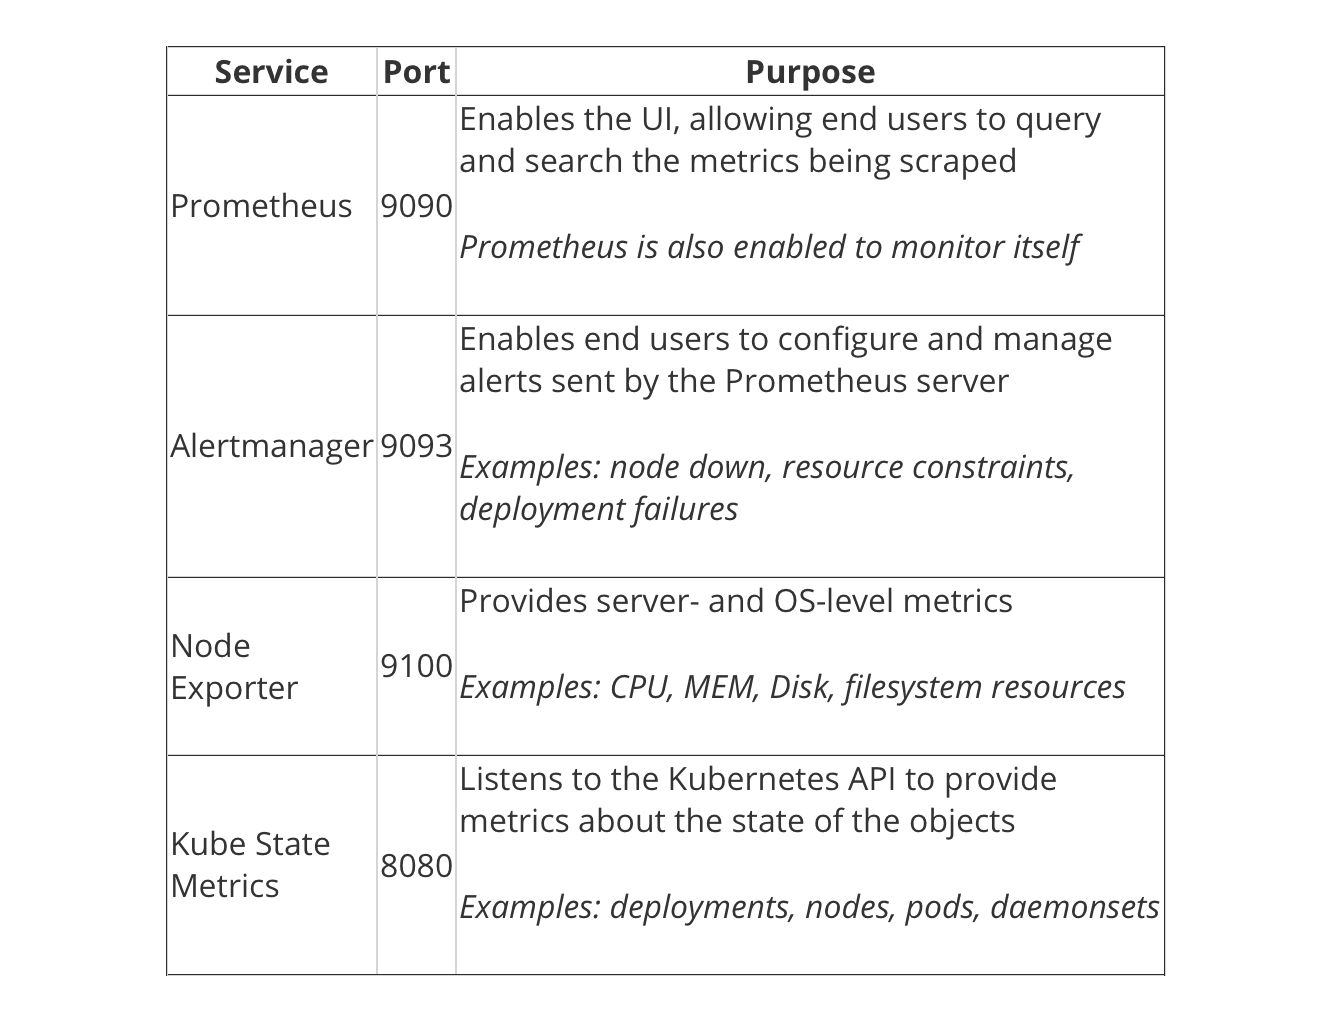
Here are the critical services listed, with their purposes:
In the middle of the output, we can see the 3 deployments that were initiated by the Helm Chart we selected: Prometheus Operator, Grafana, and Kube State Metrics.
And at the bottom, the stateful sets that were created for Prometheus and the Alertmanager.
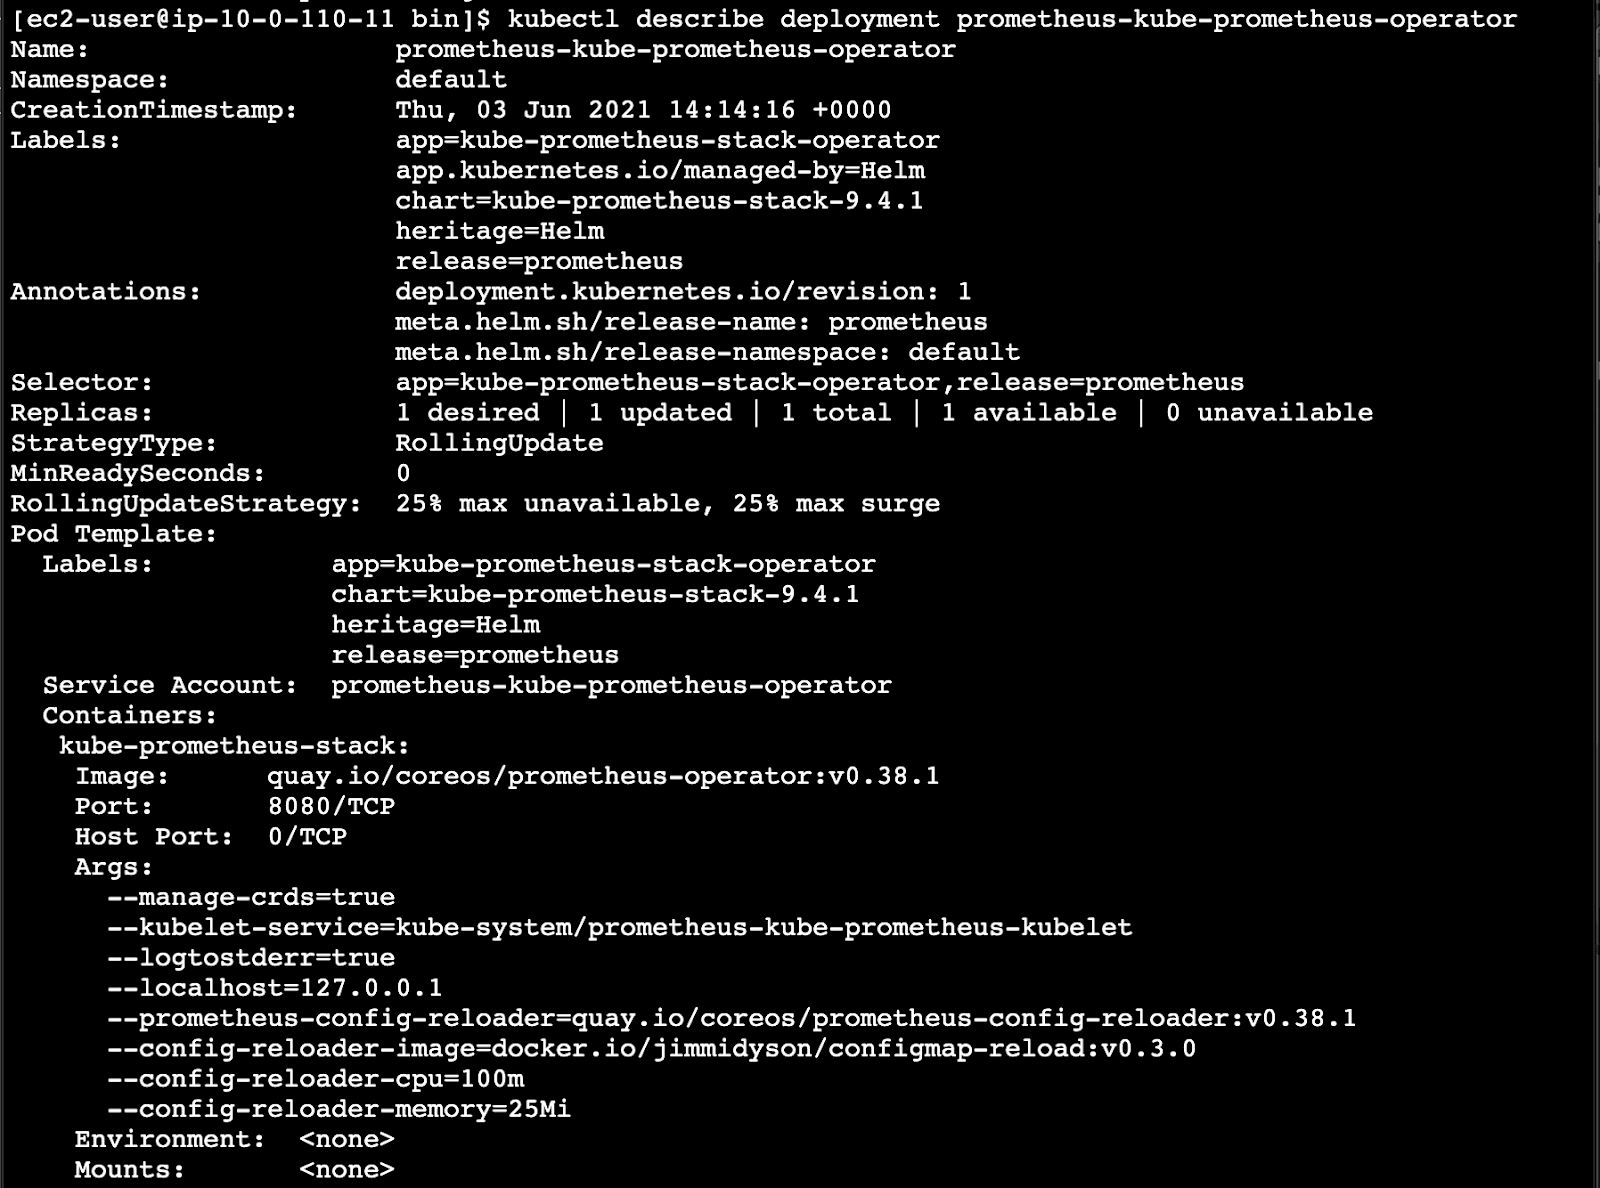
If you’re interested in additional details about the configurations (container image version, endpoints, etc.) for the kube-prometheus-operator, run the following command and review the output:
$ kubectl describe deployment prometheus-kube-prometheus-operator
Configuring Prometheus as a Source in LogStream
When reviewing the services, we see that all are listed with a ClusterIP Type, which denotes an internal service, not open to external requests. In a production environment, a service can be configured as a Load Balancer, which will provide an externally accessible IP address that sends traffic to the correct port on your cluster nodes.
For this example, we will be using port forwarding to view the Prometheus interface and to enable LogStream to access the metrics.
Running the following command for the Prometheus pod will open port 9090 and allow you to view the Prometheus GUI at localhost:9090 or ip:9090
kubect1 --namespace default port-forward --address 0.0.0.0 prometheus-prometheus-kube-prometheus-prometheus-0 9090
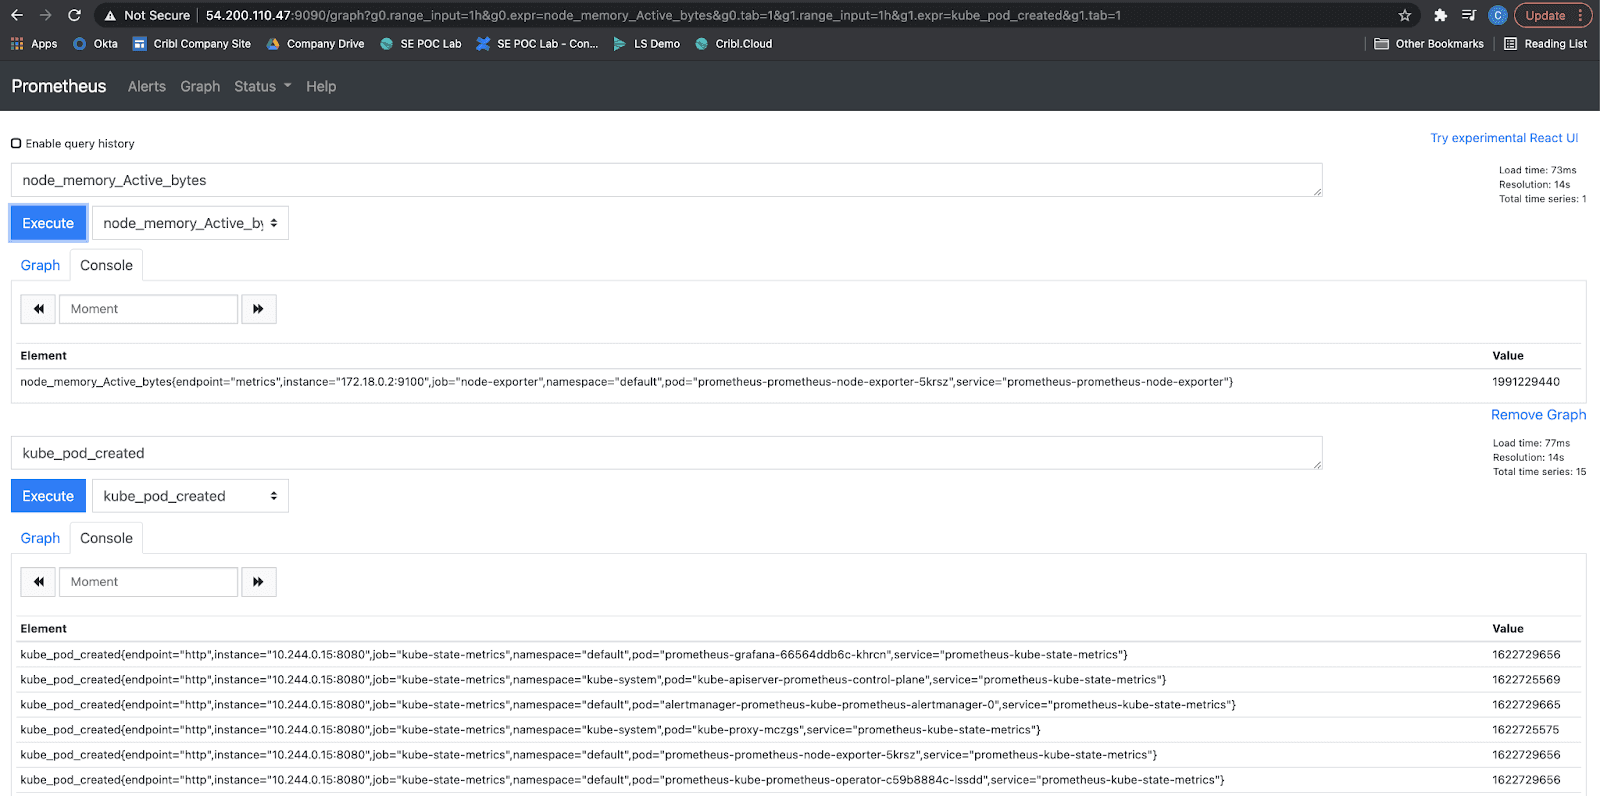
Within Prometheus, you can use the insert metric at cursor drop-down to select an available metric. Hitting the Execute button will generate the most recent values for the selected metric.
In the screenshot below, we’re previewing two metrics, the first for the underlying node and the second at the Kubernetes level.
With port forwarding still enabled on the server, navigate within LogStream and select Sources → Prometheus to set the Input ID and Target. Depending on how active your container cluster is, you may need to reduce the Poll Interval to view data more quickly. Next, Commit and Deploy.
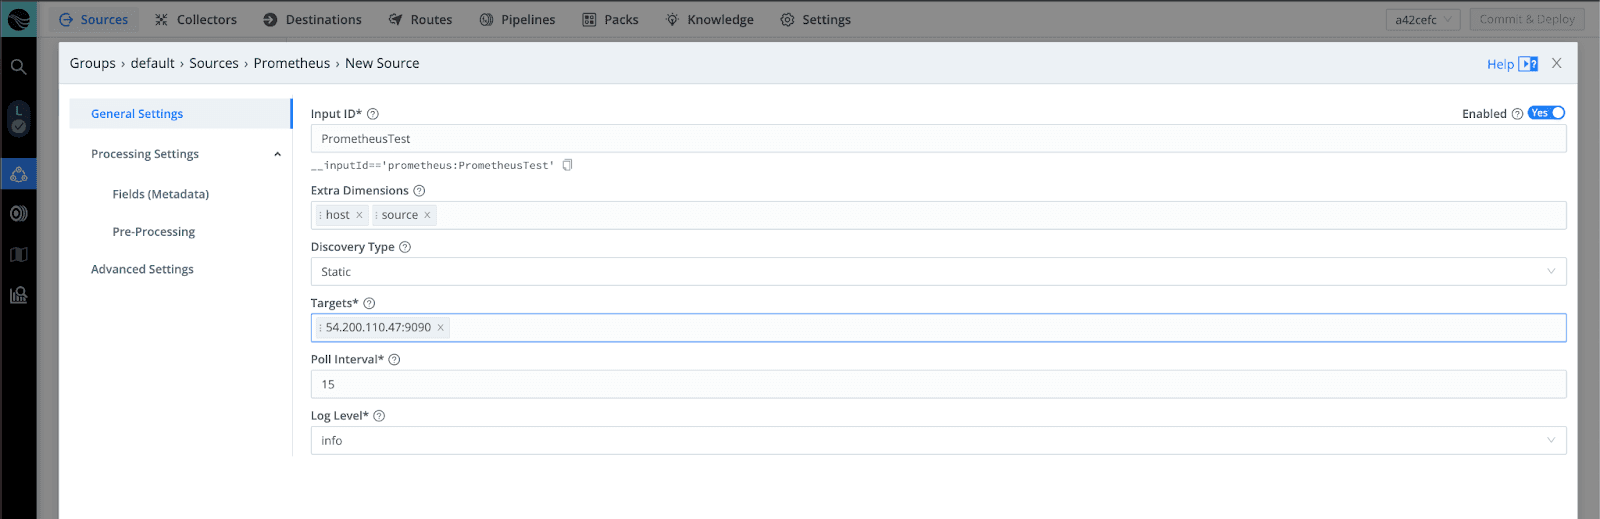
You can also use port forwarding and configure the Target input to send metrics from the various other Prometheus endpoints through LogStream. As an example, ip:8080 and ip:9100 will send kube-state– and node-level metrics.
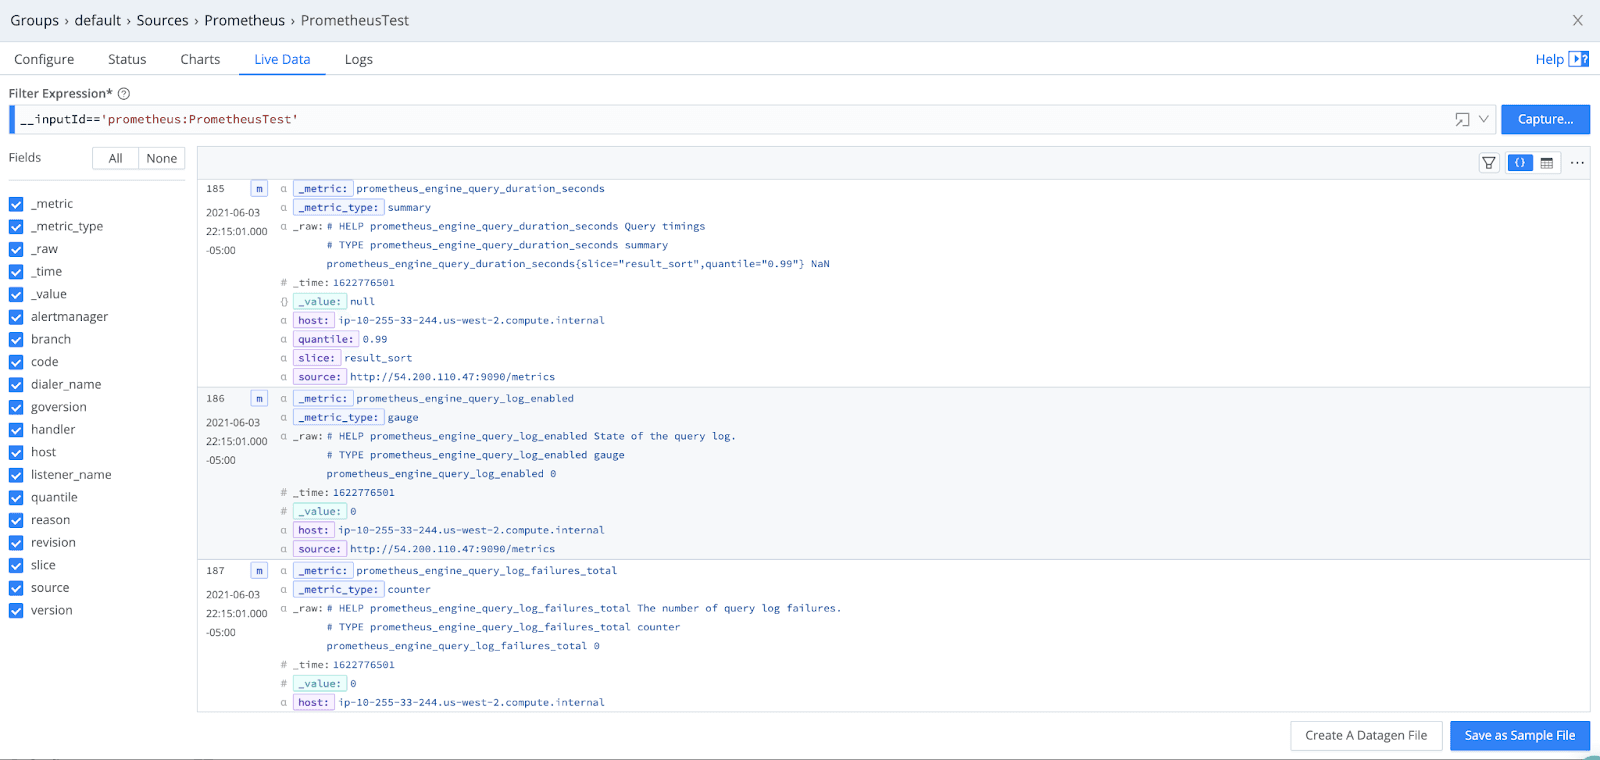
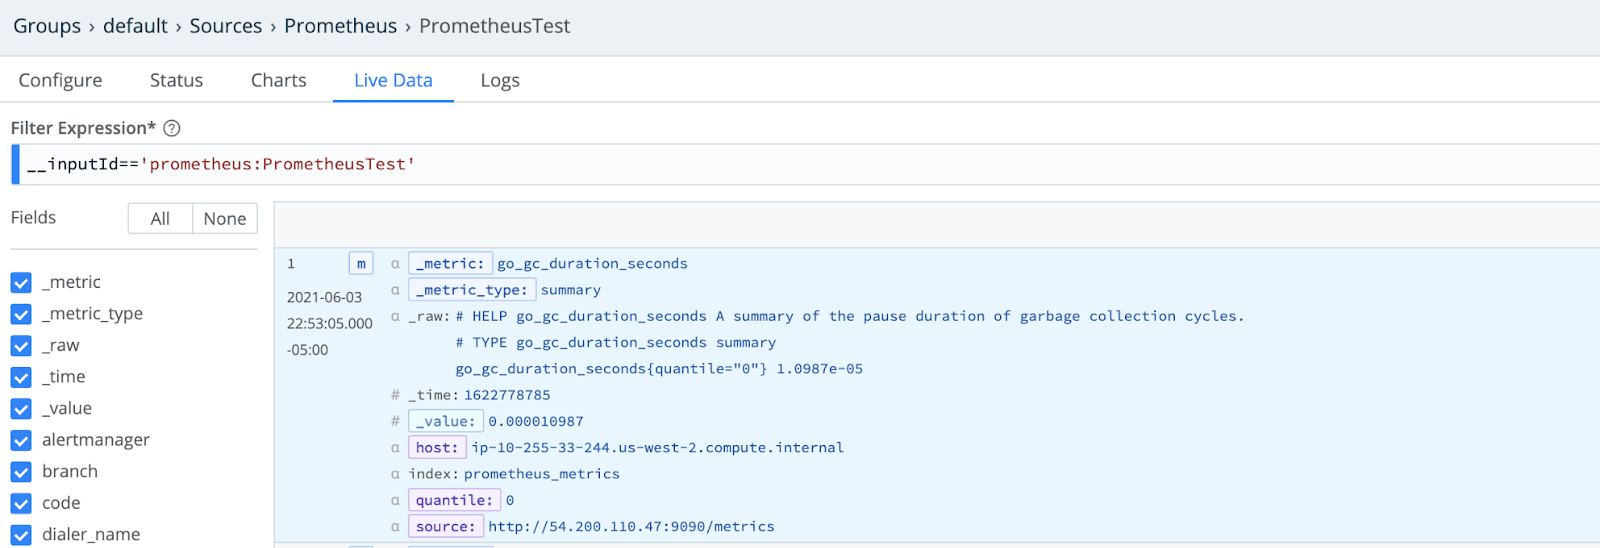
Previewing the Metrics Data in LogStream
Because Prometheus is scraping for metrics rather than entire logs, the data flowing through LogStream is quite condensed. Here are the key fields:
Routing to a System of Analysis (Splunk)
When sending to Splunk, because Prometheus is collecting metrics, we must first configure a Metrics Index, and then add that as a metadata field to our events in LogStream.
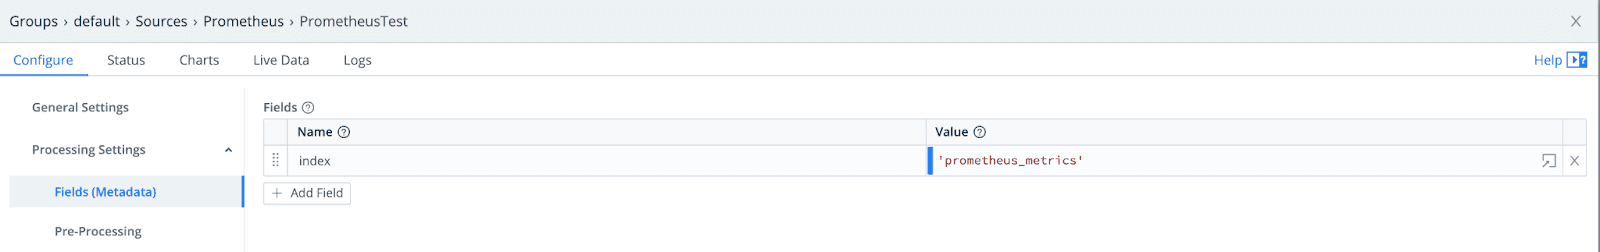
Once you’ve configured this in LogStream, Commit and Deploy to ensure that the metrics include the new index field.
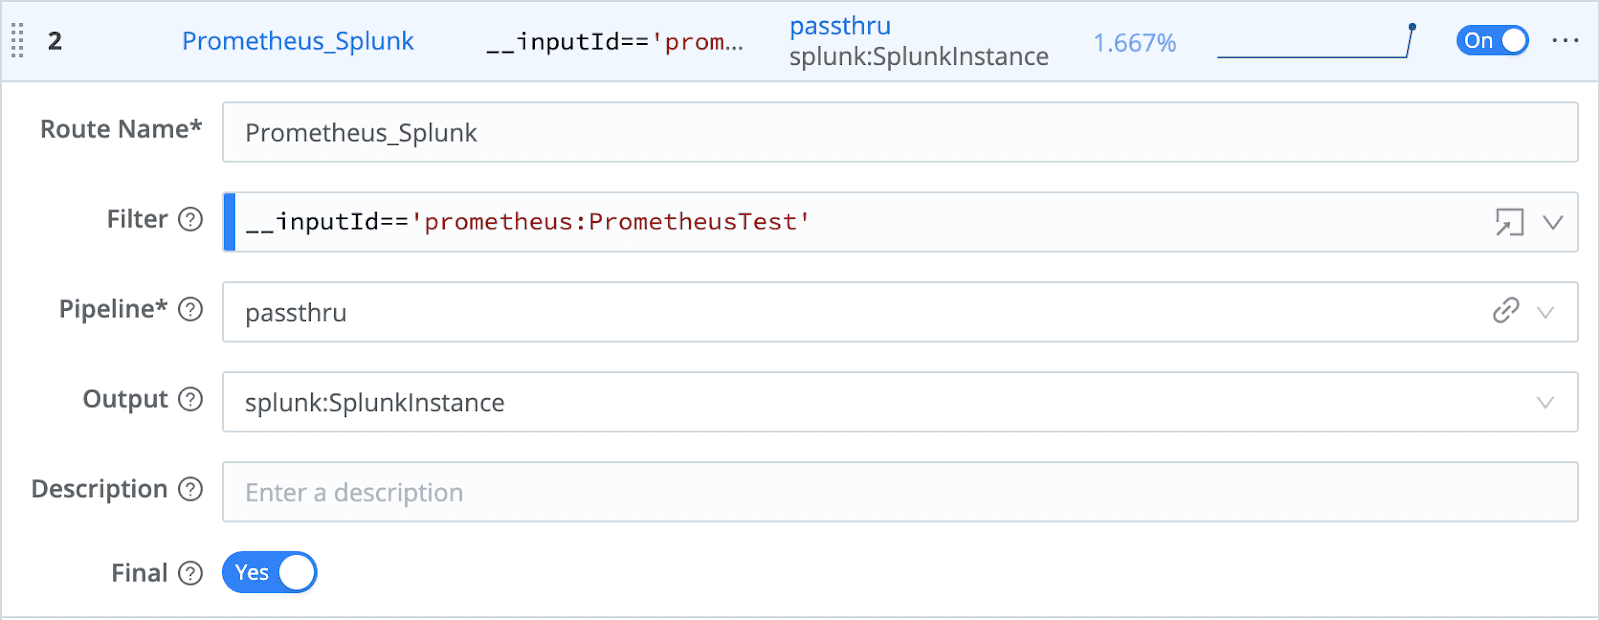
Finally, configure a LogStream Route to send the Prometheus metrics, unchanged, to land in the Splunk prometheus_metrics index.
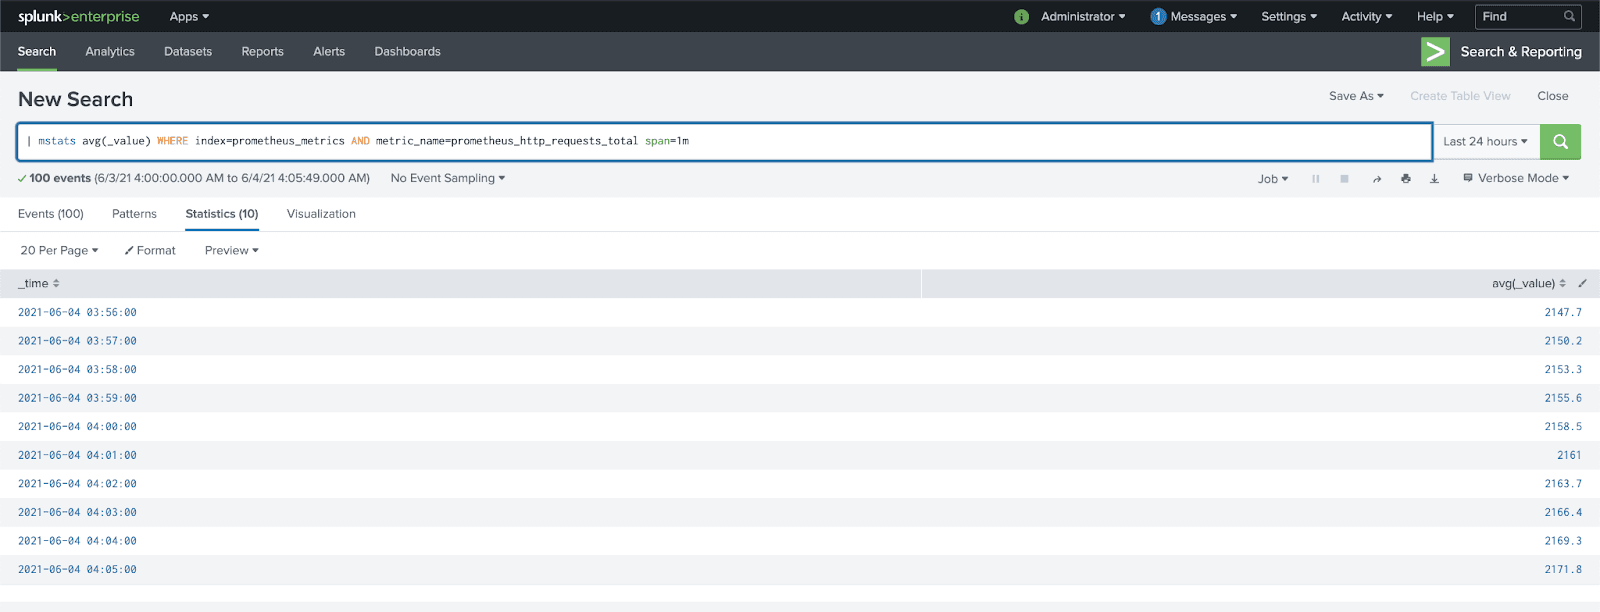
Data should now be available within Splunk to begin building out dashboards and alerts for IT Operations teams. By using LogStream for routing, you can easily send an additional copy of the metrics to object storage in parallel, for long-term retention of the information.
Get Started Using Prometheus for Agentless Monitoring
Interested in testing Prometheus metric collection and routing to streamline your operations? It’s easy to get started using Prometheus for agentless server monitoring by signing up for Cribl.Cloud and instantly provisioning an instance of LogStream Cloud. Once connected to data sources, you can process up to 1TB per day, for free!