
We continue our exploration of the fascinating world of Kubernetes, logs, and metrics. In our previous installment, we delved into the intricate tale of Cribl Edge and its role in unraveling the mysteries of logging and metrics in Kubernetes environments with the Cribl Edge native sources for Kubernetes Metrics and Logs. Today, we’re picking up where we left off, shining a spotlight on a new and powerful tool that has the potential to demystify this complex ecosystem further. Join us as we venture deeper into the Cribl Prometheus Edge Scraper, an invaluable addition to your toolkit for monitoring and gathering insights from your Kubernetes clusters. So, fasten your seatbelts as we embark on this thrilling sequel to our Kubernetes journey because with Cribl Edge, Kubernetes logs and metrics no longer need to be a mystery novel.
Taming the Chaos of Duplicate Data & Querying Kubernetes Endpoints
The Edge Prometheus Scraper Source was released in version 4.2 and is purpose-built for Kubernetes environments. The Prometheus Scraper Source lets you pull metrics from static or dynamically discovered endpoints and forward them to supported destinations in a format that the Prometheus Monitoring System can understand and aggregate. Using it in a Kubernetes environment, however, revealed these issues:
As Edge is installed as a Daemonset in a cluster, a copy is available on every node. The Edge instances scrape from configured endpoints, which results in duplicate data.
Kubernetes components export metrics and make them available in Prometheus format. Edge needs to figure out how to query the metrics endpoint and fetch the current metrics when it replaces Prometheus agents.
In v4.2, Cribl Edge introduced Prometheus Edge Scraper to overcome these challenges. Let’s take a closer look at the discovery options this Edge Scraper offers.
A Data Discovery Tool
The first step is to discover targets to collect data from. The Prometheus Edge Scraper provides several ways to discover targets:
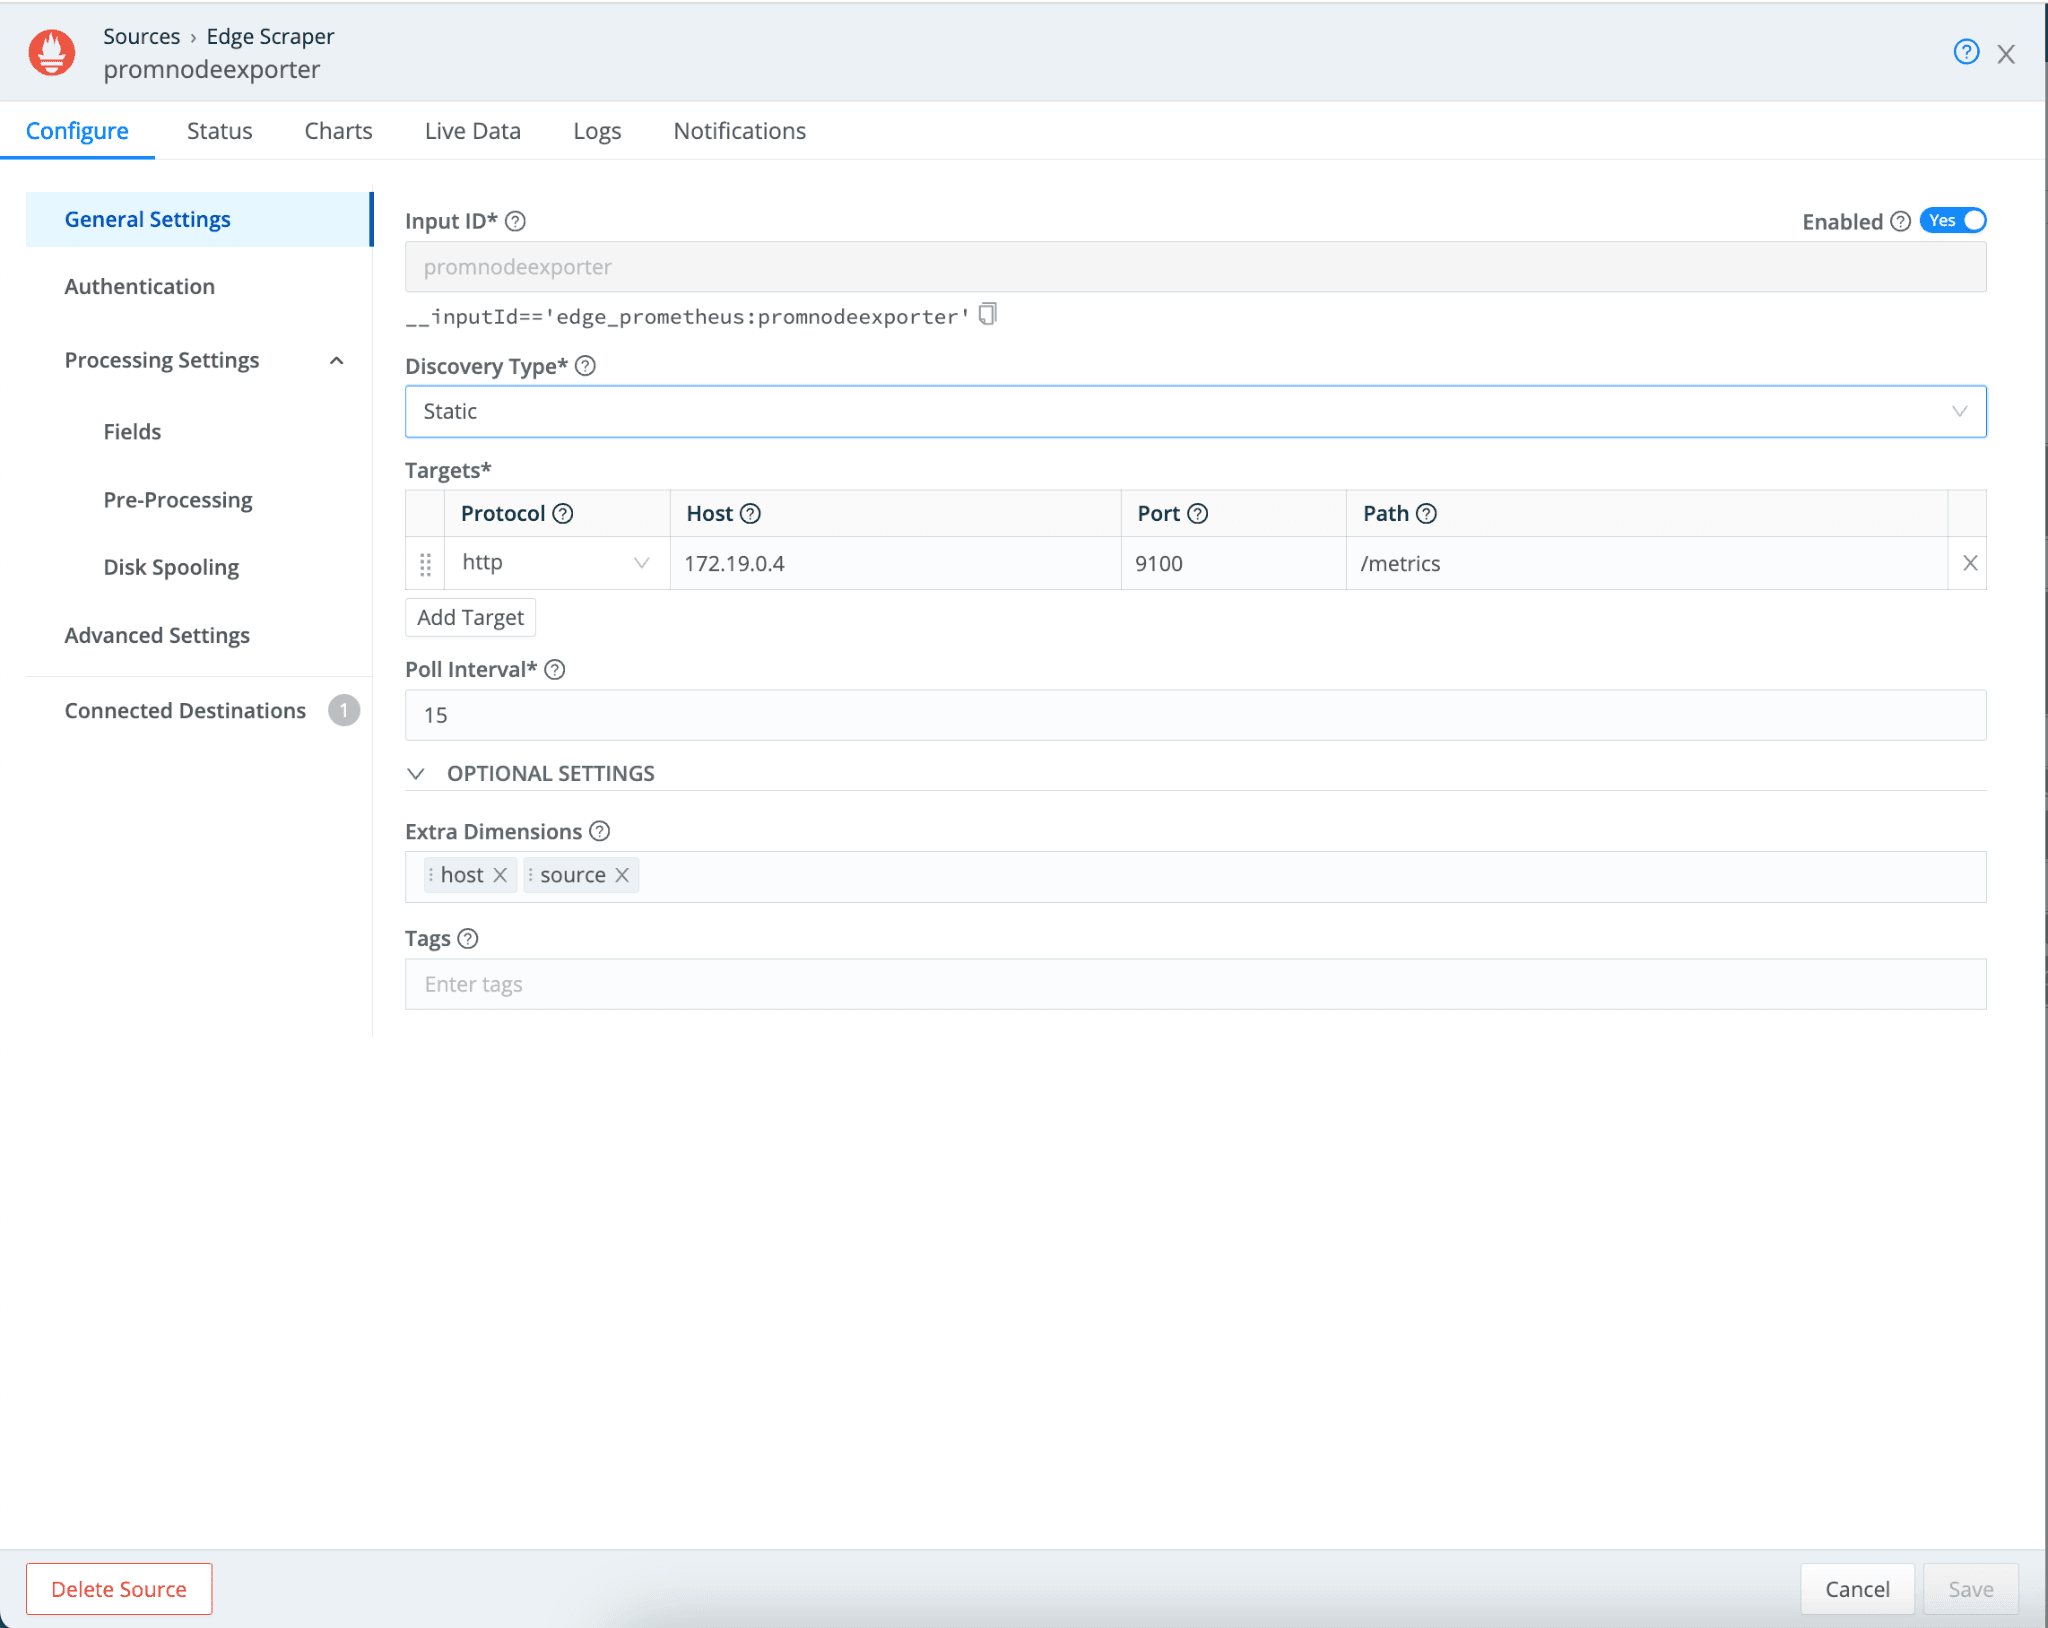
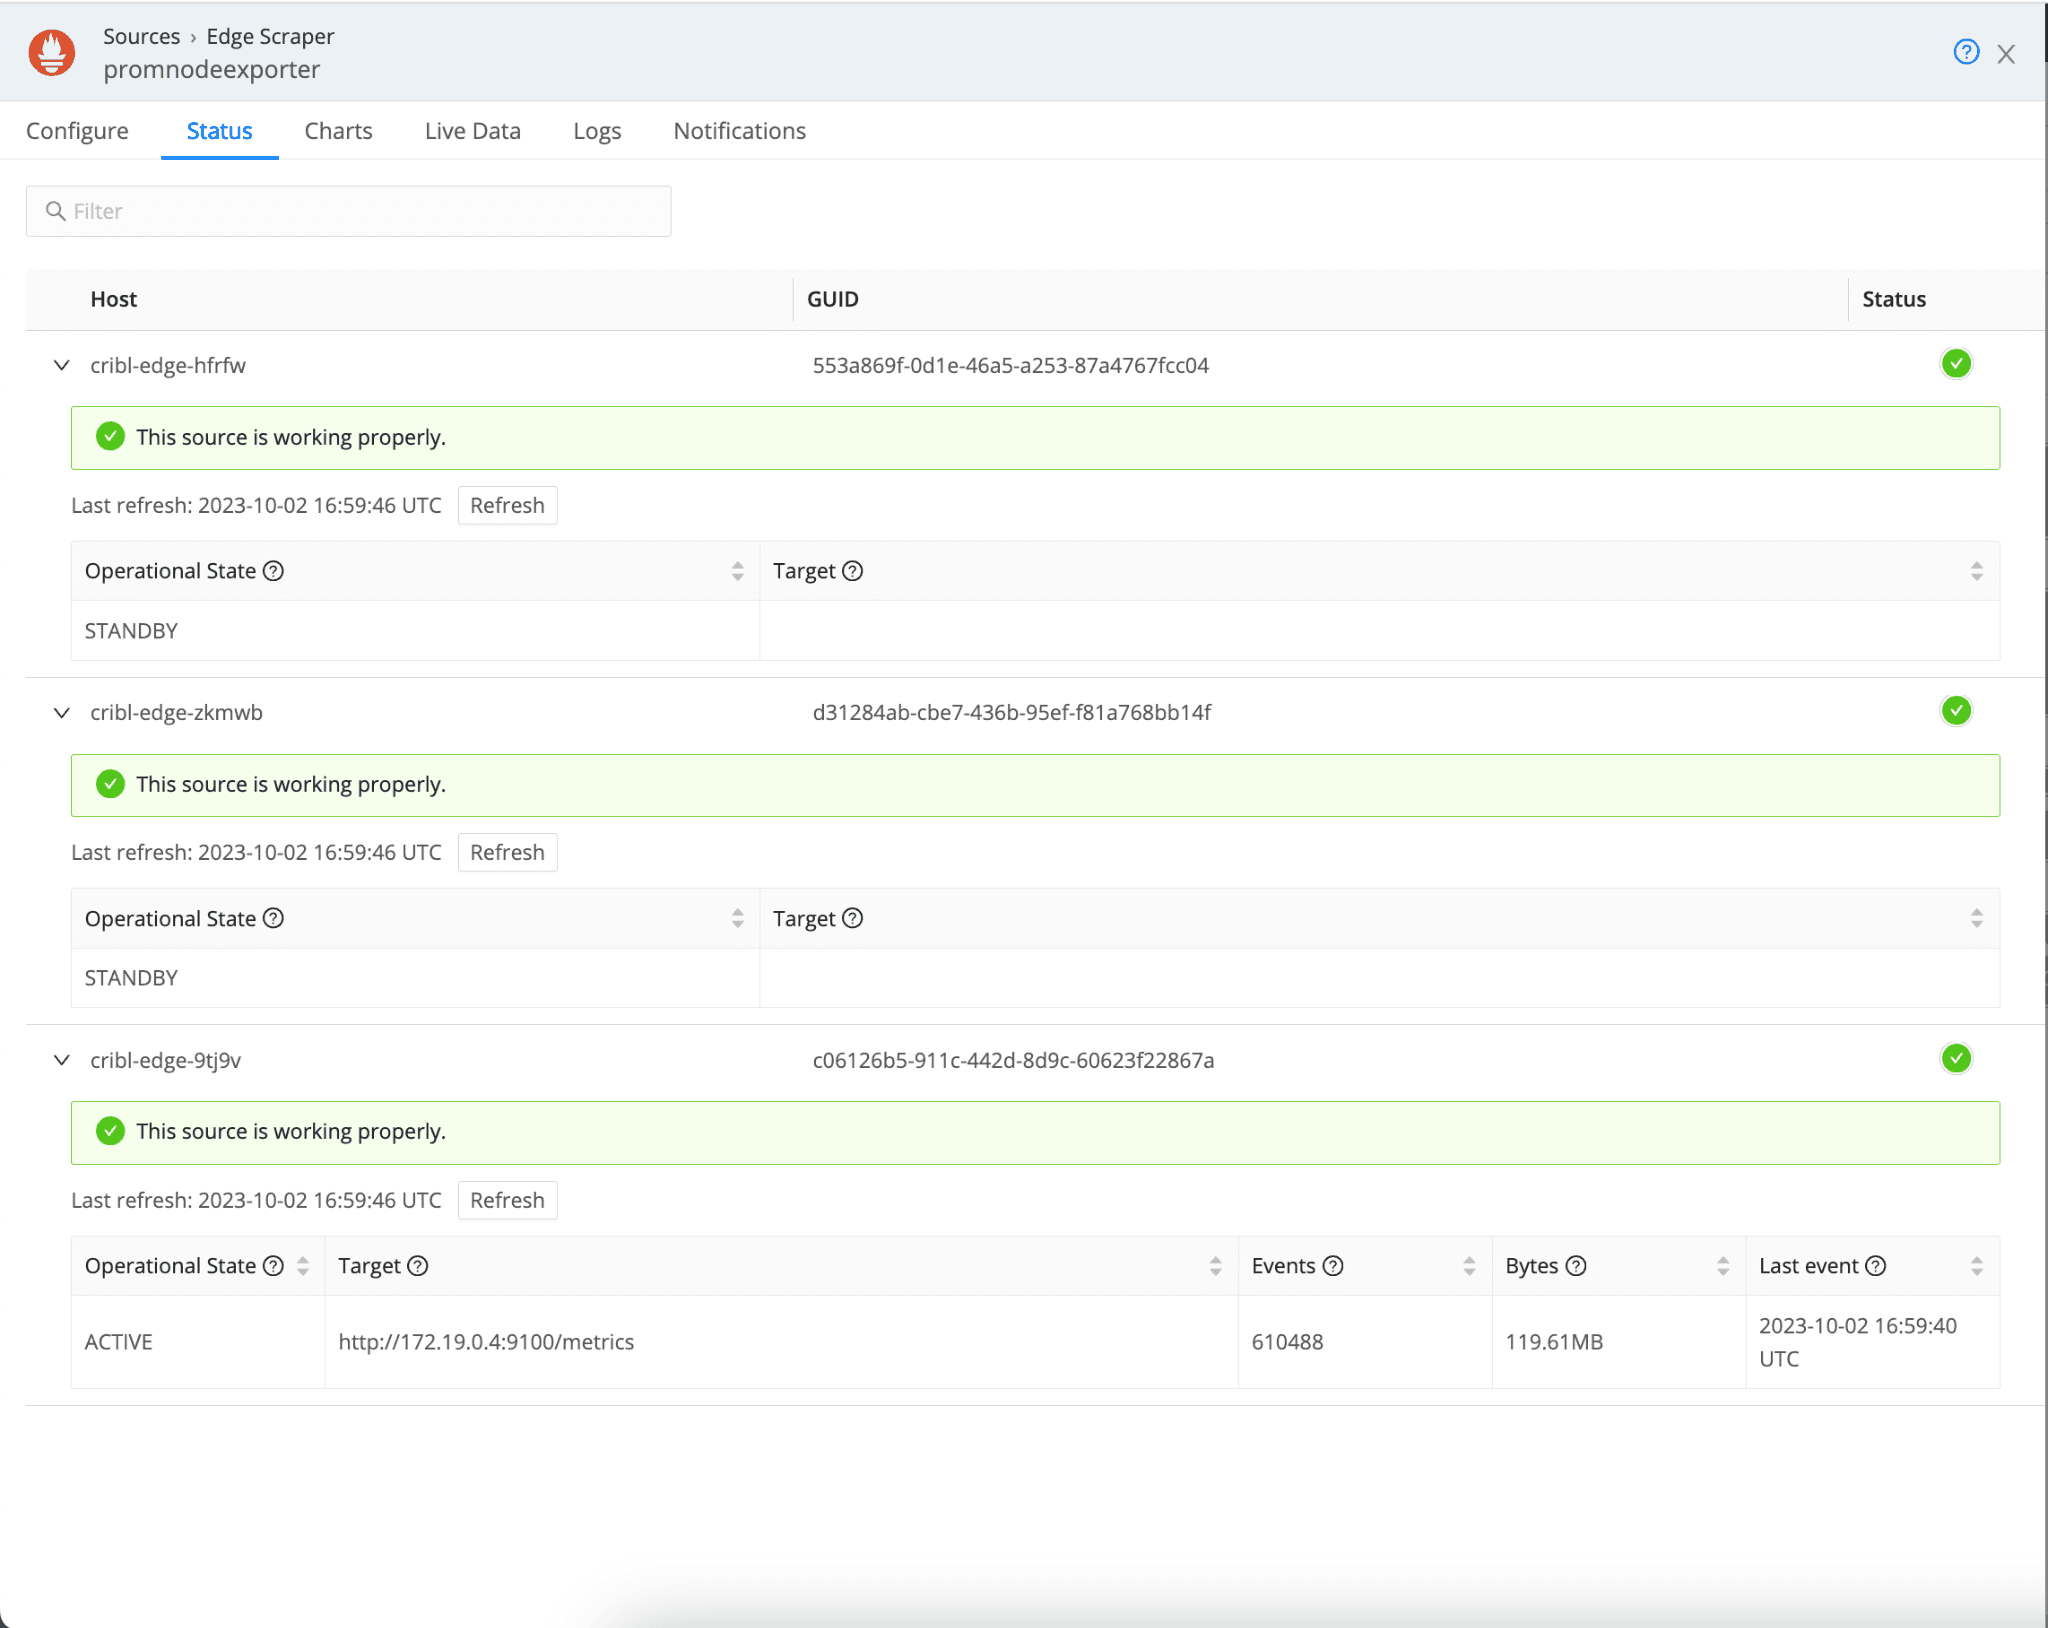
Static: With this option, you can specify which Prometheus targets you want to pull metrics from. Cribl Edge automatically employs an election logic in a Kubernetes deployment to select only one Edge instance (ACTIVE) to collect metrics. Other Edge instances will be in STANDBY mode.
Dynamic: You can dynamically find targets to scrape metrics using DNS discovery or AWS EC2. Like Static discovery, Cribl Edge will select one Edge instance automatically in a Kubernetes deployment (ACTIVE).
The example below shows which Edge instance is selected for Static / Dynamic discovery on a three-node cluster.
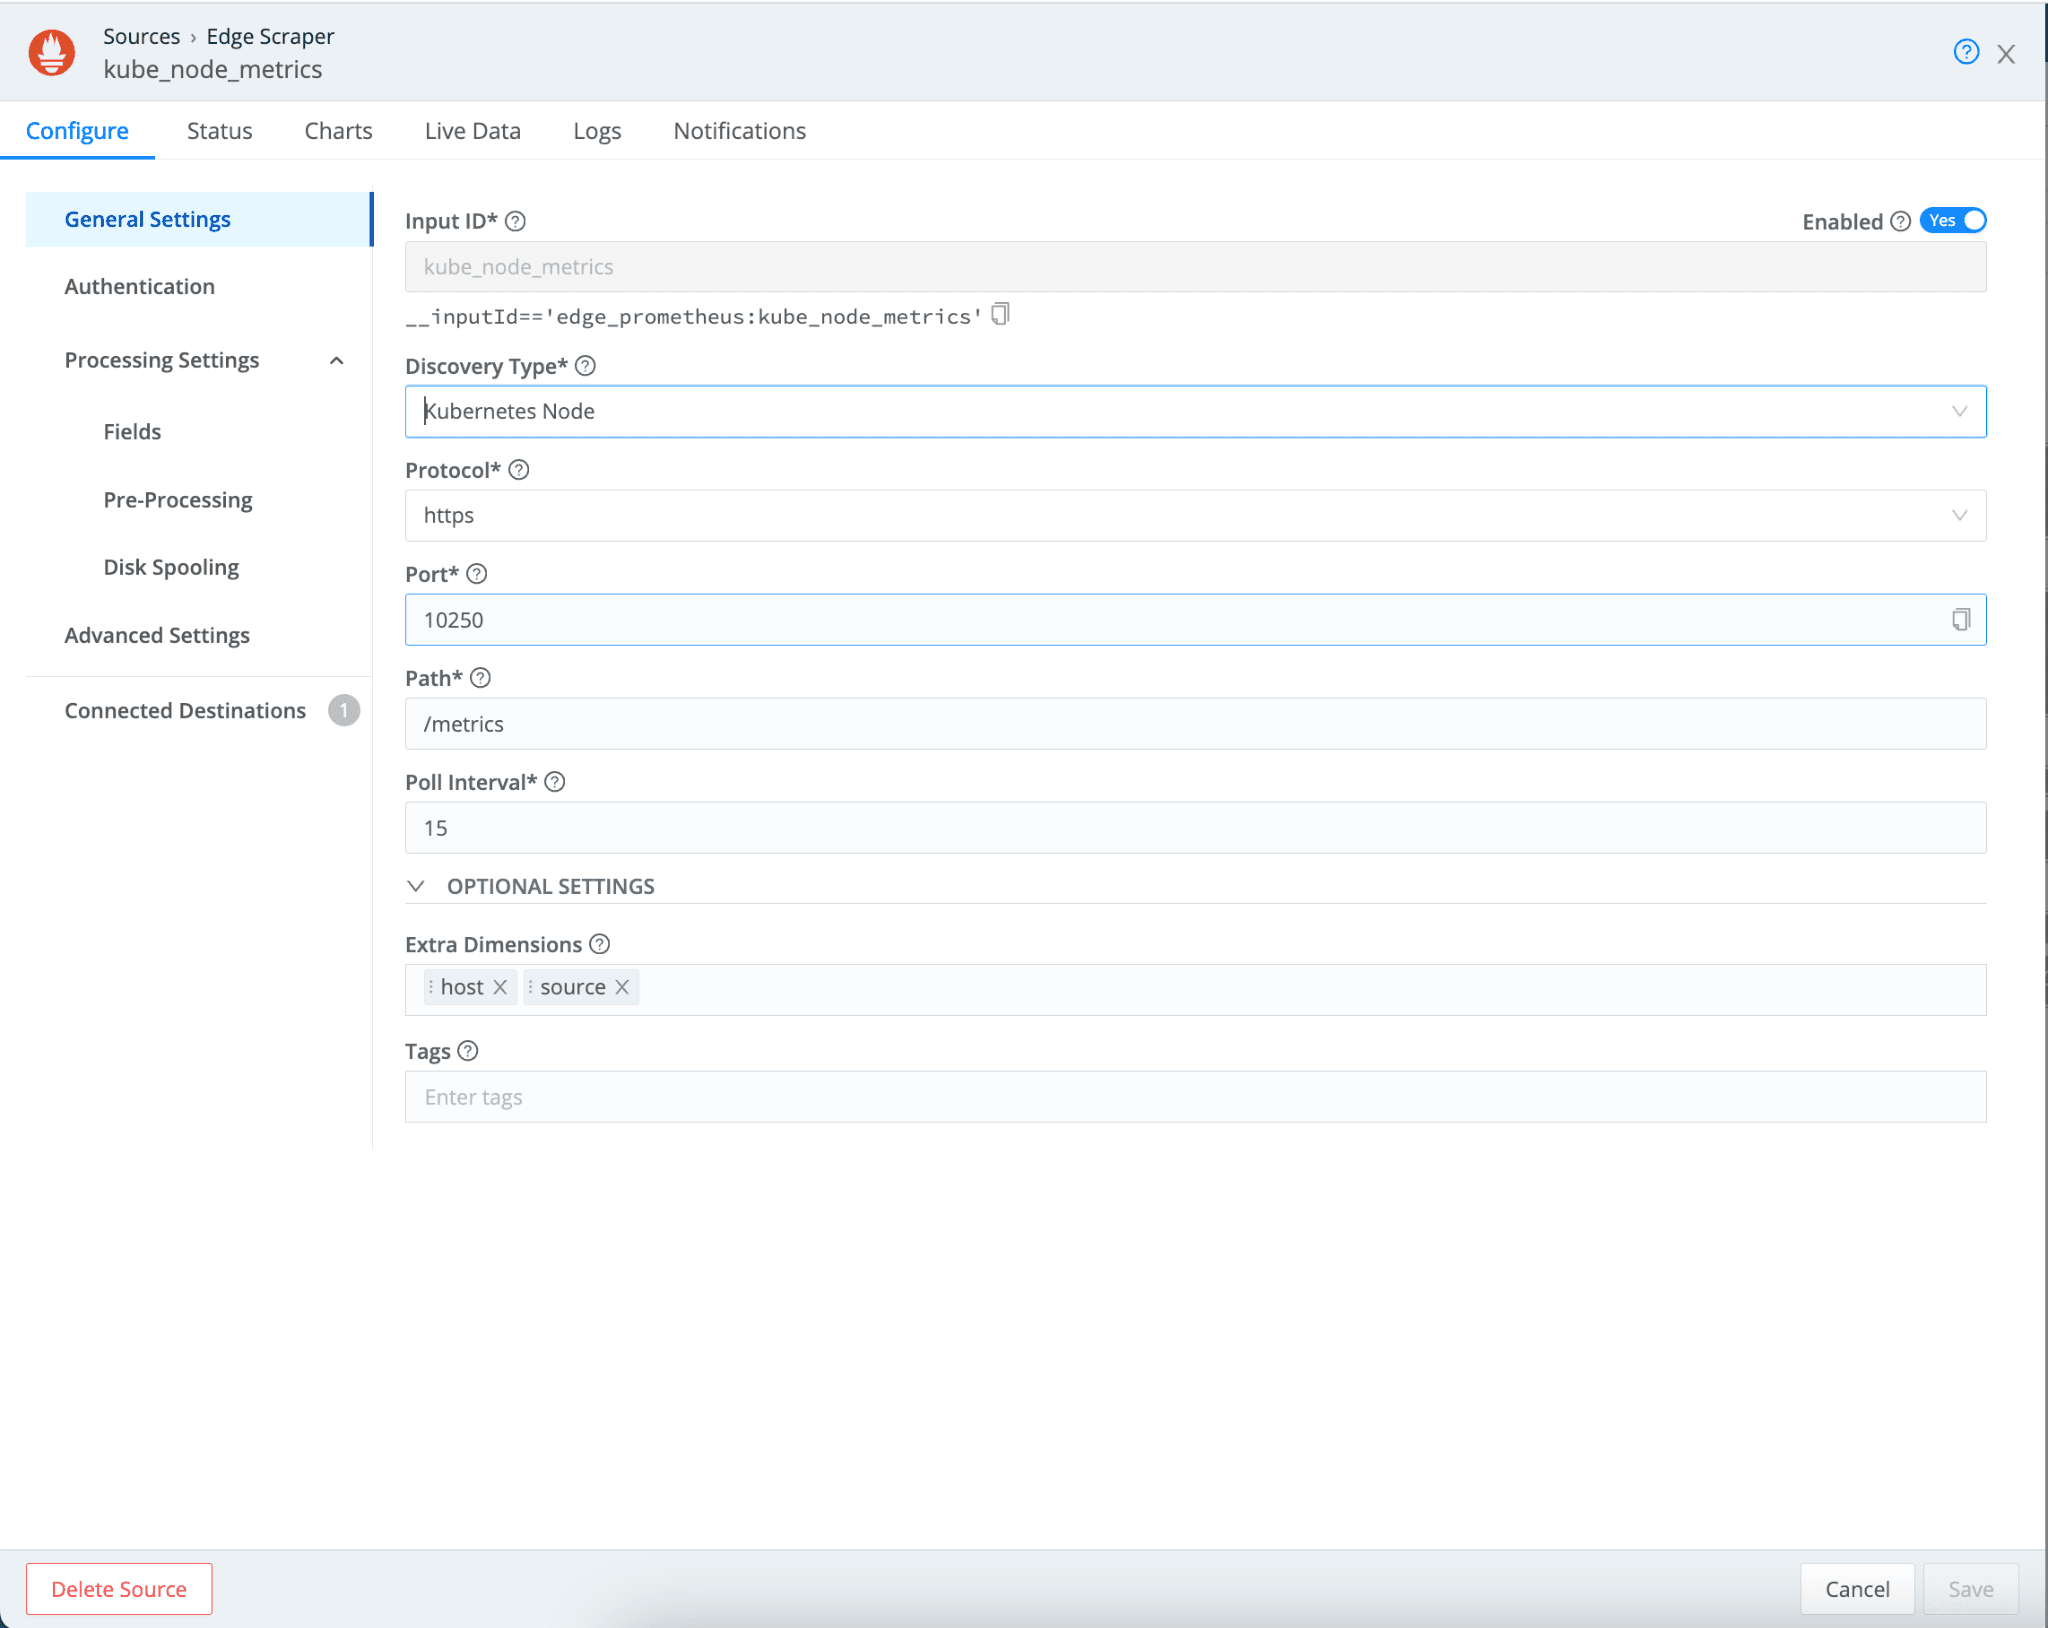
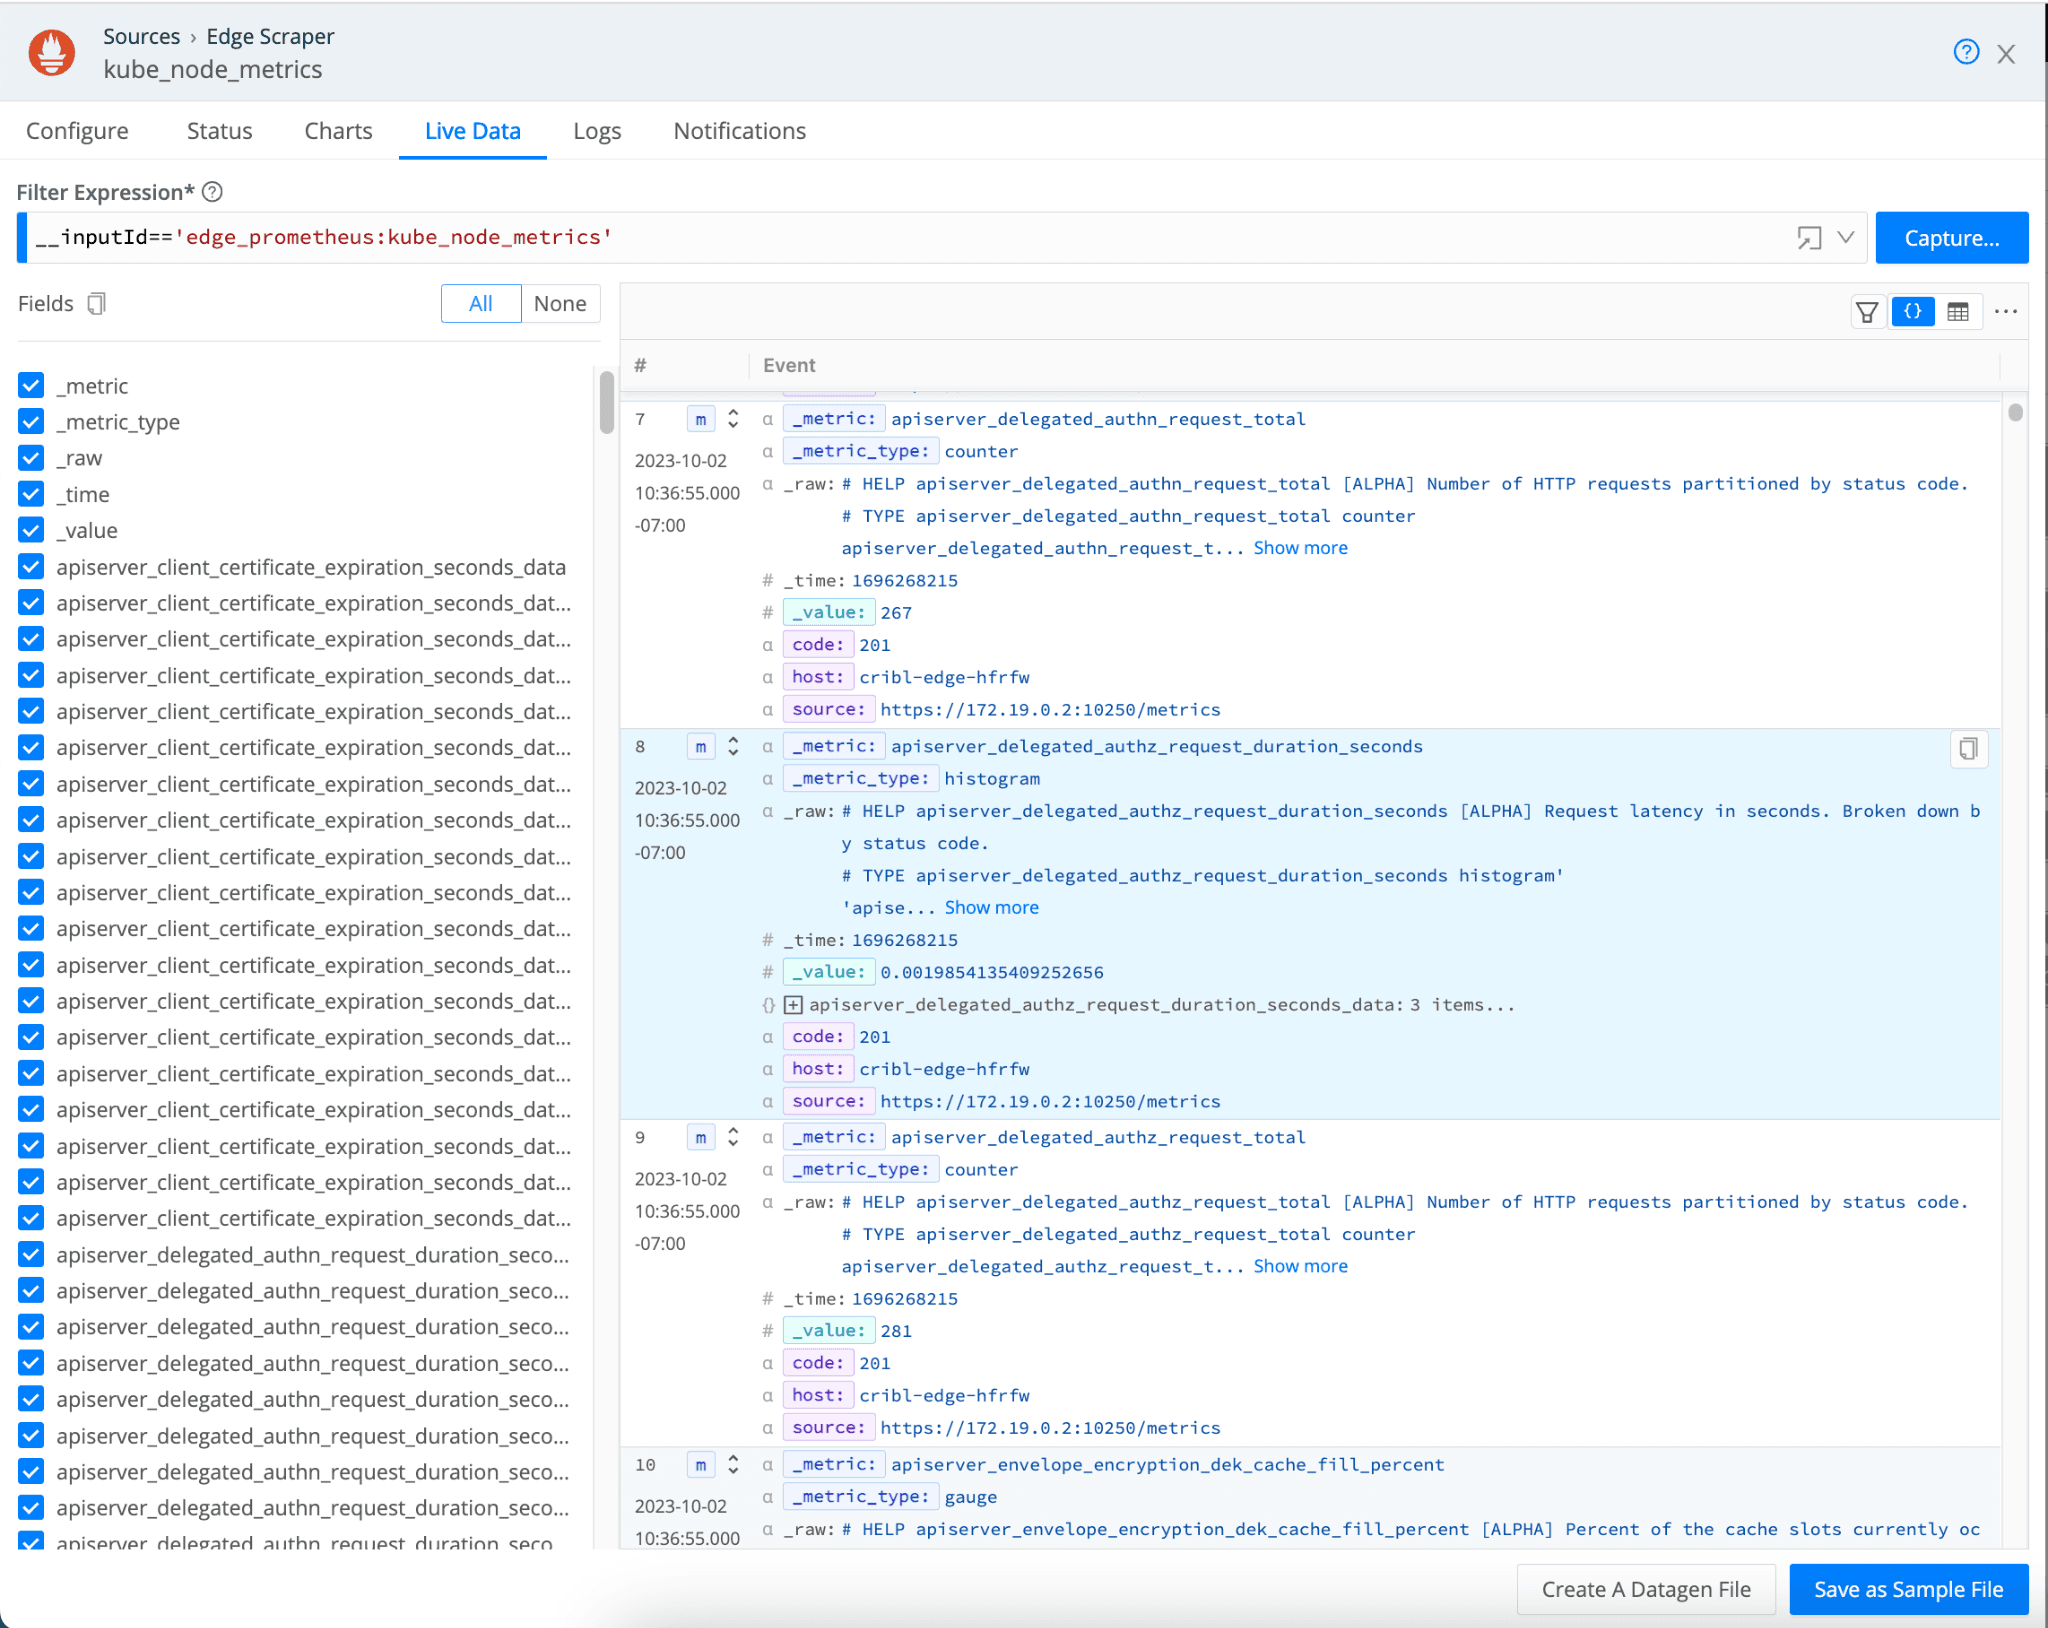
Kubernetes Node: In Prometheus Edge Scraper, there is a new discovery type called Kubernetes Node. With this discovery type, you can scrape a single Kubernetes node where the Edge pod/container is running. Typically, this option scrapes metrics from the “node-agent” (kubelet) and other node-local interfaces which emit prometheus metrics.
You can scrape metrics exported by Kubernetes components using this discovery mode. For details, refer to the Kubernetes Metrics Reference.
The following is an example of how to configure this discovery type.
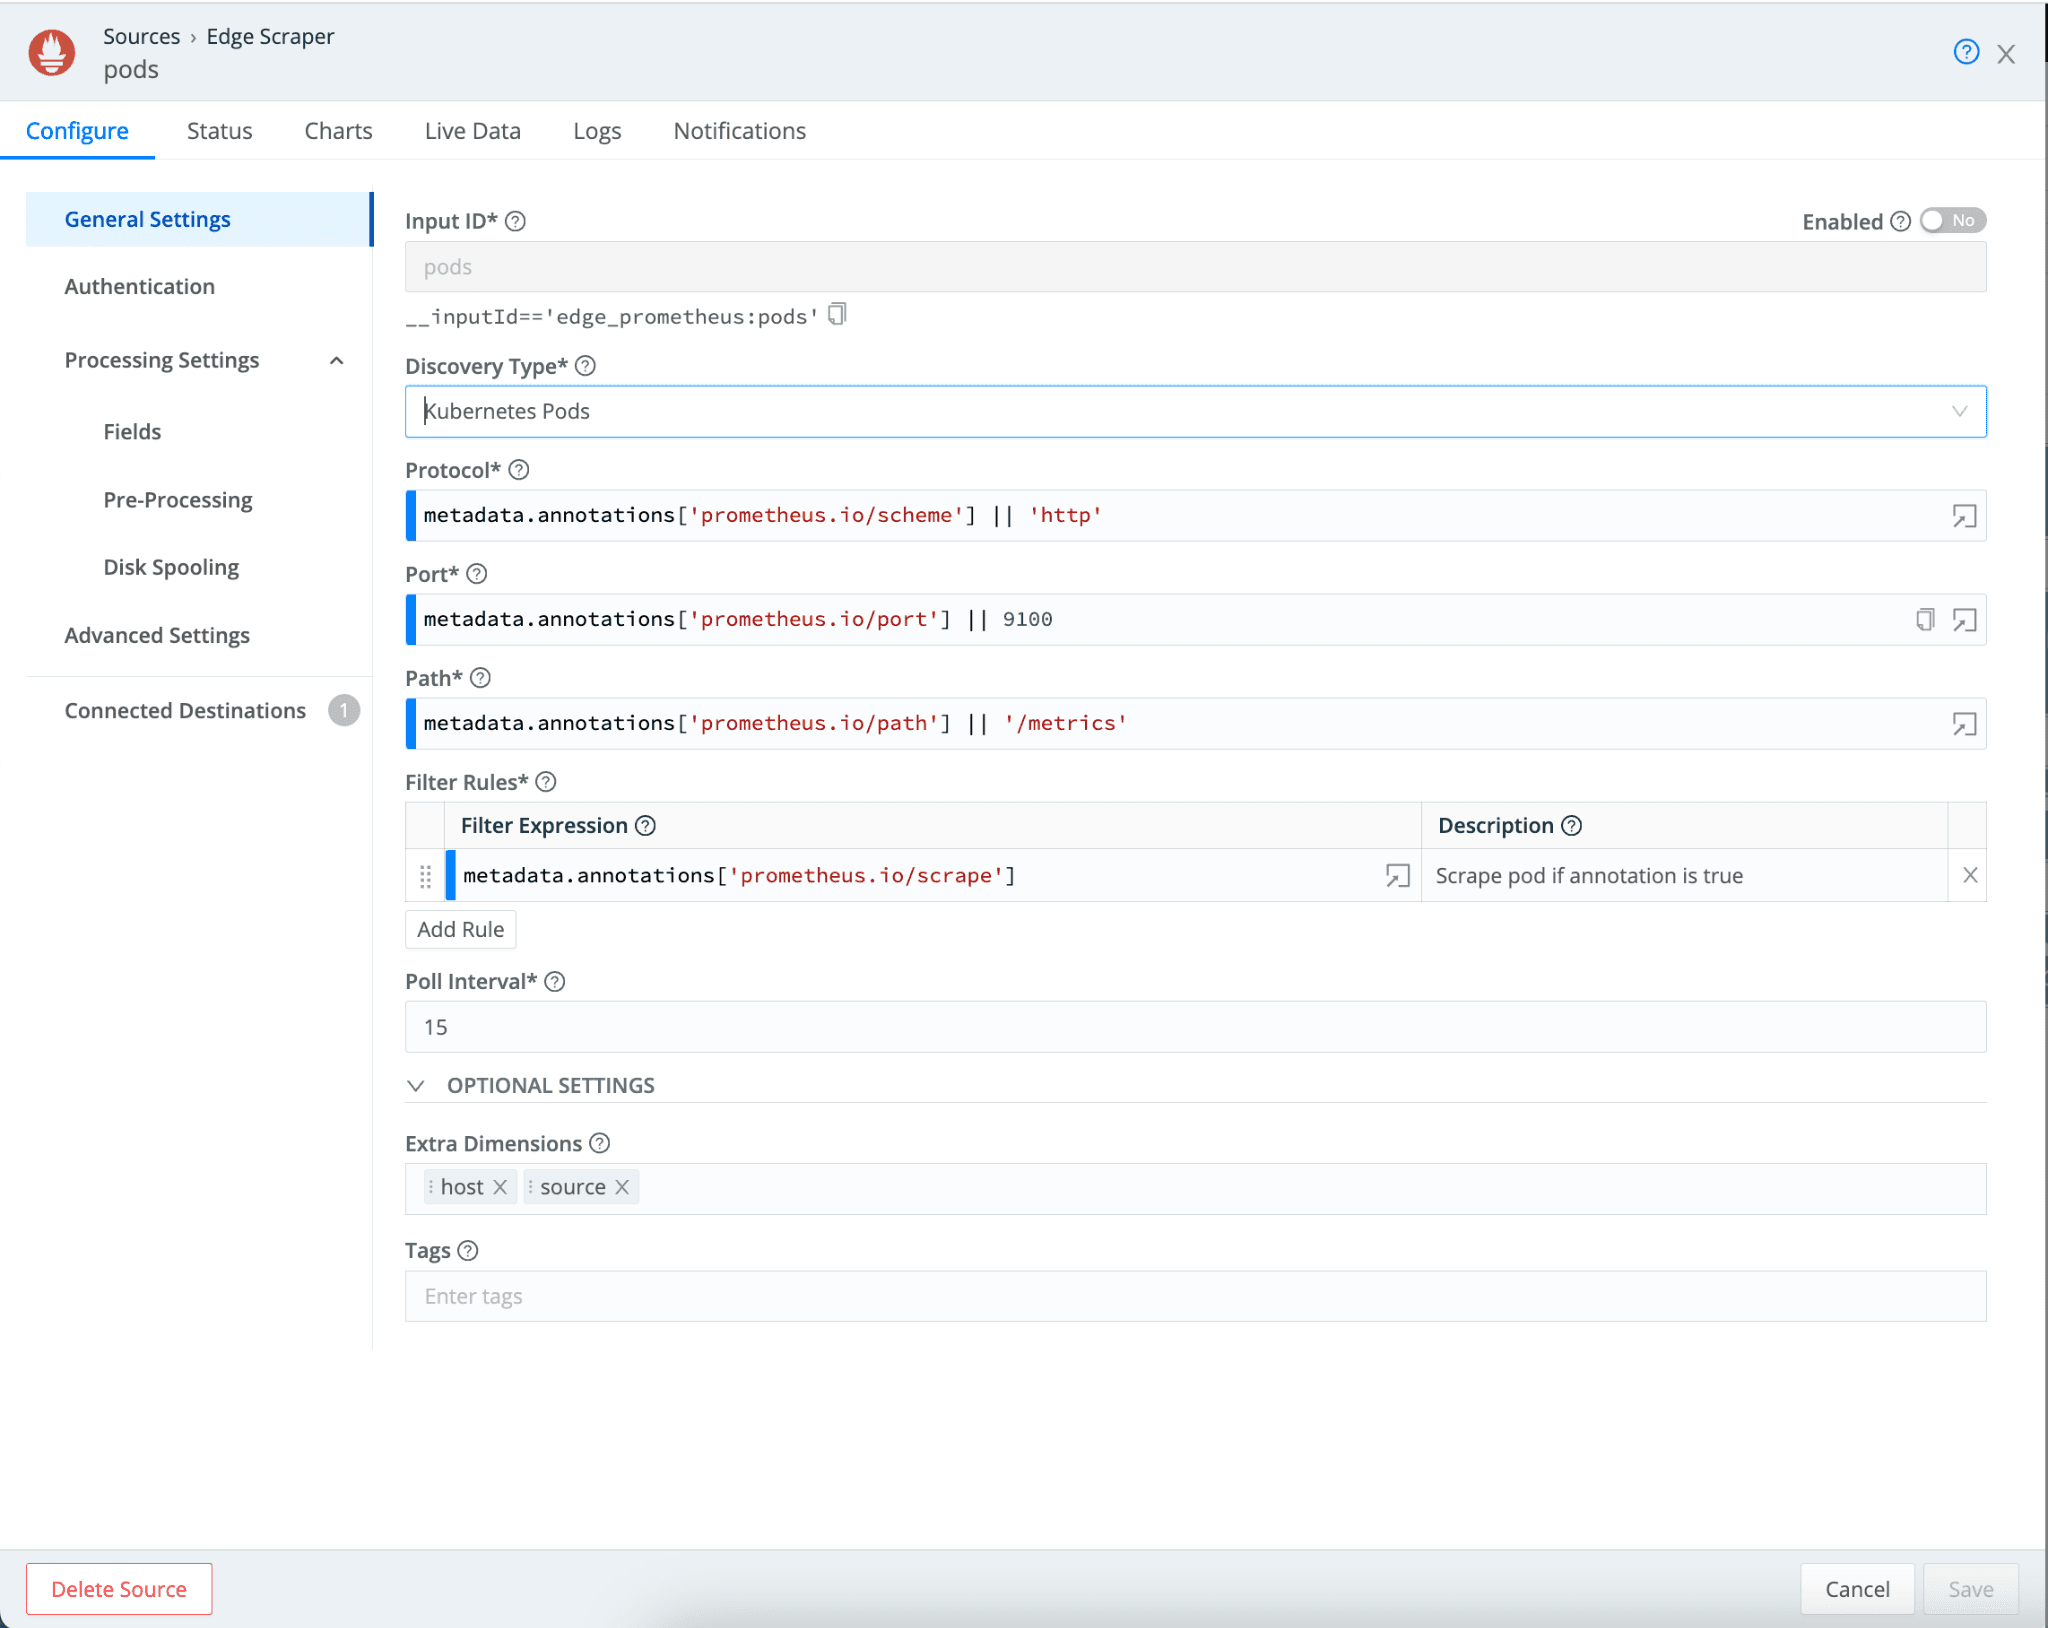
Kubernetes Pod: The Prometheus Edge Scraper offers this new discovery type. It emulates the way Prometheus discovers pods from which metrics can be scraped.
In most Prometheus scrape_config configurations, there are several annotations that identify endpoints where metrics should be scraped, like prometheus.io/scrape, prometheus.io/path, and prometheus.io/scheme.
You can continue to use these annotations to discover relevant targets to scrape metrics from using the Kubernetes Pod discovery type. Optionally, you can override them with your own values.
The Pod Discovery dialog below the expression:
metadata.annotations['prometheus.io/scheme'] || 'http'
evaluates to: if annotation ‘prometheus.io/scheme’ is configured, use the value or use ‘http’. The Filter rules specify which Pods to scrape targets from. All endpoints on pods with an annotation prometheus.io/scrape set to true will be scraped in the example below.
In conclusion, the Prometheus Edge Scraper is an excellent tool for replacing existing Prometheus Monitoring Systems, as it requires minimal configuration and requires no modifications to existing targets.
“We have Cribl Edge installed on all of our test Kubernetes nodes to gather logs and metrics. So far, it’s already a lot easier than deploying the Splunk forwarder. It deploys in five minutes, and then it’s done.”Joris Vuffray – Head of Network & System Management, Swisslo
See us at KubeCon this week!
“We have Cribl Edge installed on all of our test Kubernetes nodes to gather logs and metrics. So far, it’s already much easier than deploying the Splunk forwarder. It deploys in five minutes, and then it’s done.” Joris Vuffray, Head of Network & System Management at Swisslos, a Swiss lottery company that offers lotteries, sports bets, and instant tickets in Switzerland.
To learn more about this success story and how Cribl can empower your organization to make Kubernetes O11y simpler, join us at KubeCon booth number P22.