In a nutshell
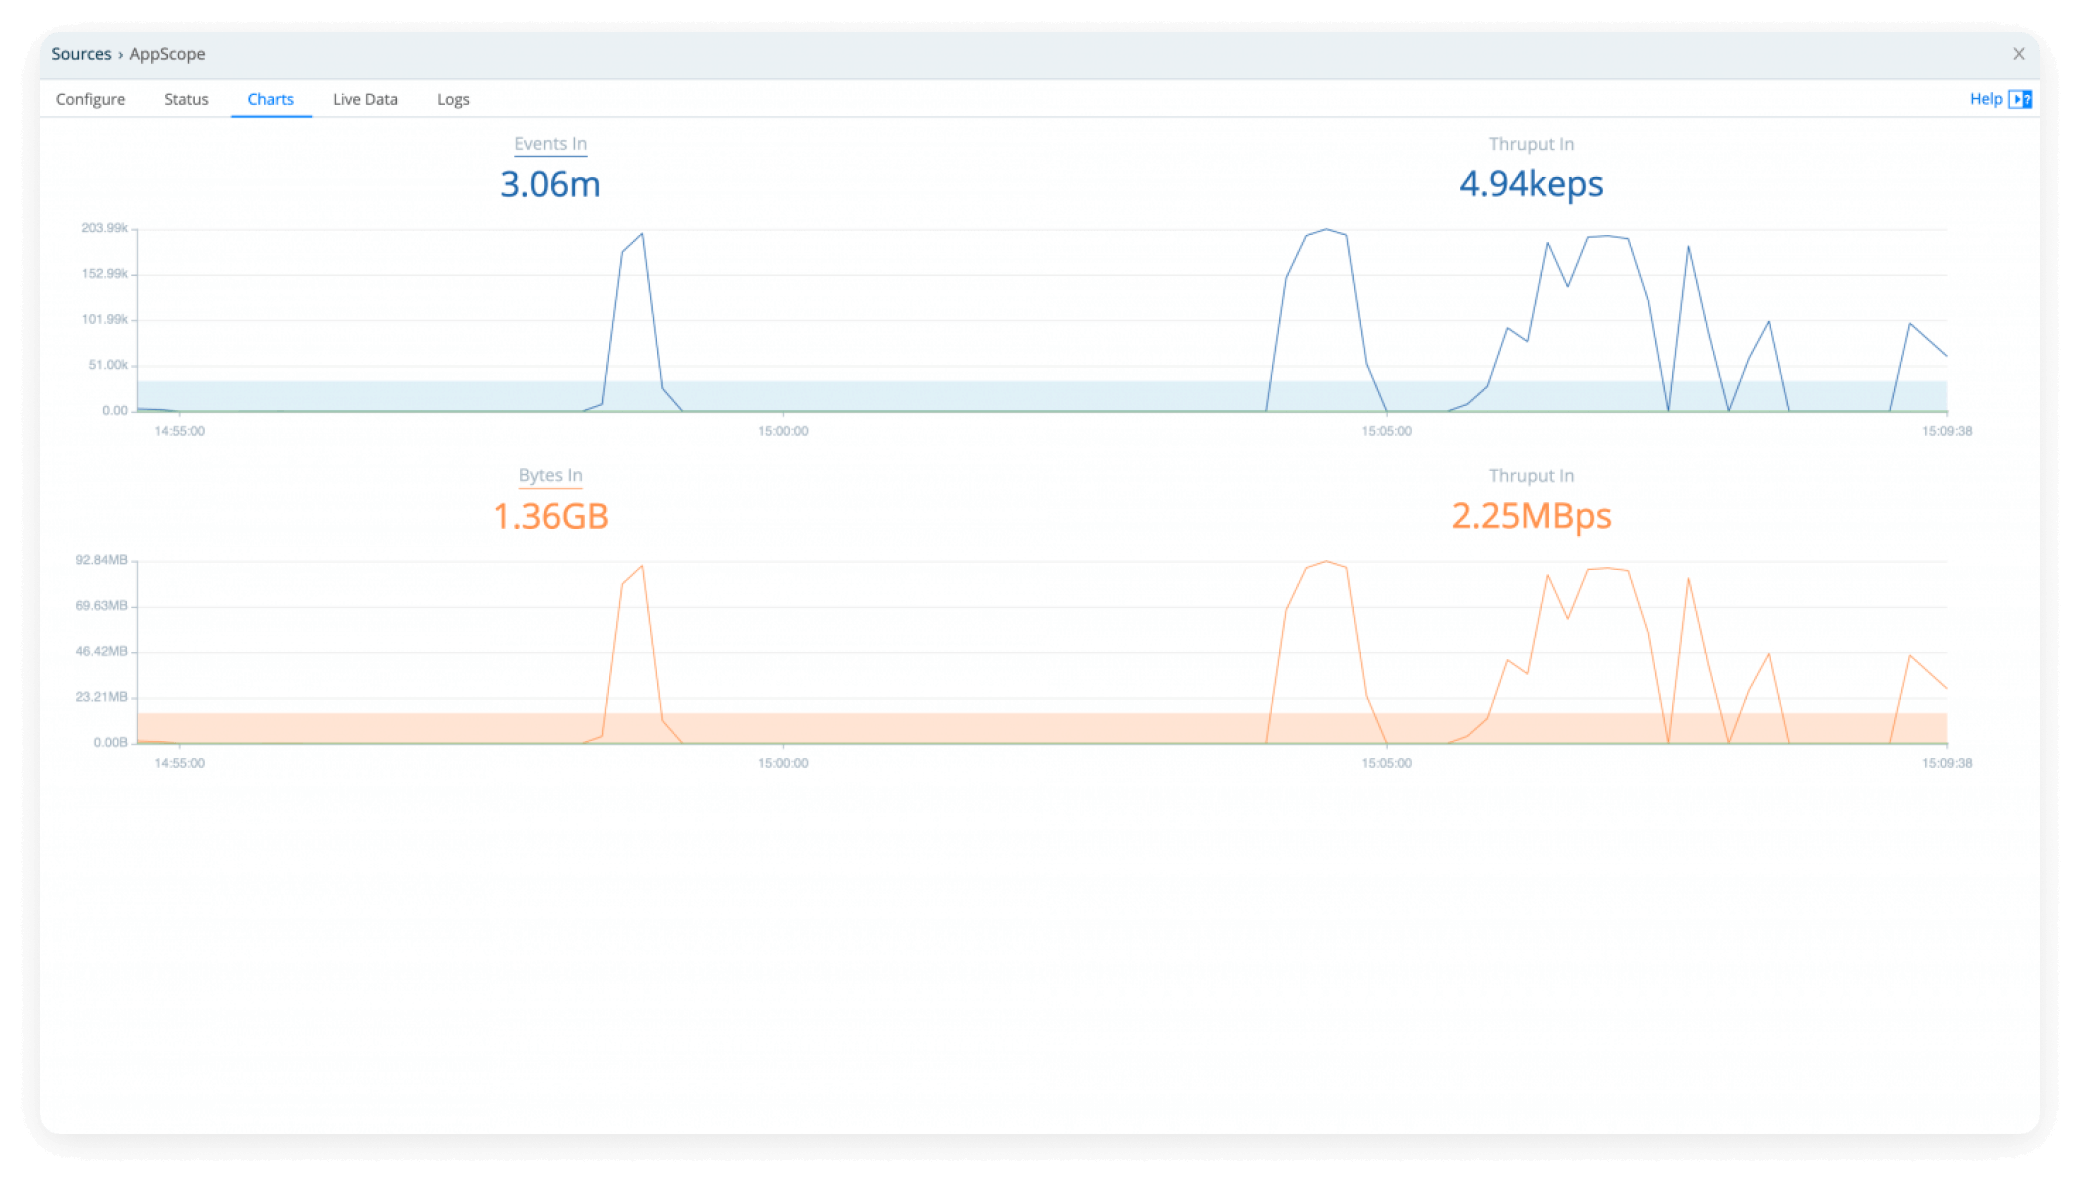
By and for operations and security teams versus development teams, AppScope aims to give operators the visibility they need into application behavior, metrics and, events. There’s no need to ask developers to re-instrument code, no need to append side cars or log shippers; with AppScope just add scope to any Linux binary and you’ll start seeing the telemetry you need, in open formats, ready to Stream into your existing log and metric tools for downstream troubleshooting, alerting, and reporting.

IT, Security, and Cloud Engineers
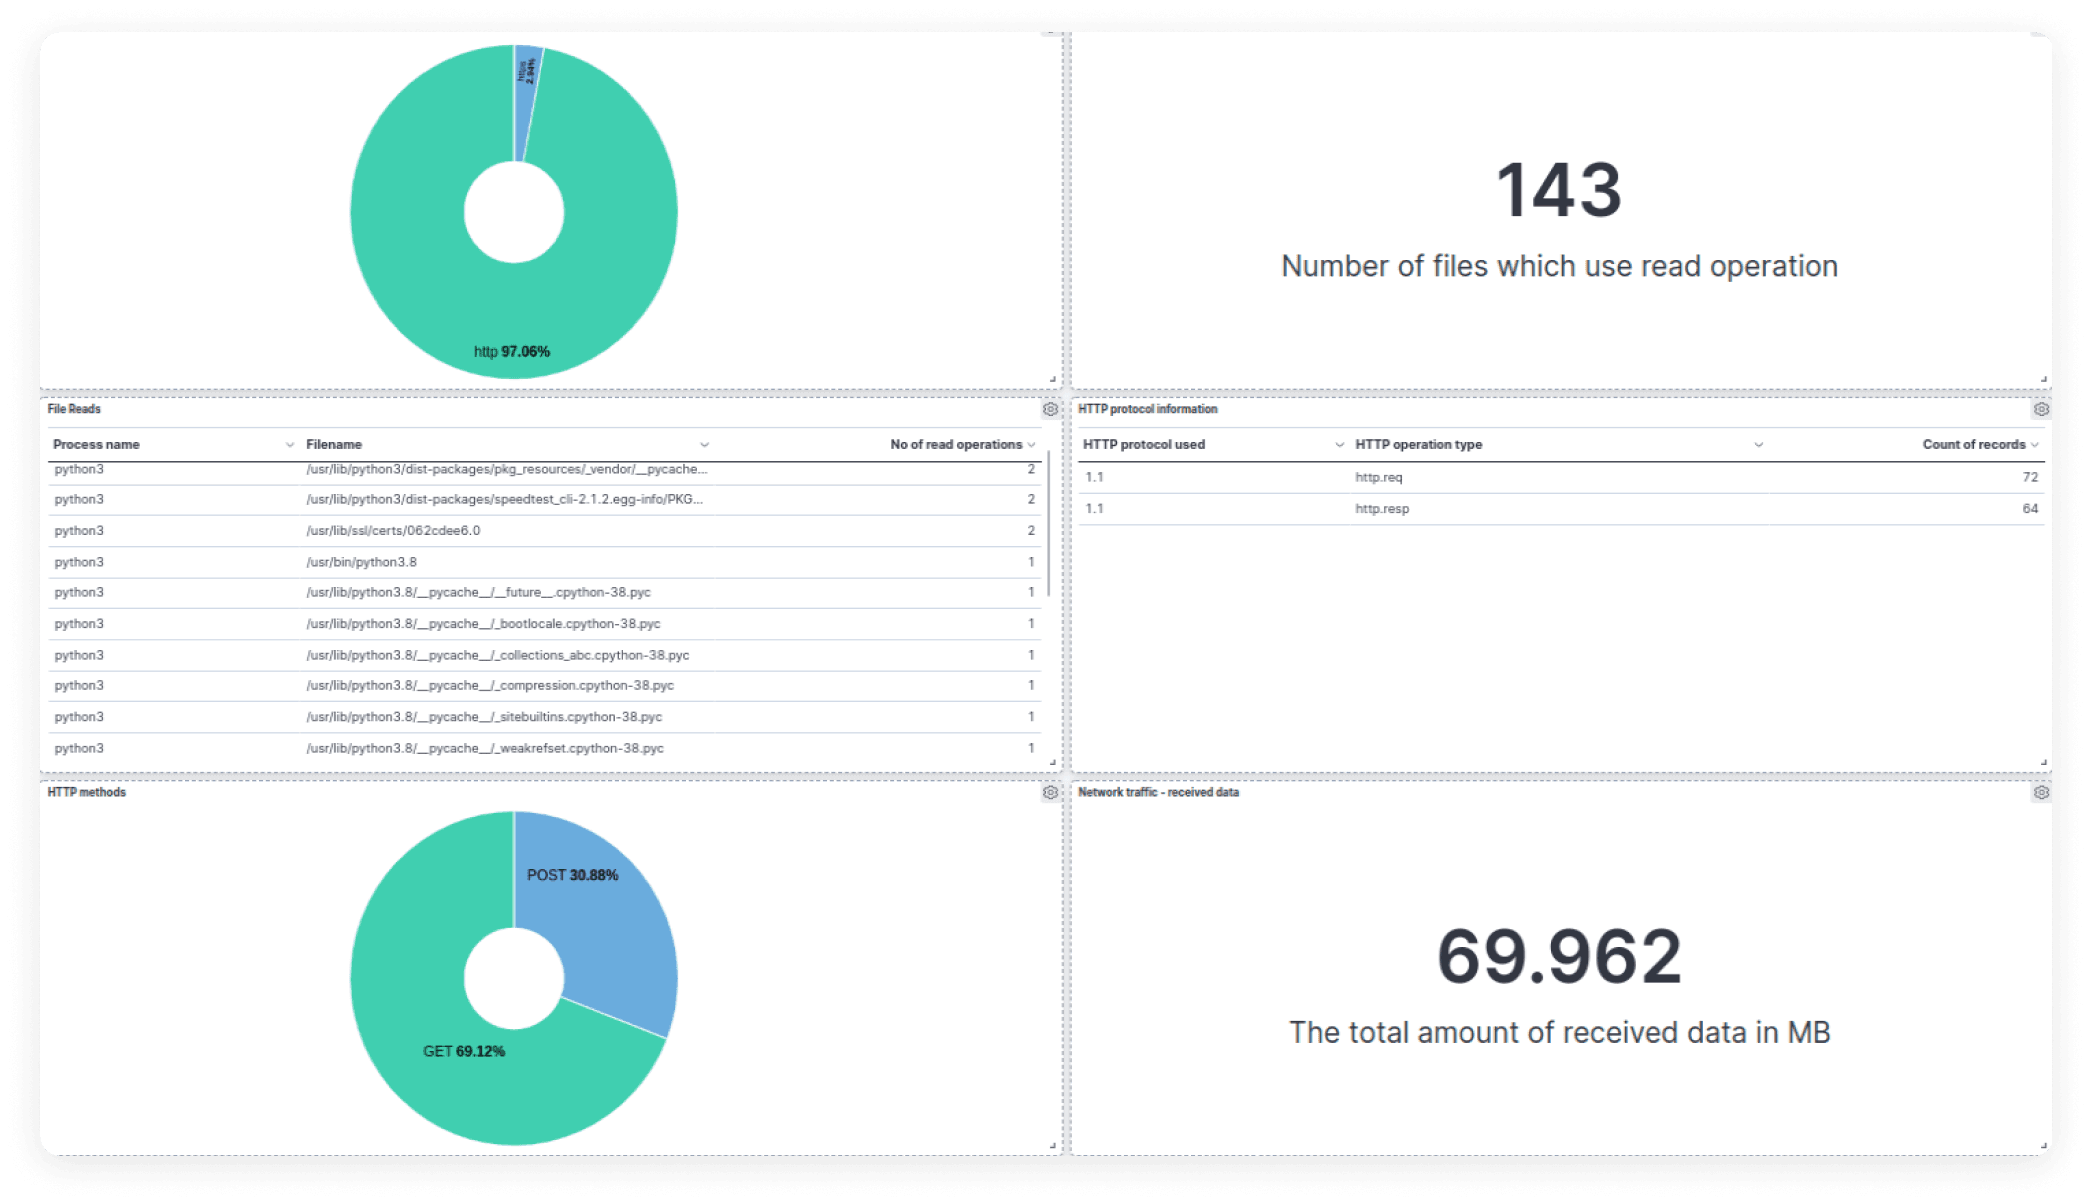
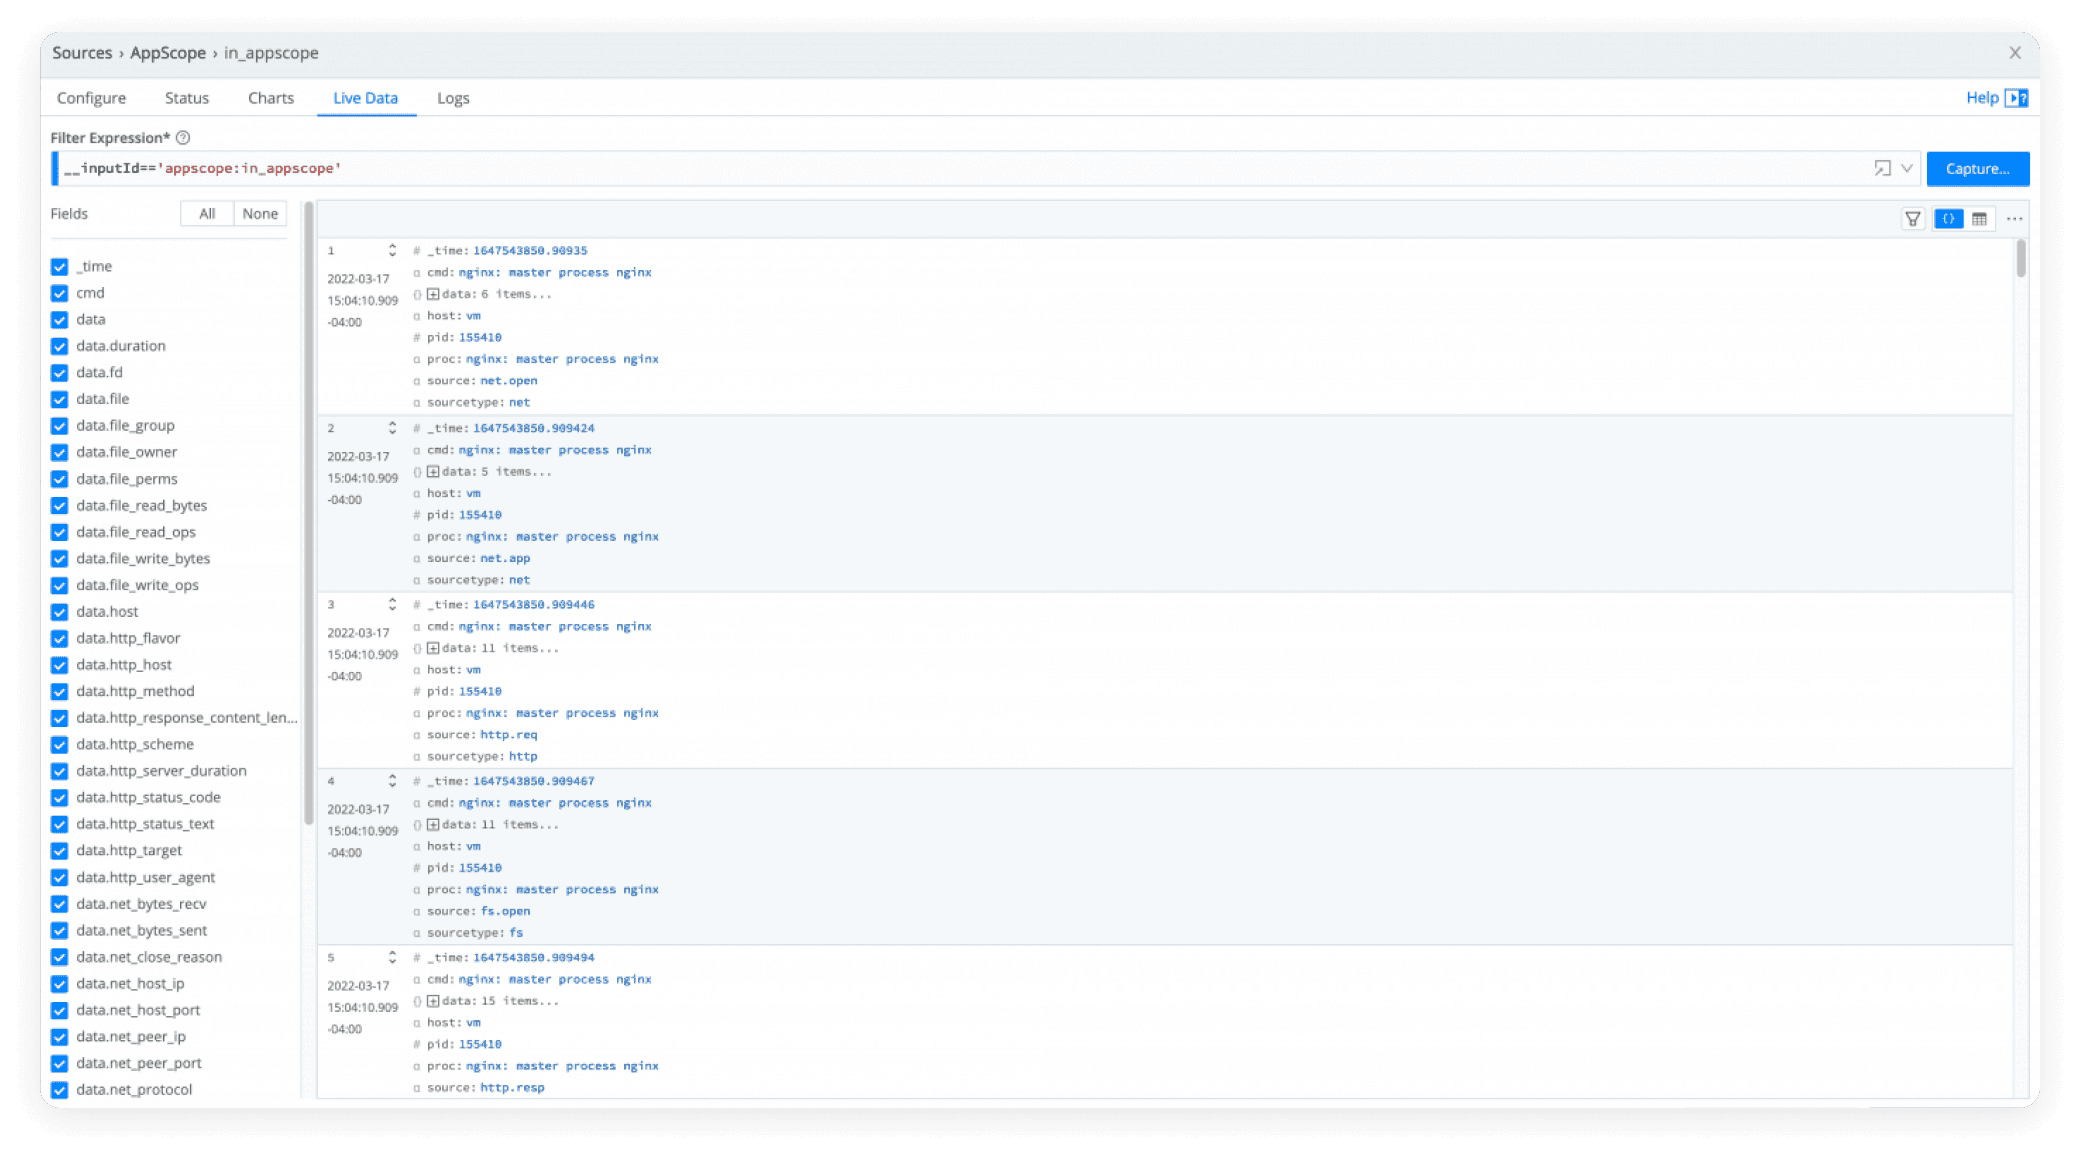
For IT Operations and Security engineers who want complete observability of their applications, AppScope is a universal instrumentation agent that provides full application visibility, including rate, error, and duration of HTTP requests, filesystem accesses, network flows, and performance metrics, from any Linux executable regardless of the runtime with zero changes or configuration required.

Administrators
For administrators of modern containerized workloads in Kubernetes, Fargate, ECS, or others, AppScope provides sidecar-less log collection from any application in any container with zero configuration. Minimal management and long-awaited visibility coming your way. Security teams will be pumped.

Security Researchers
For systems administrators and security researchers, AppScope provides an interactive troubleshooting experience which allows users to inspect the detailed behavior and performance of any application by prepending scope to the command or by attaching scope to the existing running process.
Capabilities
Simple installation with K8S
Consistent experience and visibility across runtimes
Provides observability of a proxy/service mesh, without the latency of a sidecar
Scopes any Linux binary by simply prepending scope
Collects application logs with zero configuration, no separate log agent necessary

Automatically collects metrics about application performance
Full payload visibility including into encrypted payloads
Automatically collects log data written by the application
Immediately see robust application behavior metrics and events

Works with all Linux apps and is language agnostic
Emits APM-like metric and event data, in open formats, to existing log and metric tools
Sends data as logs and metrics to existing tools

Resources


