
One of the more surprising realizations as we’ve started Cribl and started working with customers across all kinds of industry verticals is that nearly 100% of our customers and prospects are using multiple tools to solve their log analysis needs. Security alone can have 3 or more consumers of their log data. However, every log analysis or streams processing product requires its own ingestion pipeline and agent: Splunk Forwarder, Elastic Beats, NiFi’s MiNiFi, etc. Custom developed apps often support one wire protocol, for example Elastic’s Bulk Ingestion or Splunk’s HTTP Event Collector but there’s a desire to have some or all of the data in a different system.
Cribl LogStream is a universal adapter for your machine data. We can help connect data destined for ElasticSearch to Splunk, Kinesis to ElasticSearch, Kafka to S3, or any of our sources to any of our destinations. Cribl can also help reshape your data as its moving so that data that was originally intended for a different system can be modified to fit well at a new destination.
This post is presented in two forms: a video for those who prefer that method of consumption or a blog post for people who would prefer a written tutorial.
Video
Connecting Different Pipes from Cribl on Vimeo.
Connecting Different Pipes
Our goal for this post to is to walk you through downloading three products, Cribl, Splunk, and Elastic’s Filebeat; and getting them all up and working together in less than 10 minutes. The products we chose to connect were chosen for convenience and ease of getting started, not necessarily because of practicality. We’ve observed most Elastic to Splunk use cases are with custom applications, and most Splunk to Elastic use cases are forking some Splunk Forwarder data to Elastic.
In this post, we will:
Download Cribl, Splunk and Elastic’s Filebeat
Install Cribl as a Splunk App
Configure Cribl as an Elastic listener & Splunk Outputter
Configure Splunk as a Receiver
Configure Filebeat to talk to Cribl
Reshape data to Splunk’s native shape
Download Cribl, Splunk & Filebeat
First, we need all the bits on our machine. I used a Mac for building this demo and recording the video, but it should work equally well on Linux or Windows (if using Windows, you’ll need to modify example configs for directory names, directory separators, etc). Here are the download URLs for all three products. Note Cribl and Splunk require inputting a name and email address to download.
Cribl: https://cribl.io/download/
Download the “Cribl for Splunk” package
Splunk: https://www.splunk.com/en_us/download/splunk-enterprise.html
Recommended to download the
tar.gzversion for your platform.
After downloading I placed all the tar.gzfiles in /opt/cribl_demobut feel free to choose a destination folder that works well for you.
Extracting Splunk & Cribl
Inside your destination folder, we’ll need to extract Splunk & Cribl. First, lets extract Splunk:
tar zxvf splunk-<version>-<hash>-<platform>.tar.gzNext, we need to extract Cribl into the $SPLUNK_HOME/etc/appsdirectory:
tar -C splunk/etc/apps -zxvf cribl-splunk-app--.tgzUsing the -Ctells tar to extract in the passed directory. Validate Cribl has been properly extracted:
ls splunk/etc/apps/criblYou should see bin, default, and modulesdirectories. Next, we need to start up Splunk.
splunk/bin/splunk startWait for Splunk to start up. Splunk will prompt you to setup an admin username and password. Cribl will also use this same username and password, so make sure you remember what you set it to! Splunk and Cribl should now be running at the following URLs:
Splunk: http://localhost:8000
Cribl: https://localhost:9000
Configuring Cribl
Now, we need to configure Cribl, both for a source for Elastic and a destination for Splunk. First, lets configure the Elastic Source. Log into Cribl and click on Sources at the top and then click Add Newto the upper right.
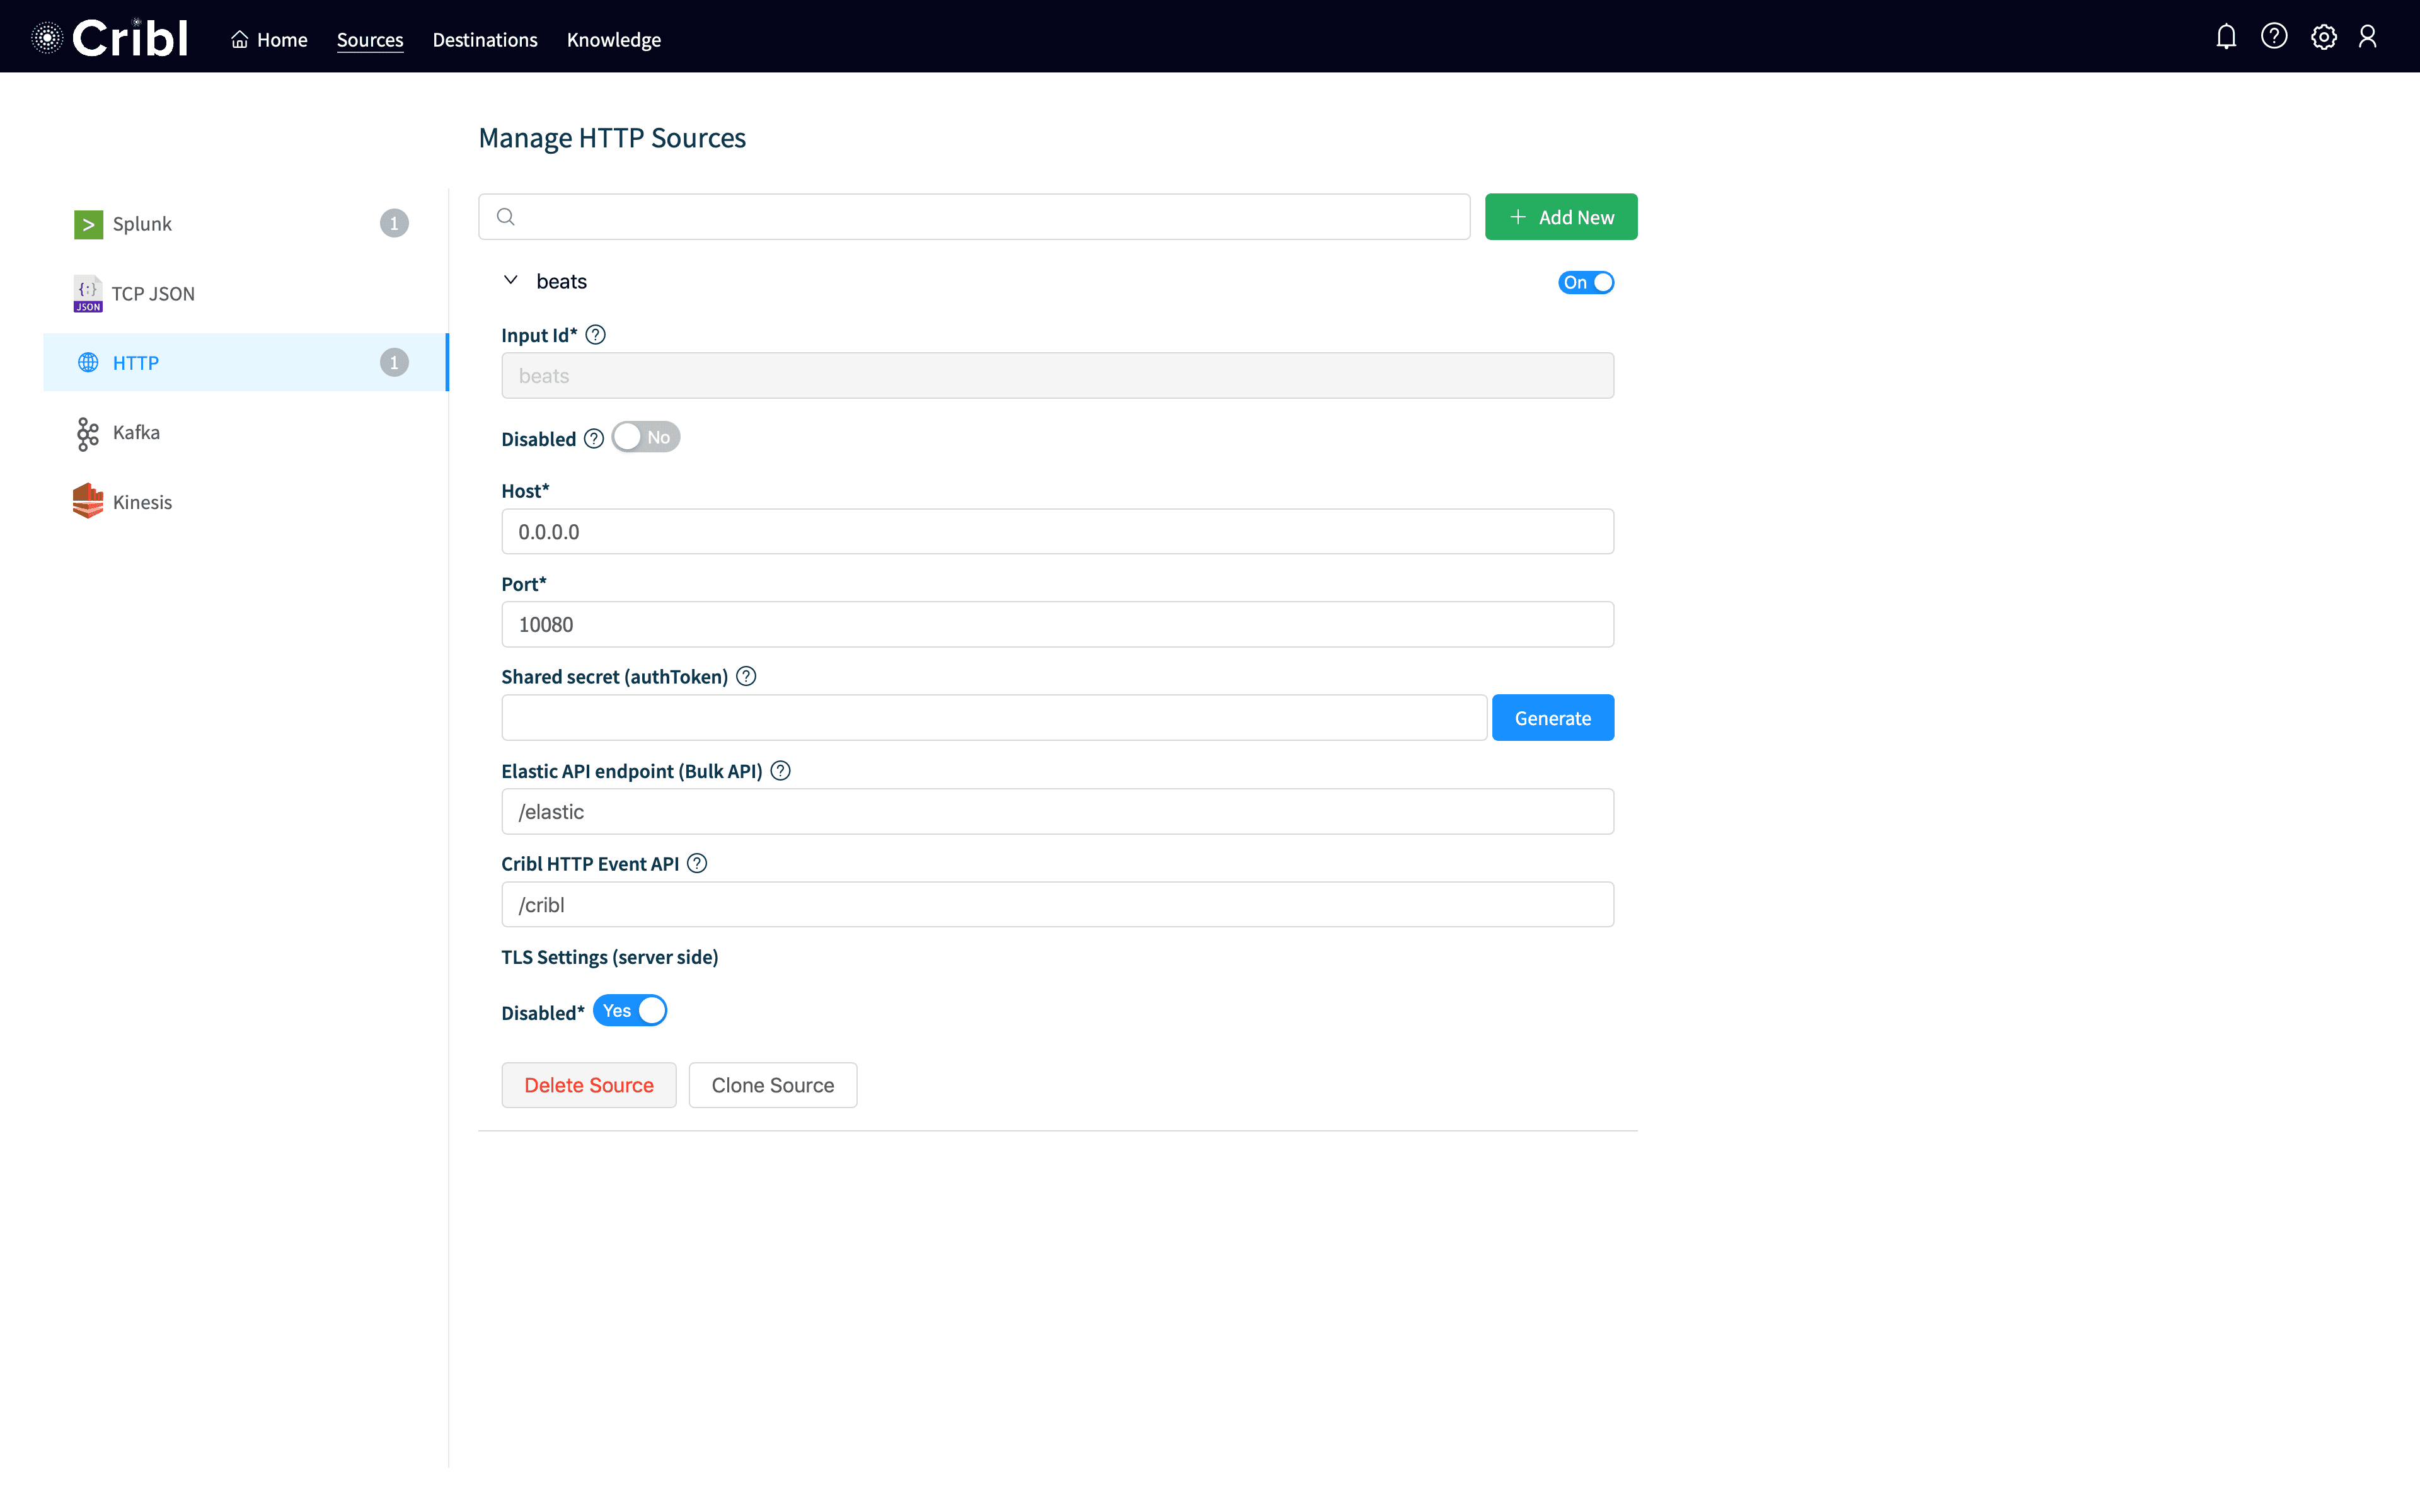
You should see a screen like the above. I called my input beats, but you could name it anything. I set Hostto 0.0.0.0, so it will listen on all interfaces. I set my Portto 10080, which can be any port but that’s the one I used (and filebeat.ymlwill reference this port so if you change it change it everywhere). Hit Save at the bottom and your input should be up and working.
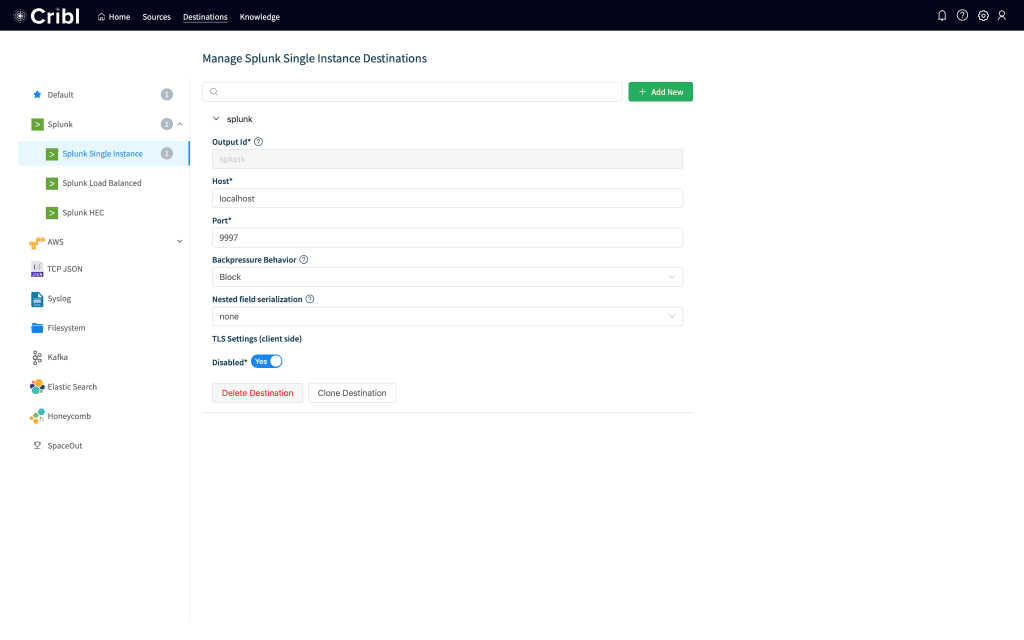
Next, we need to configure Splunk as our destination. Click on Destinationsat the top and then click on Splunkto the left. Click Add New, and in the input put in splunk for the Id, localhost for the Host and 9997 for the Port. Leave everything else at the default and click Save. Your destination should look like this:
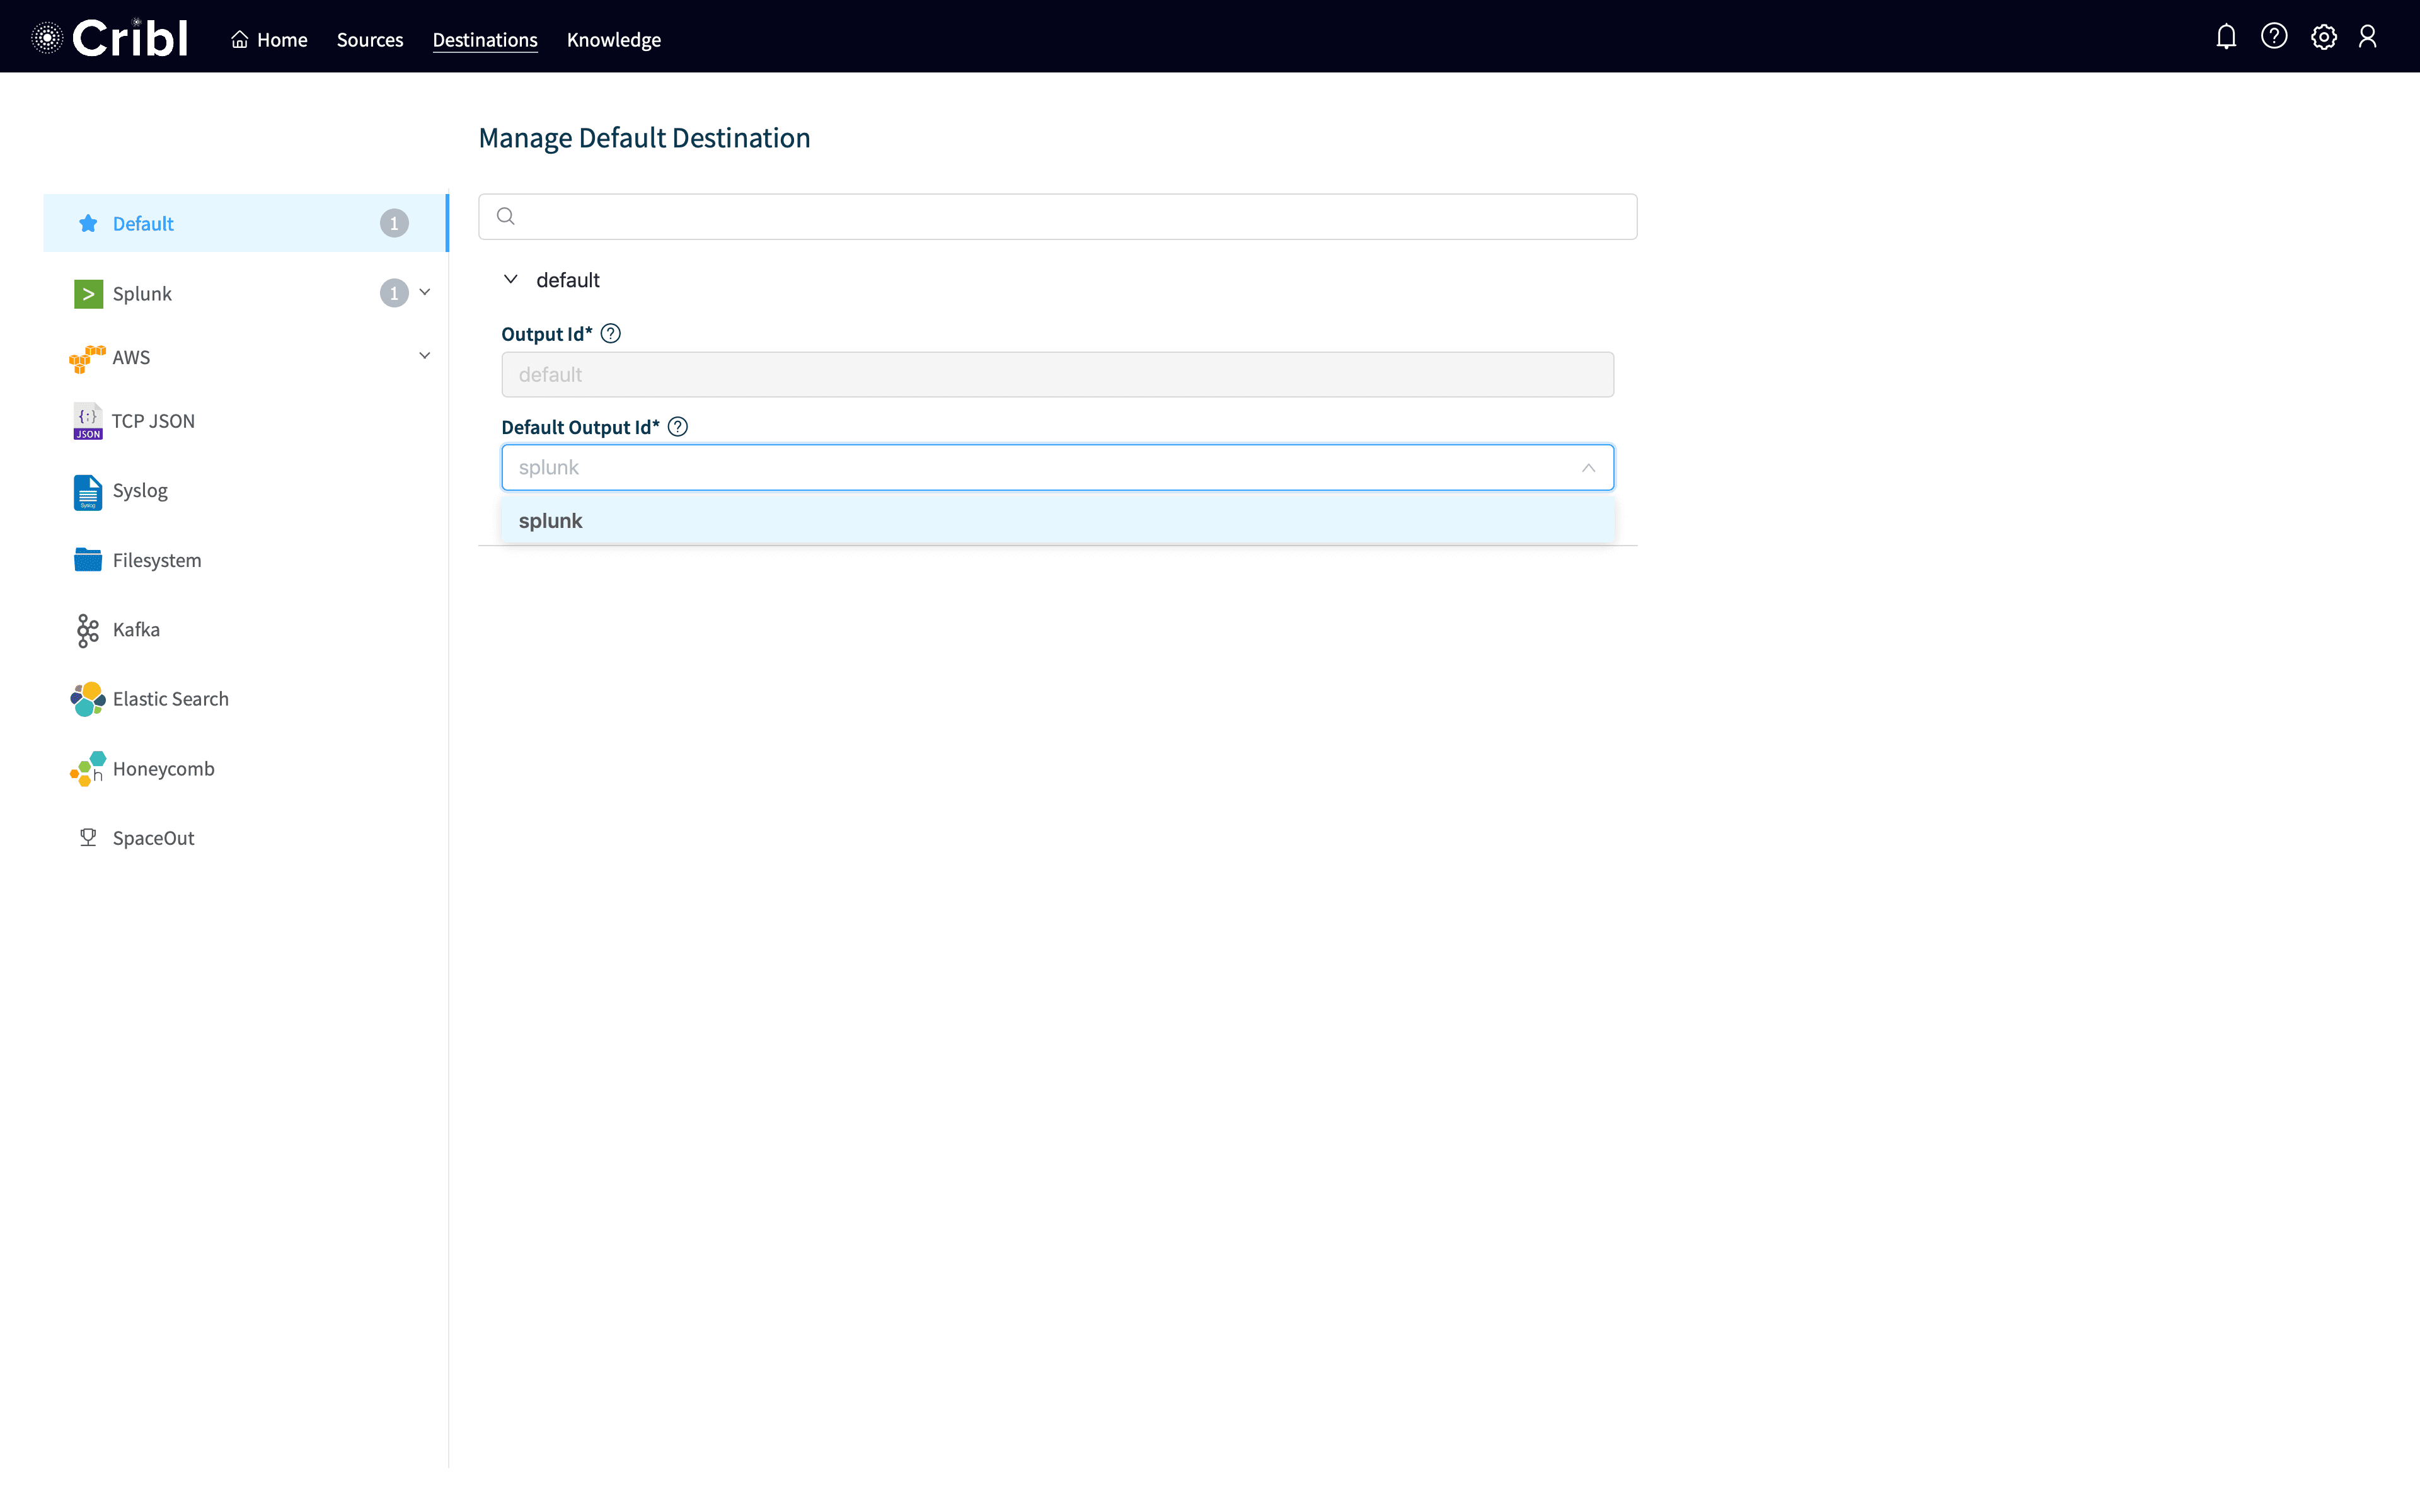
The last thing we need to do is to set splunkas the default output. Click on Default on the list on the left and then select splunk as the output and click Save. Your screen should look like:
Configure Splunk as a Receiver
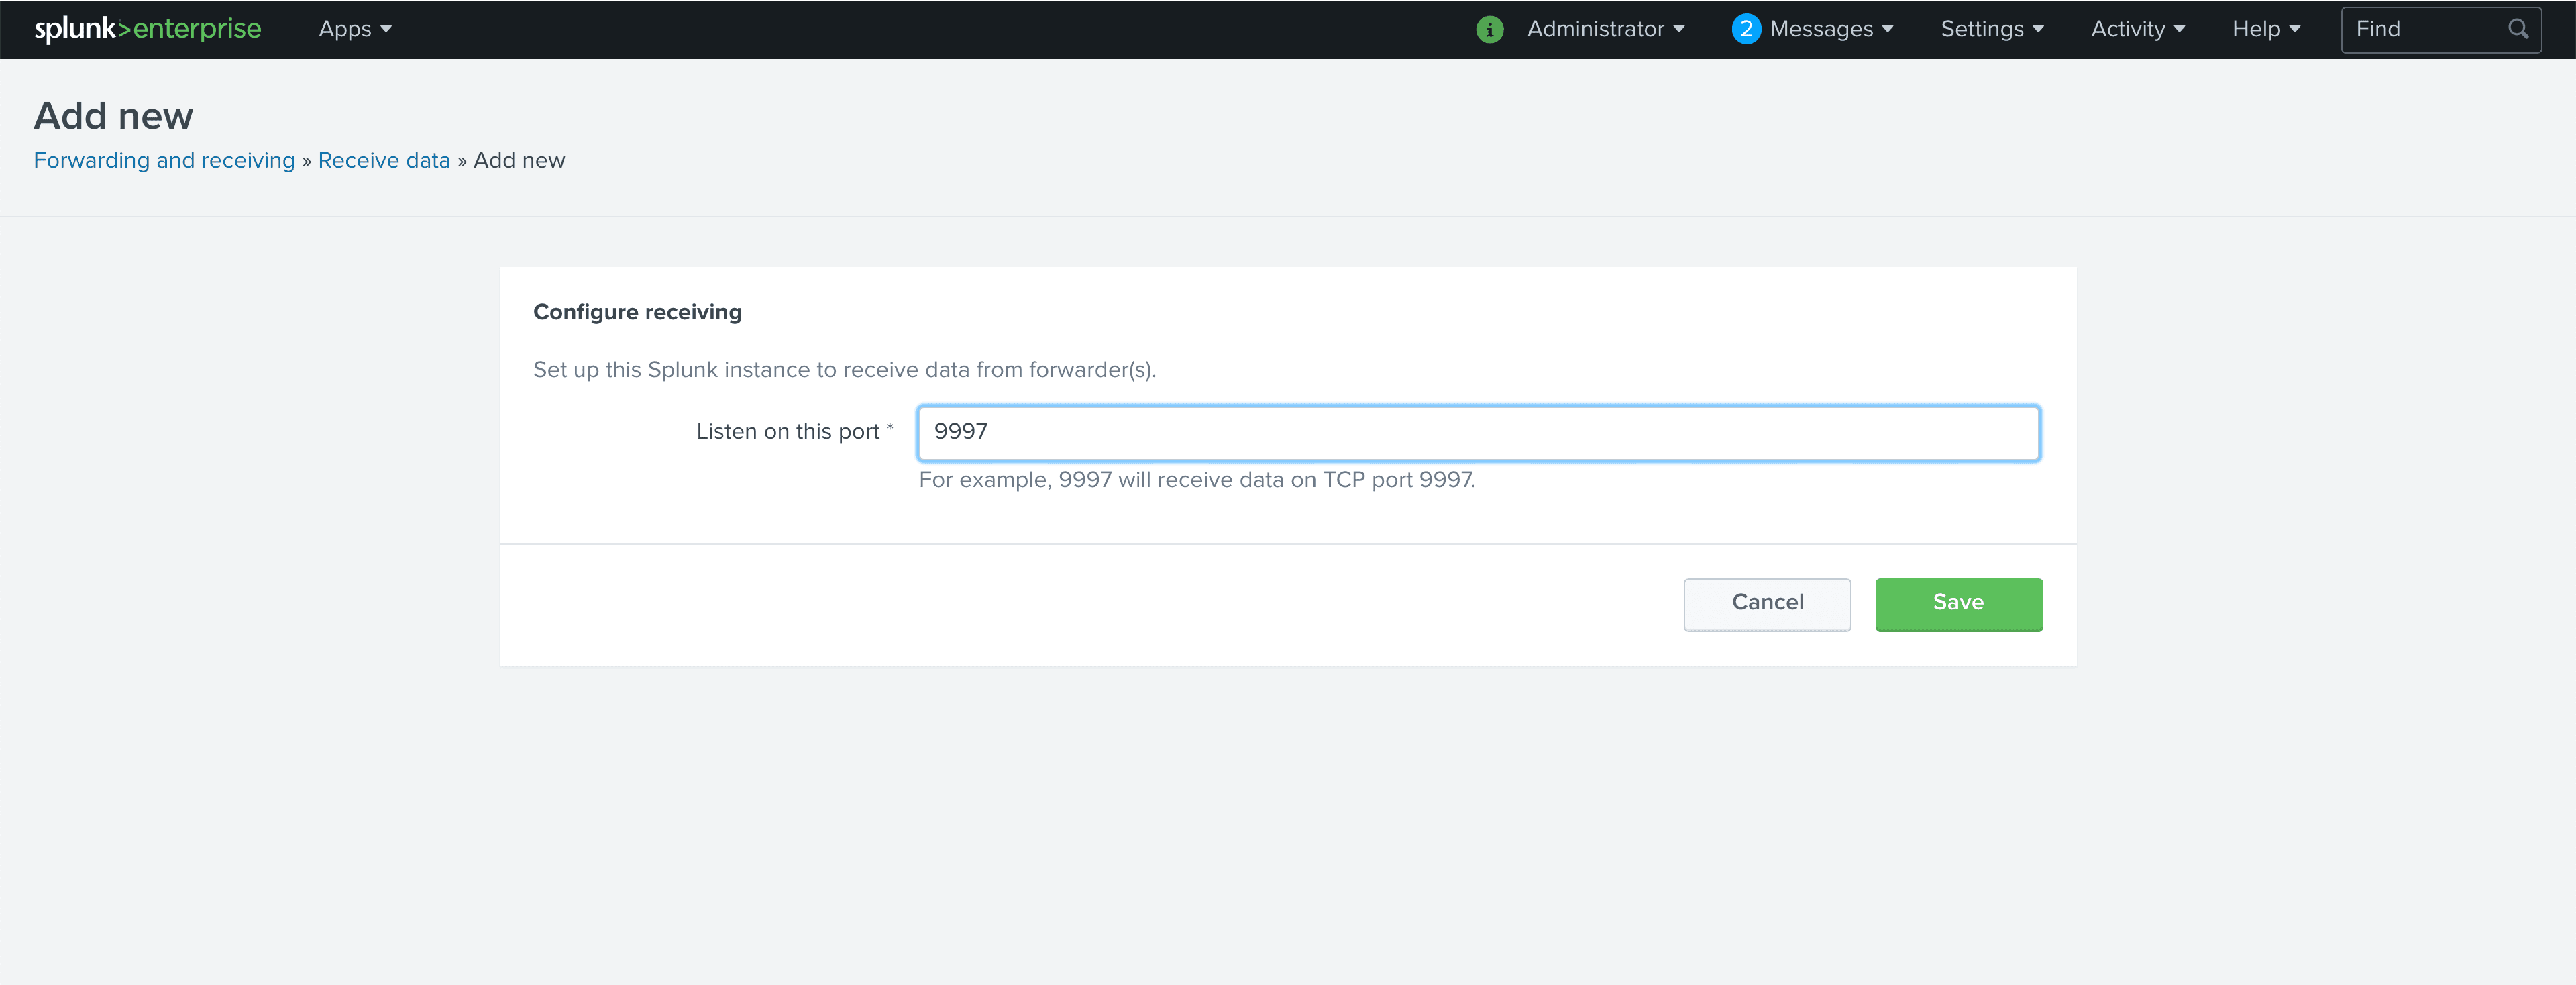
By default, Splunk is not configured to listen for data from forwarders. We need to configure it to listen. The standard port in Splunk installs is 9997for forwarders, so we’re going to configure Splunk to receive on port 9997. In Splunk, click Settings and then Forwarding and Receiving. Once that screen loads, click on Add new next to Configure Receiving. When the form pops up, put 9997 in Listen on this port and click Save.
Configure Filebeat to talk to Cribl
Now we need to configure Filebeat. In this example, I’m configuring Filebeat to monitor /var/logfor any file with a .logsuffix and send it to Cribl. First, we need to extract Filebeat.
tar zxvf filebeat--.tar.gzWith it extracted, we need to put a configuration in that will work for us. Here’s the configuration I’ve used:
filebeat.inputs:
- type: log
  enabled: true
  paths:
    - /var/log/*.log

output.elasticsearch:
  hosts: ["http://localhost:10080/elastic"]
To install this, I’ll use my editor of choice, vim, but substitute whatever editor you’re familiar with. We need to move the existing filebeat.yml off to another file and then paste the above into a new filebeat.yml.
cd filebeat-<version>-<platform>
mv filebeat.yml filebeat.yml.orig
vi filebeat.yml
sudo chown root:root ./filebeat.yml
sudo ./filebeat -c ./filebeat.yml
Now we should have Filebeat running. We need root to read /var/log, and Filebeat needs its configuration file owned by the same user that’s running it. After this is started up, we should see data coming into Cribl with Events In and Events Out being non-zero.
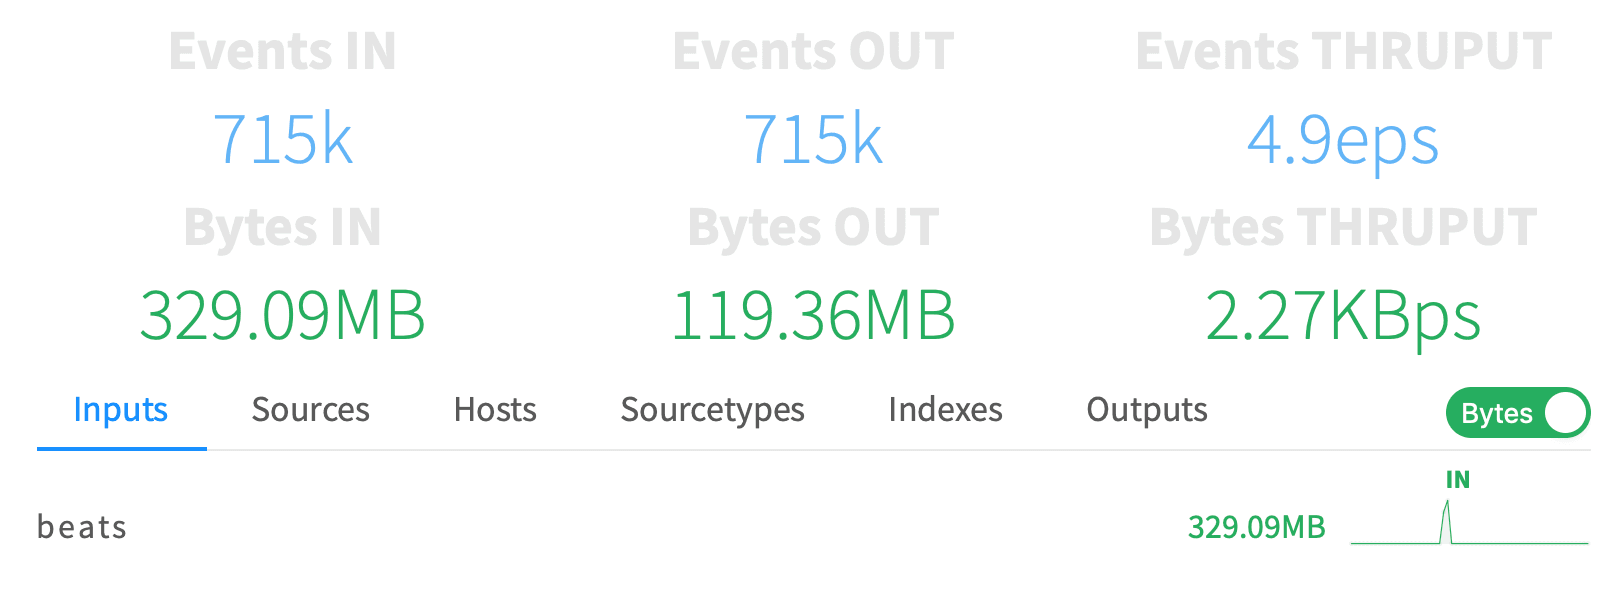
As we hop into Splunk, we should see events in our main index.
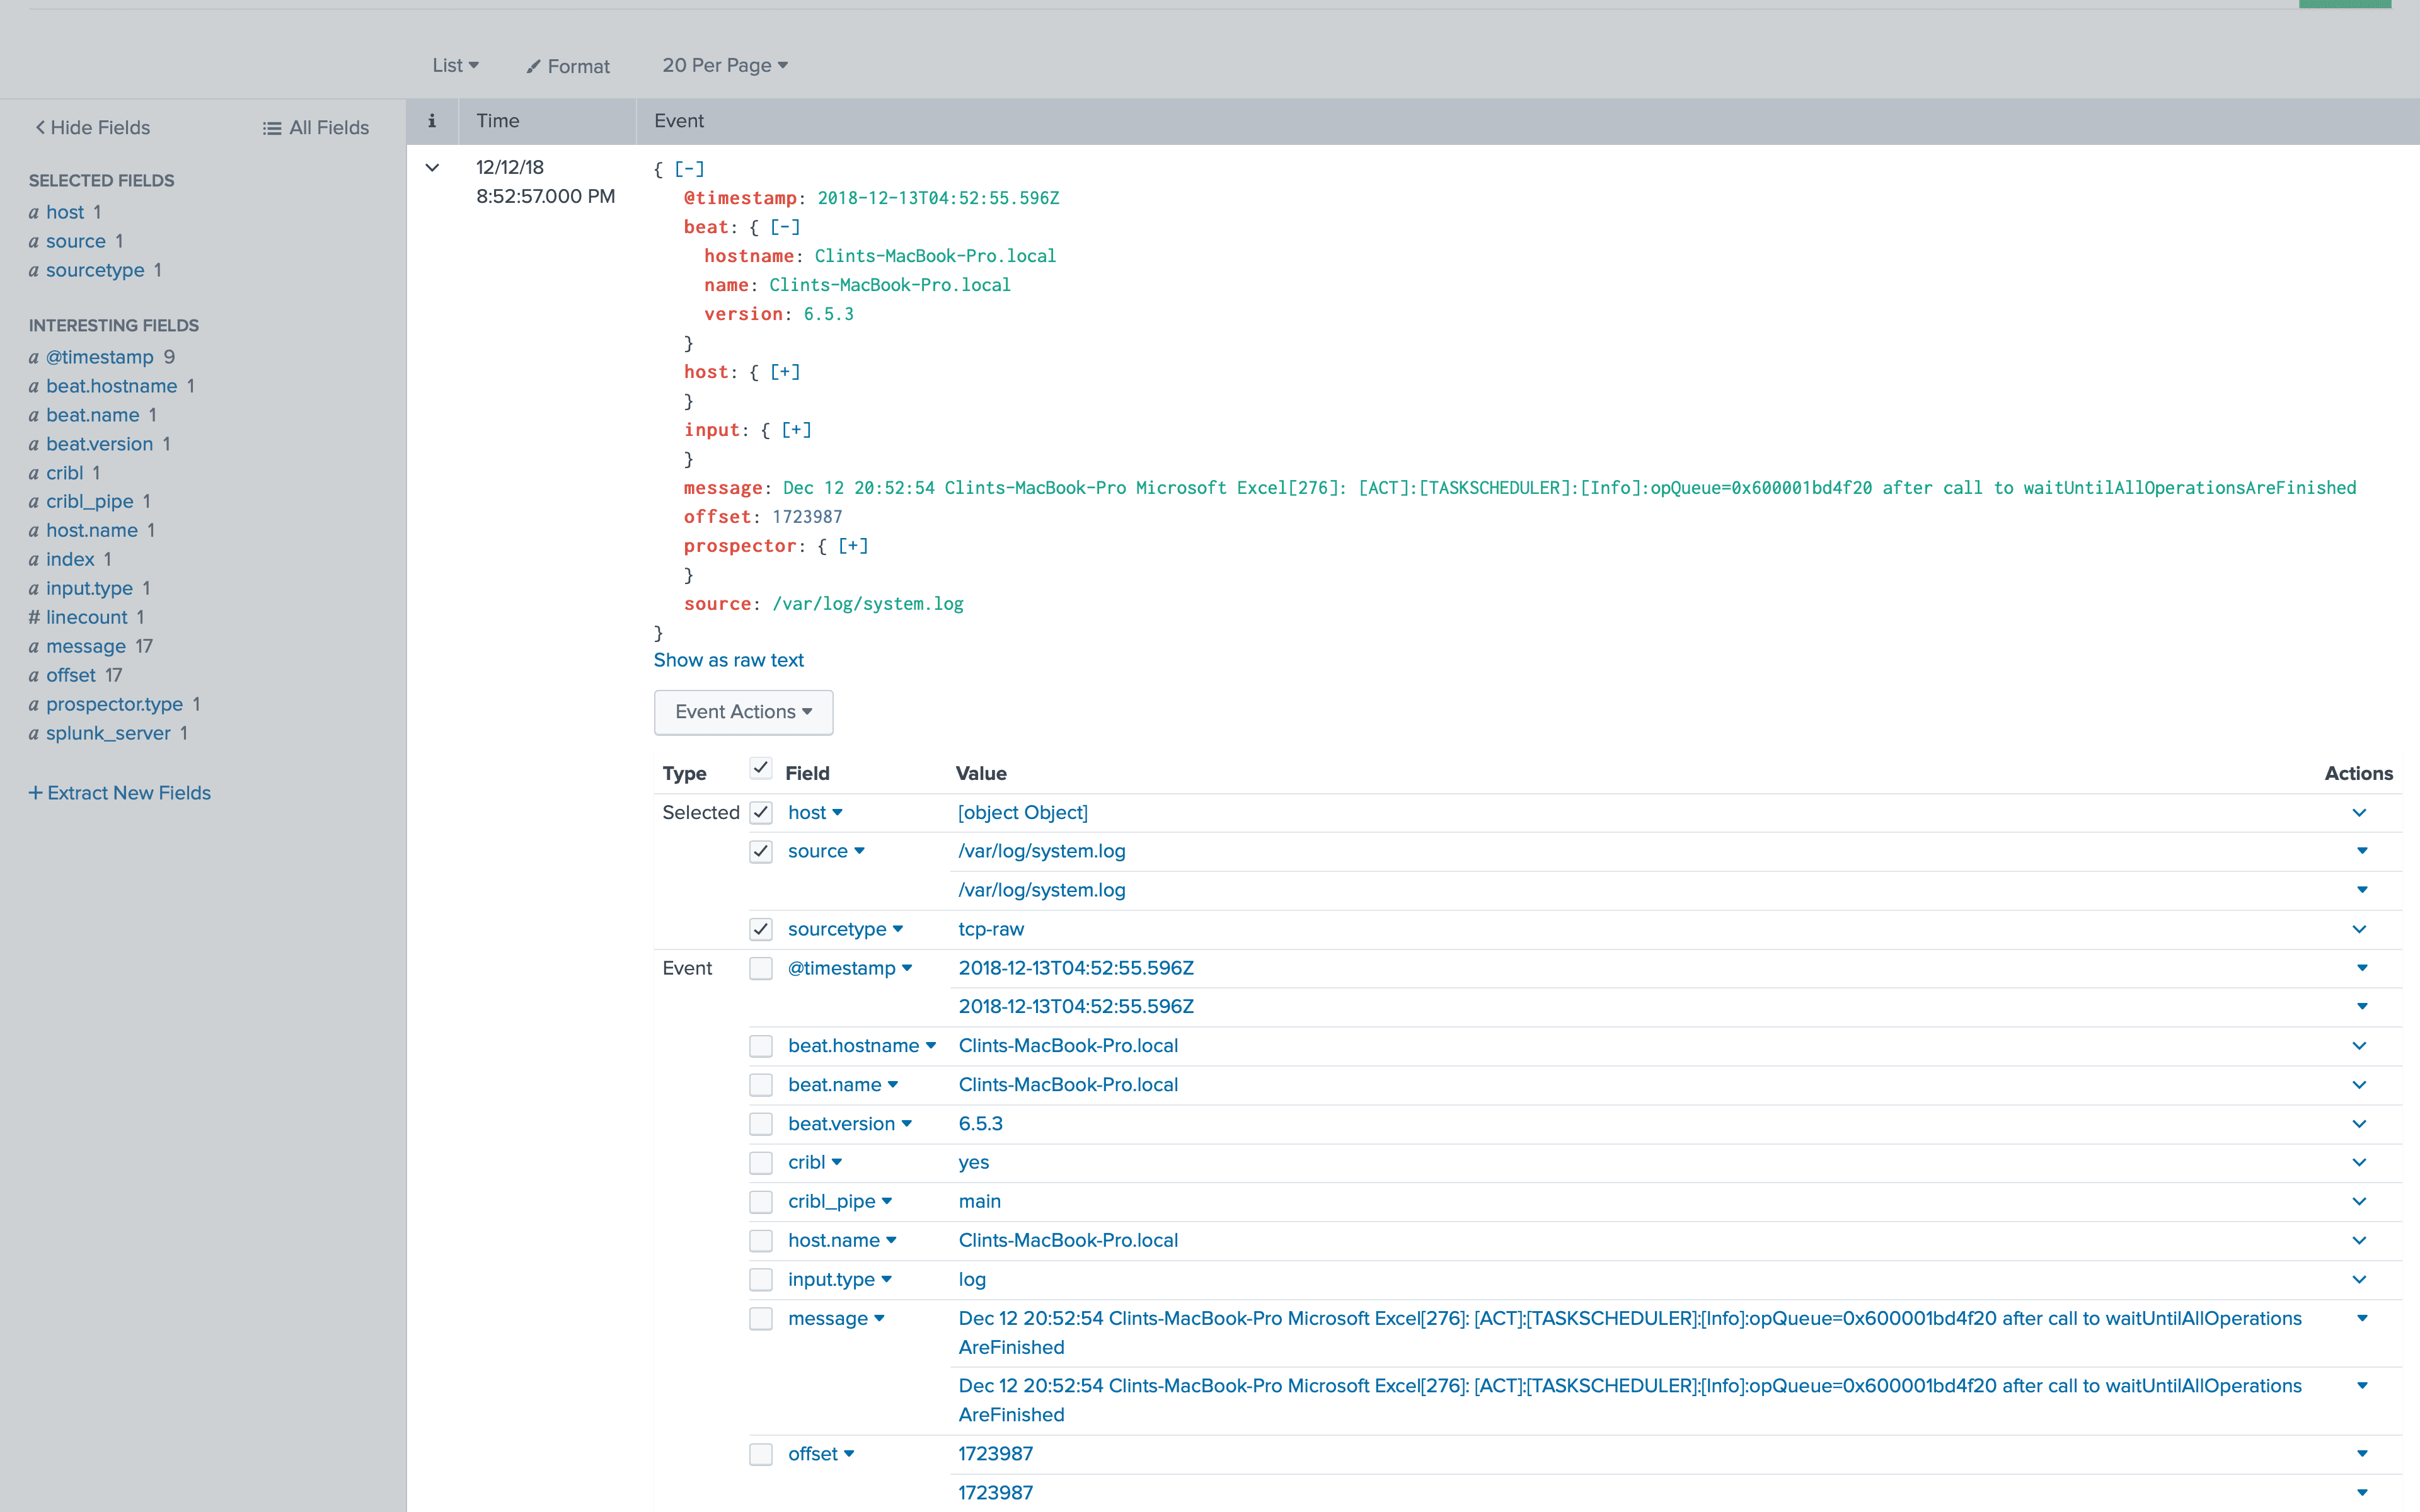
As we examine the data, we notice it’s not exactly in the best shape for Splunk. The log message is buried in the JSON, and we’d like that to be the line we see for the log, which means it should be set to Splunk’s _raw field. Also, we have a lot of high cardinality fields being output like message, offset and opField which will just take up extra space in our index and slow down ingestion performance. Lastly, Filebeat doesn’t extract timestamps automatically without configuring it for every type of timestamp, so we would like to get data properly timestamped.
Reshape data to Splunk’s native shape
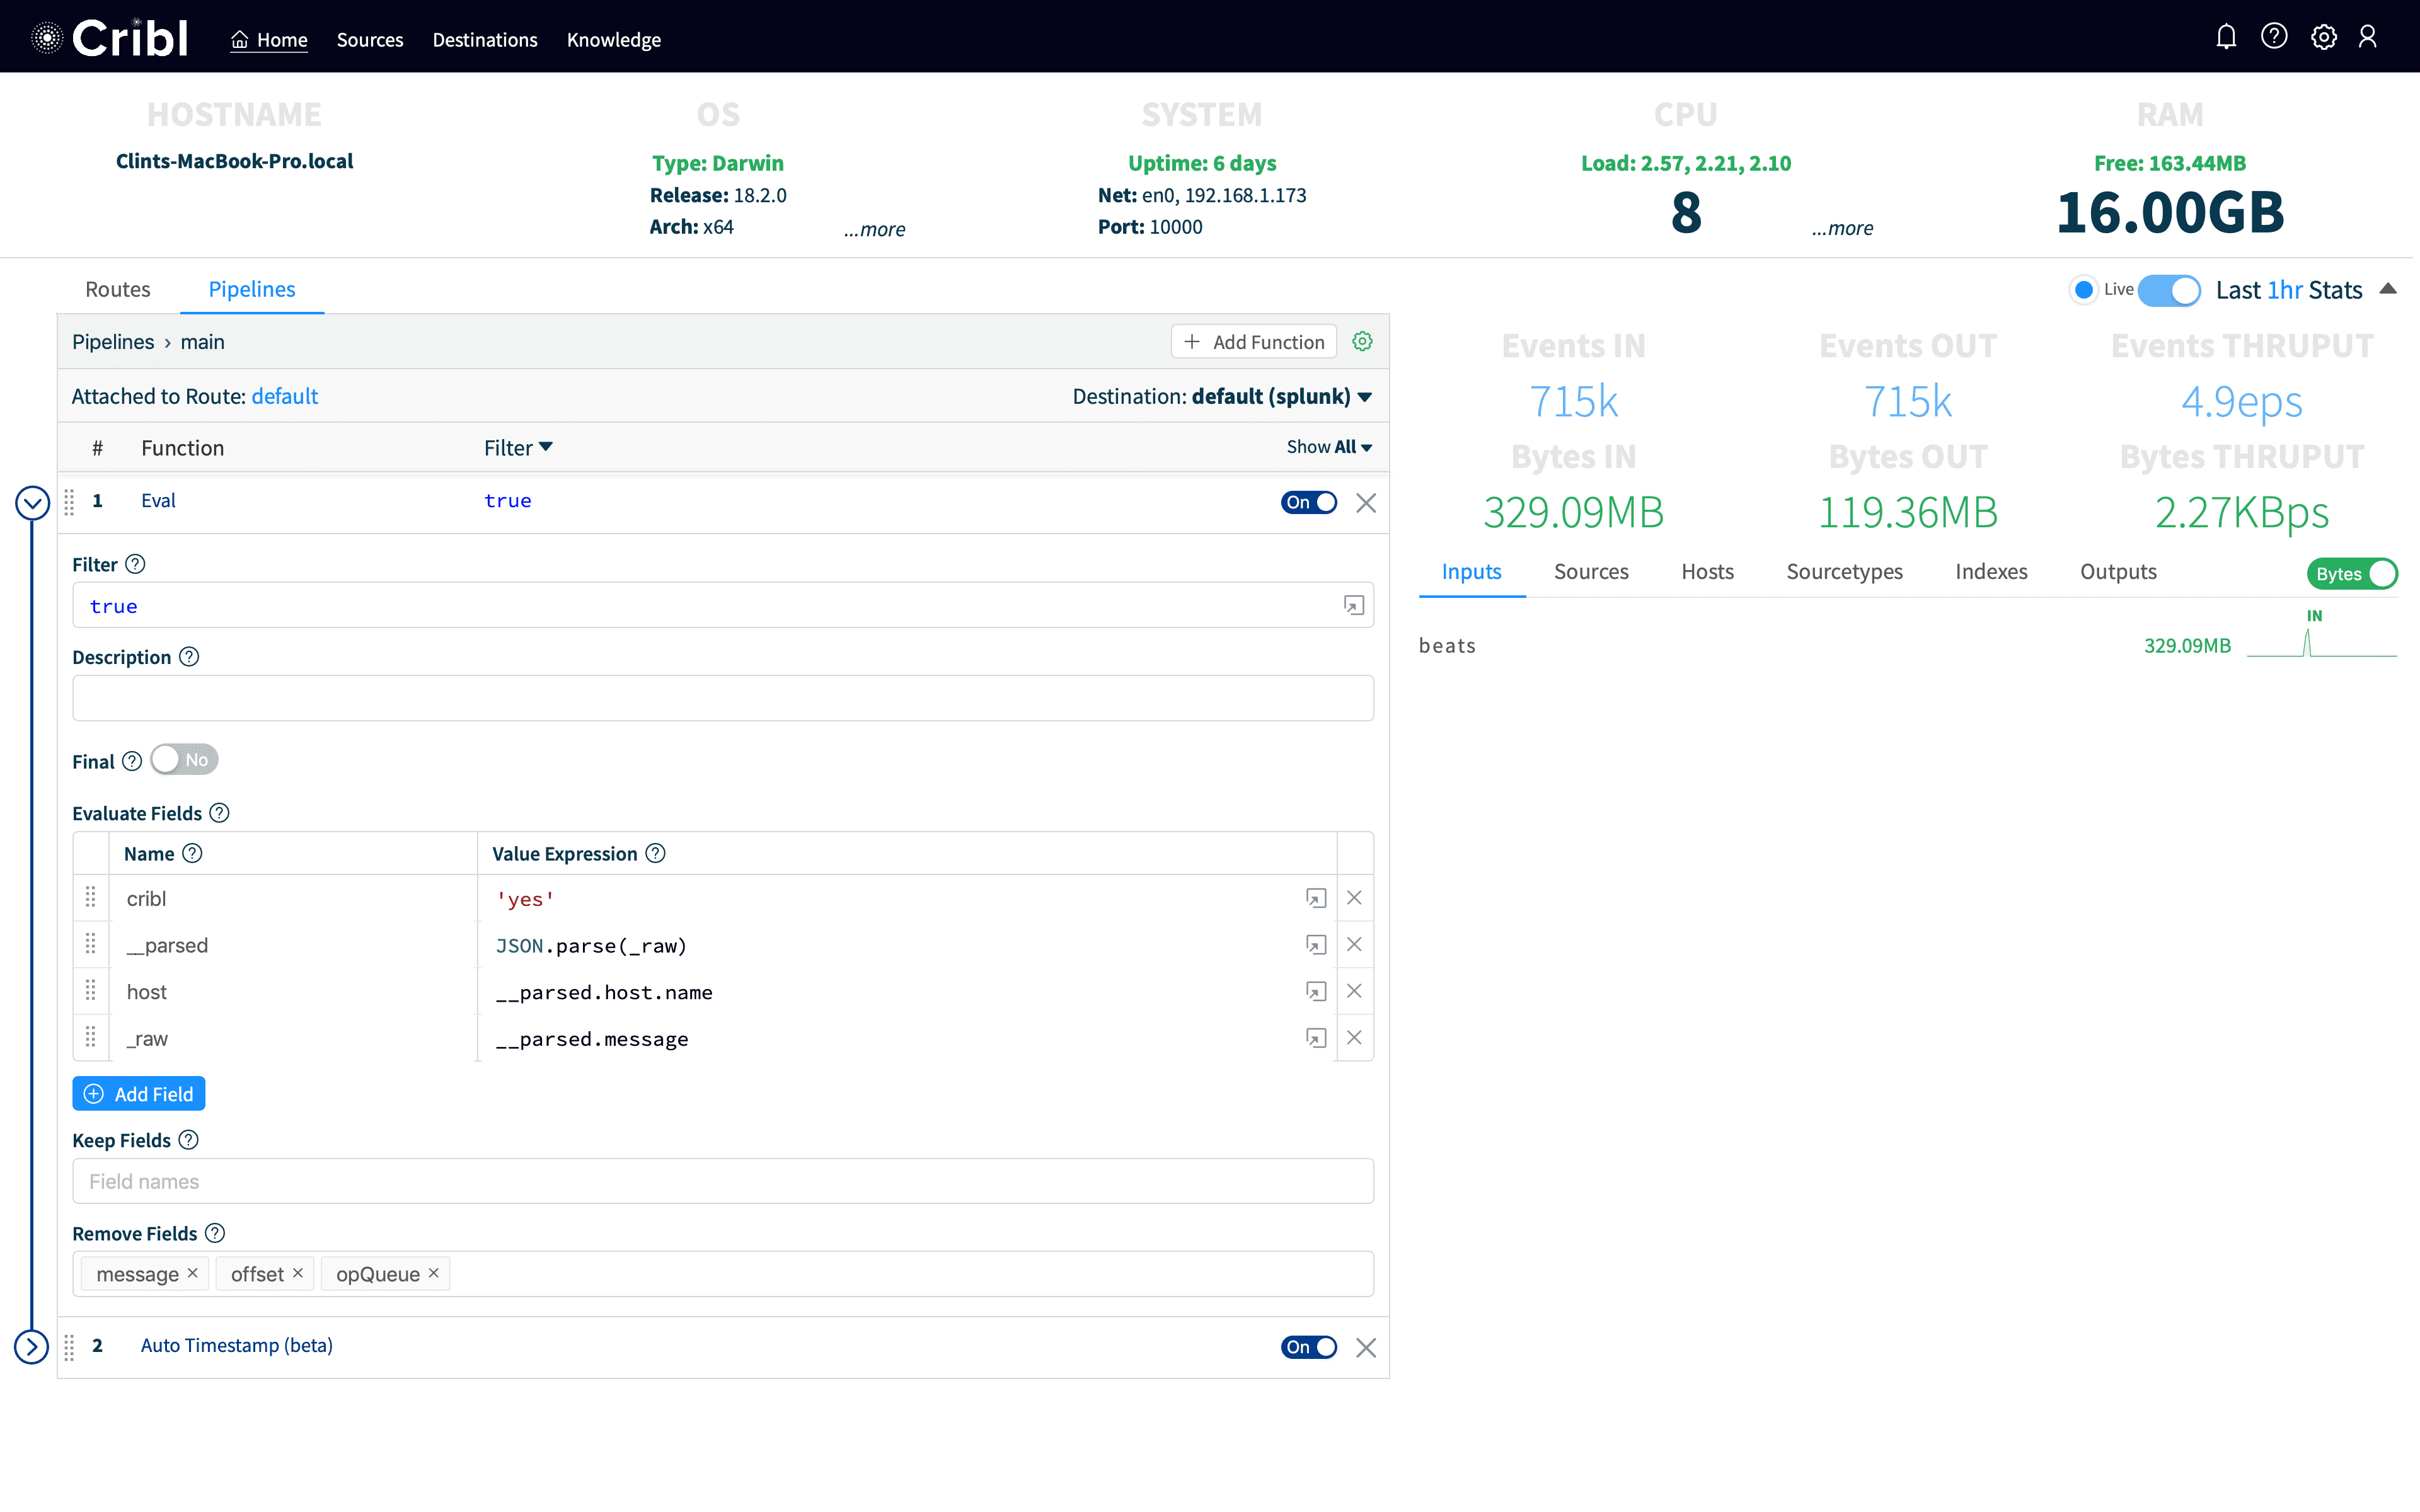
To accomplish this, we’re going to use a couple of Cribl’s functions, Eval and Auto-Timestamp. In Cribl, click on the main pipeline, which is by default where all events are going. In a more mature install, we’d create a pipeline just for this and install a route for just the data we want to hit it. But for this demo we’ll be a little less prescriptive. The main pipeline by default ships with an Eval function which simply adds a field to every event called cribl with a value of yes. This makes it easy to see that an event has been processed by Cribl.
For our use case, we want to make the event look like it had come into Splunk natively. First, we create a new row under Evaluate Fields and add a field named __parsed with a Value Expression of JSON.parse(_raw). Value Expression is a JavaScript Expression. It can take any valid JavaScript which does not create an additional scope (functions, loops, etc). So, any simple JavaScript should work. In this case, we’re using the built-in JSON parser to take the parsed JSON in _raw and store the parsed object in __parsed. In Cribl, fields with two _ are internal and are not output to the destination system. (Note: this isn’t necessary, we automatically parse events coming from Elastic, but it helps illustrate a key capability of parsing JSON and pattern of storing data in internal fields).
From above, we notice the hostname isn’t right, we want to lift the host.name field up to host. We add another new row to Evaluate Fields, with a name of host and a Value Expression of __parsed.host.name. We don’t need any of the other beats metadata, so we’re just going to set the value of _raw to __parsed.message which should make the raw line look like it looked on the originating system.
In addition, we also bring in more data from the Elastic event that we don’t necessarily want to bring into Splunk as index-time fields, so we add @timestamp, message, offset, and opQueue to RemoveFields.
Lastly, Filebeat doesn’t extract timestamps without configuring it for that type of data. In Cribl, we have an Auto-Timestamp function which will find common timestamp formats and parse time from them automatically. We add Auto-Timestamp with the default settings, and then Save. Your pipeline should look like:
Now, as we head back to Splunk, we can see the data is looking in much better shape. I ran a search over 24 hours:
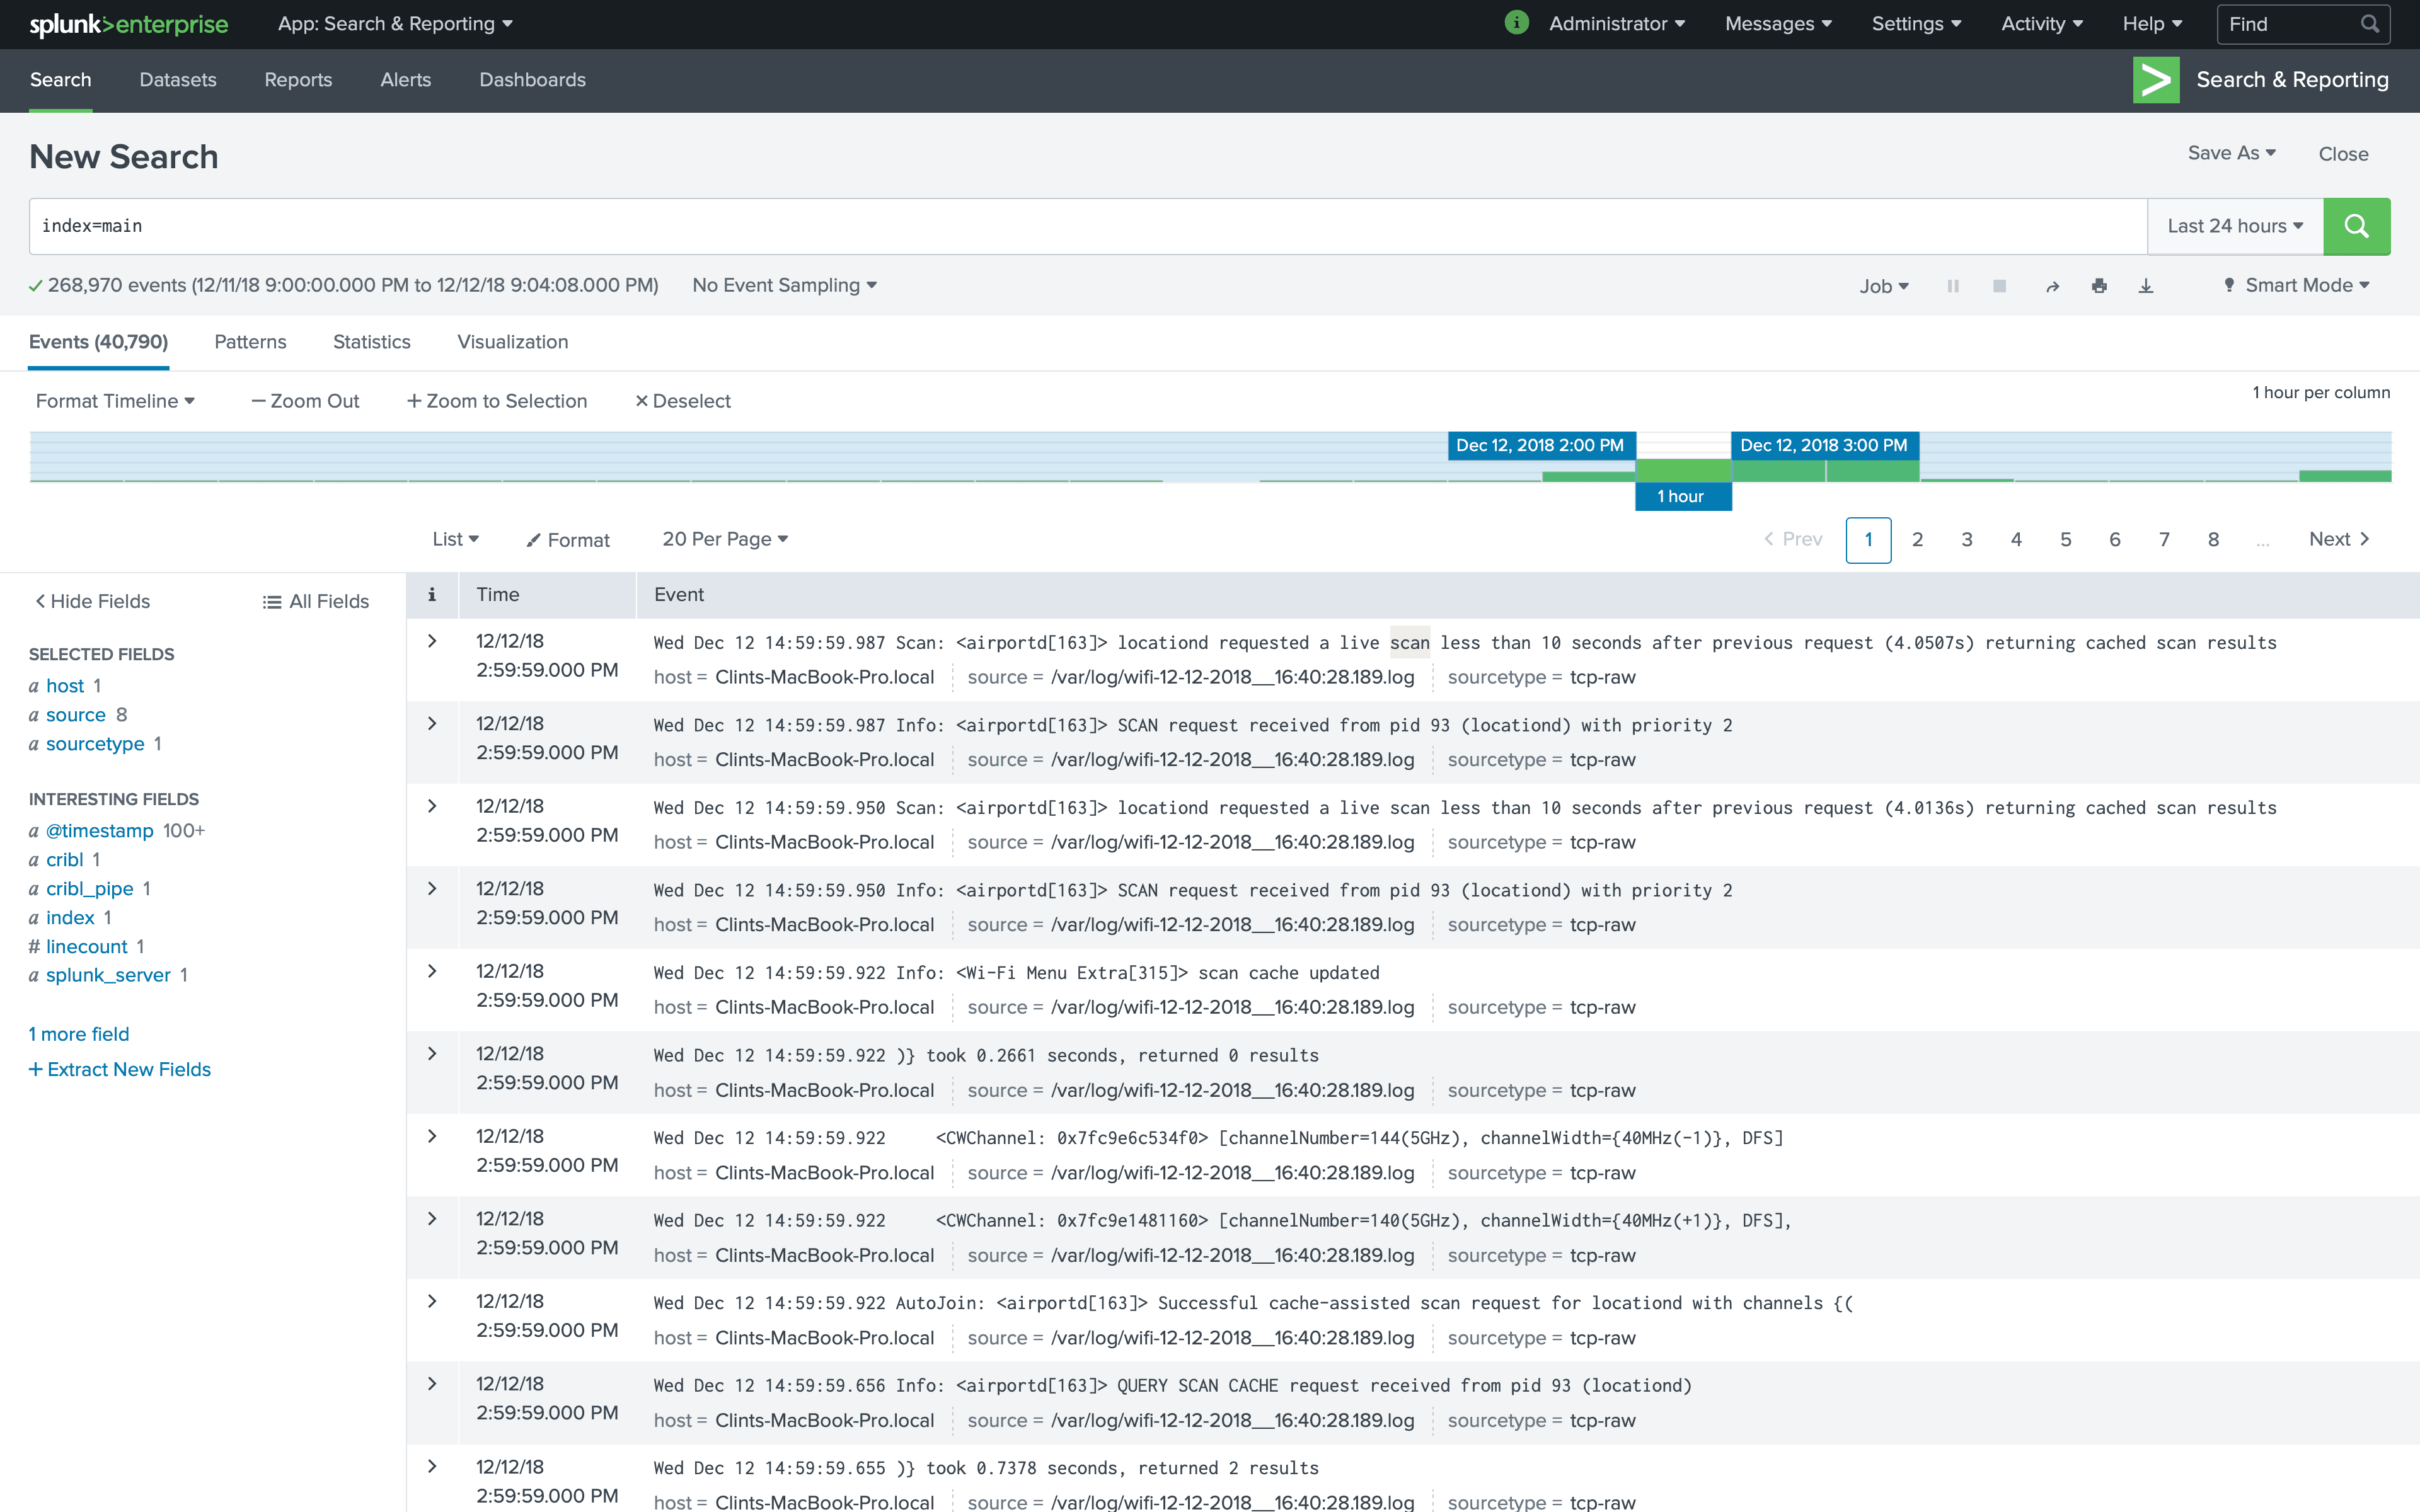
_raw is set right and Timestamps are extracted properly.
Conclusion
Cribl allows you to adapt any type of machine data from any source to any destination. Convert logs to metrics, enrich data as it’s moving, encrypt portions of raw payloads, in any system. Cribl makes your existing investment in log analytics much more valuable.
If you have questions, please join our Slack Community. You can email us at hello@cribl.io with any questions as well.