One of Cribl Stream’s selling points is the reduction of ingested log volume, which helps our customers control costs and improve system performance. This can be accomplished in two ways – either by eliminating duplicate or unnecessary fields and null values within the events, or controlling the number of specific events that actually get sent to the destinations through strategic filtering. In today’s blog post, I am going to show you how to do the latter via pipelines using four of Cribl Stream’s event-reducing functions.
Personally, I learn best when I have real world examples that I can reference while building out my own solutions; so to help show the power of reduction, we’ll use Apache web events to show how you can use Cribl Stream to reduce any unneeded or license consuming events using the following four functions.
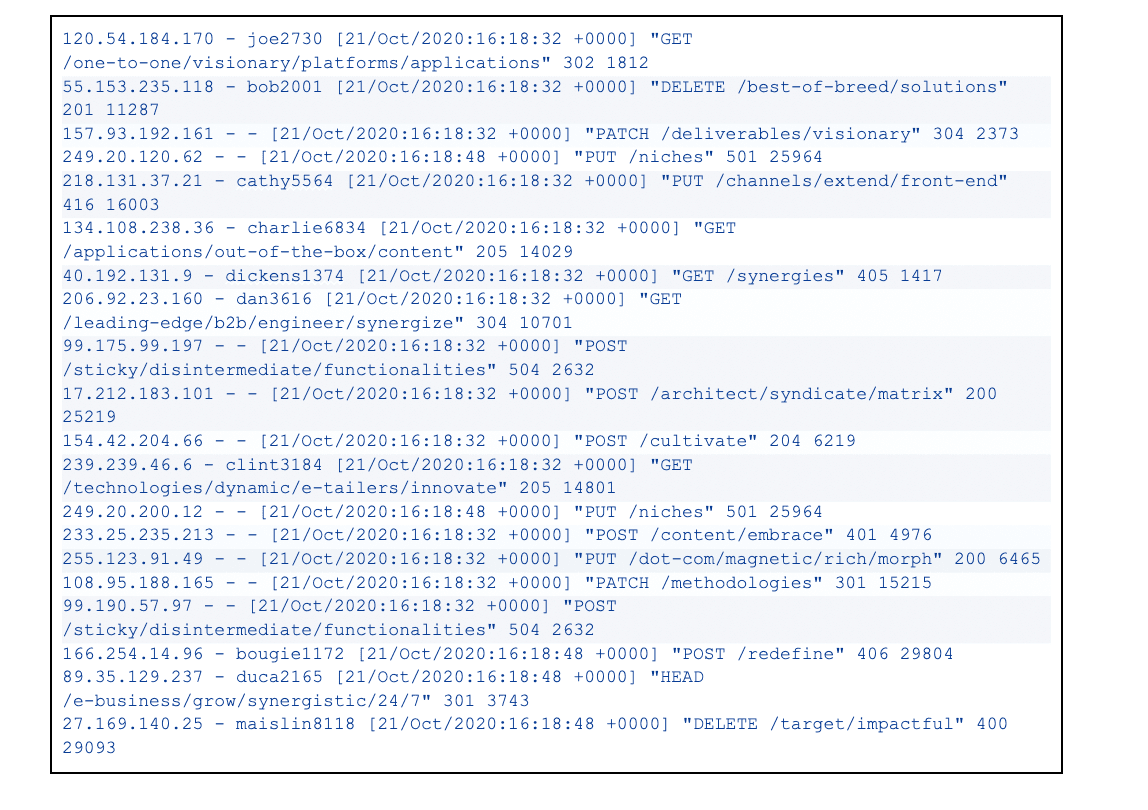
In this scenario, Apache events are consuming too much license and performing searches to build statistics is negatively impacting search performance. In the following pipeline, we will first use the Parser function to parse out the status field we need, and then we’ll use the following reduction functions based on the status code in each event:
Drop – Status 200 – 299
Suppress – Status 300 – 399
Sampling – Status 400 – 499
Aggregate – Status 500 – 599
Sample logs:

The Drop Function
The first function we are going to explore is the Drop function. This function allows you to discard 100% of the events that match a specific filter; in this case, we are using the expression Math.floor(status/100)==2 to match any event that has a 200-299 status code. Because 2xx status codes typically indicate success instead of error, we will drop these events as they are no concern to the server admin team.

The Suppress Function
The Suppress function allows you to suppress events over a time period while still letting through a defined number of copies. Since the 3xx status codes typically indicate client redirection, which isn’t a huge concern to the team, in the example below we are only going to allow one event with a 3xx status code to pass through every 30 seconds. This allows for reduction while also allowing a few events through for reporting or troubleshooting purposes.

The Sampling Function
Cribl Stream comes equipped with two Sampling functions; Sampling and Dynamic Sampling. The Sampling function allows you to configure a static sample rate, such as allowing 1 out of every 5 events to pass through while dropping the others and Dynamic Sampling allows for adjusting sampling rates based on incoming data volume per sample group. You may notice that this function is similar to the Suppress function we used previously; the difference being allowing x number of events based on total events coming through versus events over a time period.
Because 4xx status codes arise in cases where there is a problem with the user’s request, and not with the server, our server team wants us to bring in enough samples so that they can do any necessary troubleshooting without consuming too much storage.

The Aggregate Function
Lastly, we are going to use the Aggregate function not only to perform aggregate statistics on the 5xx status code event data in the form of metrics to Splunk but also to allow those events to pass through for inspection by our server team. Because this function is a little bit more involved / more powerful than the previous functions, I’ll break down below what we configured and why.

Filter: We are using the
Math.floor(status/100)==5expression so that the function is only applied to any 5xx status code event.Time window: We are leaving this setting at the default 10 seconds, which is the time span of the tumbling window for aggregating events.Aggregates: This allows you to use an express format to specify the aggregate function(s) to apply to the filter events; in this case, we are calculating a count of events by the status field.
Group by fields: This is the field(s) we want to group the aggregate by; since we specified the function to group by status field only, we will now get a count per each individual 5xx status code (501 = 2 events, 504 = 2 events). Just to give you a further example, we could also group by clientip, which will aggregate the count of each 5xx status code per client IP address.
Evaluate Fields: This allows us to set an index for the metrics we send out to Splunk.
Output Settings -> Passthrough mode: Determines whether to pass through the original events along with the aggregation events; when set to no, it will drop all of the original events and only pass through the metrics (shown in the screenshot below). In this example, we want both the events and the aggregate metrics to flow through, so we have this enabled.
Output Settings -> Metrics mode: Determines whether to output aggregates as metrics; when set to no, aggregates are output as events rather than metrics. In this example, we want metrics, so we’ve enabled this setting.
Metrics Output:

Summarizing the Return
Using the four functions above (plus the initial Parser function), we built a quick and dirty 5-function pipeline that helped us reduce our Apache sample log by 60% – without losing any relevant events that our server admin team truly cares about. Apache events are not the only logs that can benefit from this pipeline – this form of reduction can help any type of log events that you have flowing into your SIEM solutions. You can accomplish all of this worry-free, knowing that Cribl Stream has a solid replay option that allows you to keep a full-fidelity copy in a low-cost destination with the ability to replay the entire logs back as needed.
The fastest way to get started with Cribl Stream and Cribl Edge is to try the Free Cloud Sandboxes.


