
Since joining Cribl in January, I've been heads-down on Cribl Insights and FinOps Center reporting, and honestly, most of that time been spent to talking with customers. I've gotten to sit with teams across our community and hear how they actually think about operational visibility and keeping tabs on the data moving through their Cribl environments.
I've picked up a ton from those conversations, on everything from financial projections to granular monitoring in Cribl Edge (more on both in future posts). But one request keeps coming up, no matter the team or the use case. People want to keep their environment healthy without staring at a visualization, comparing graphs, or running a single Cribl Search query.
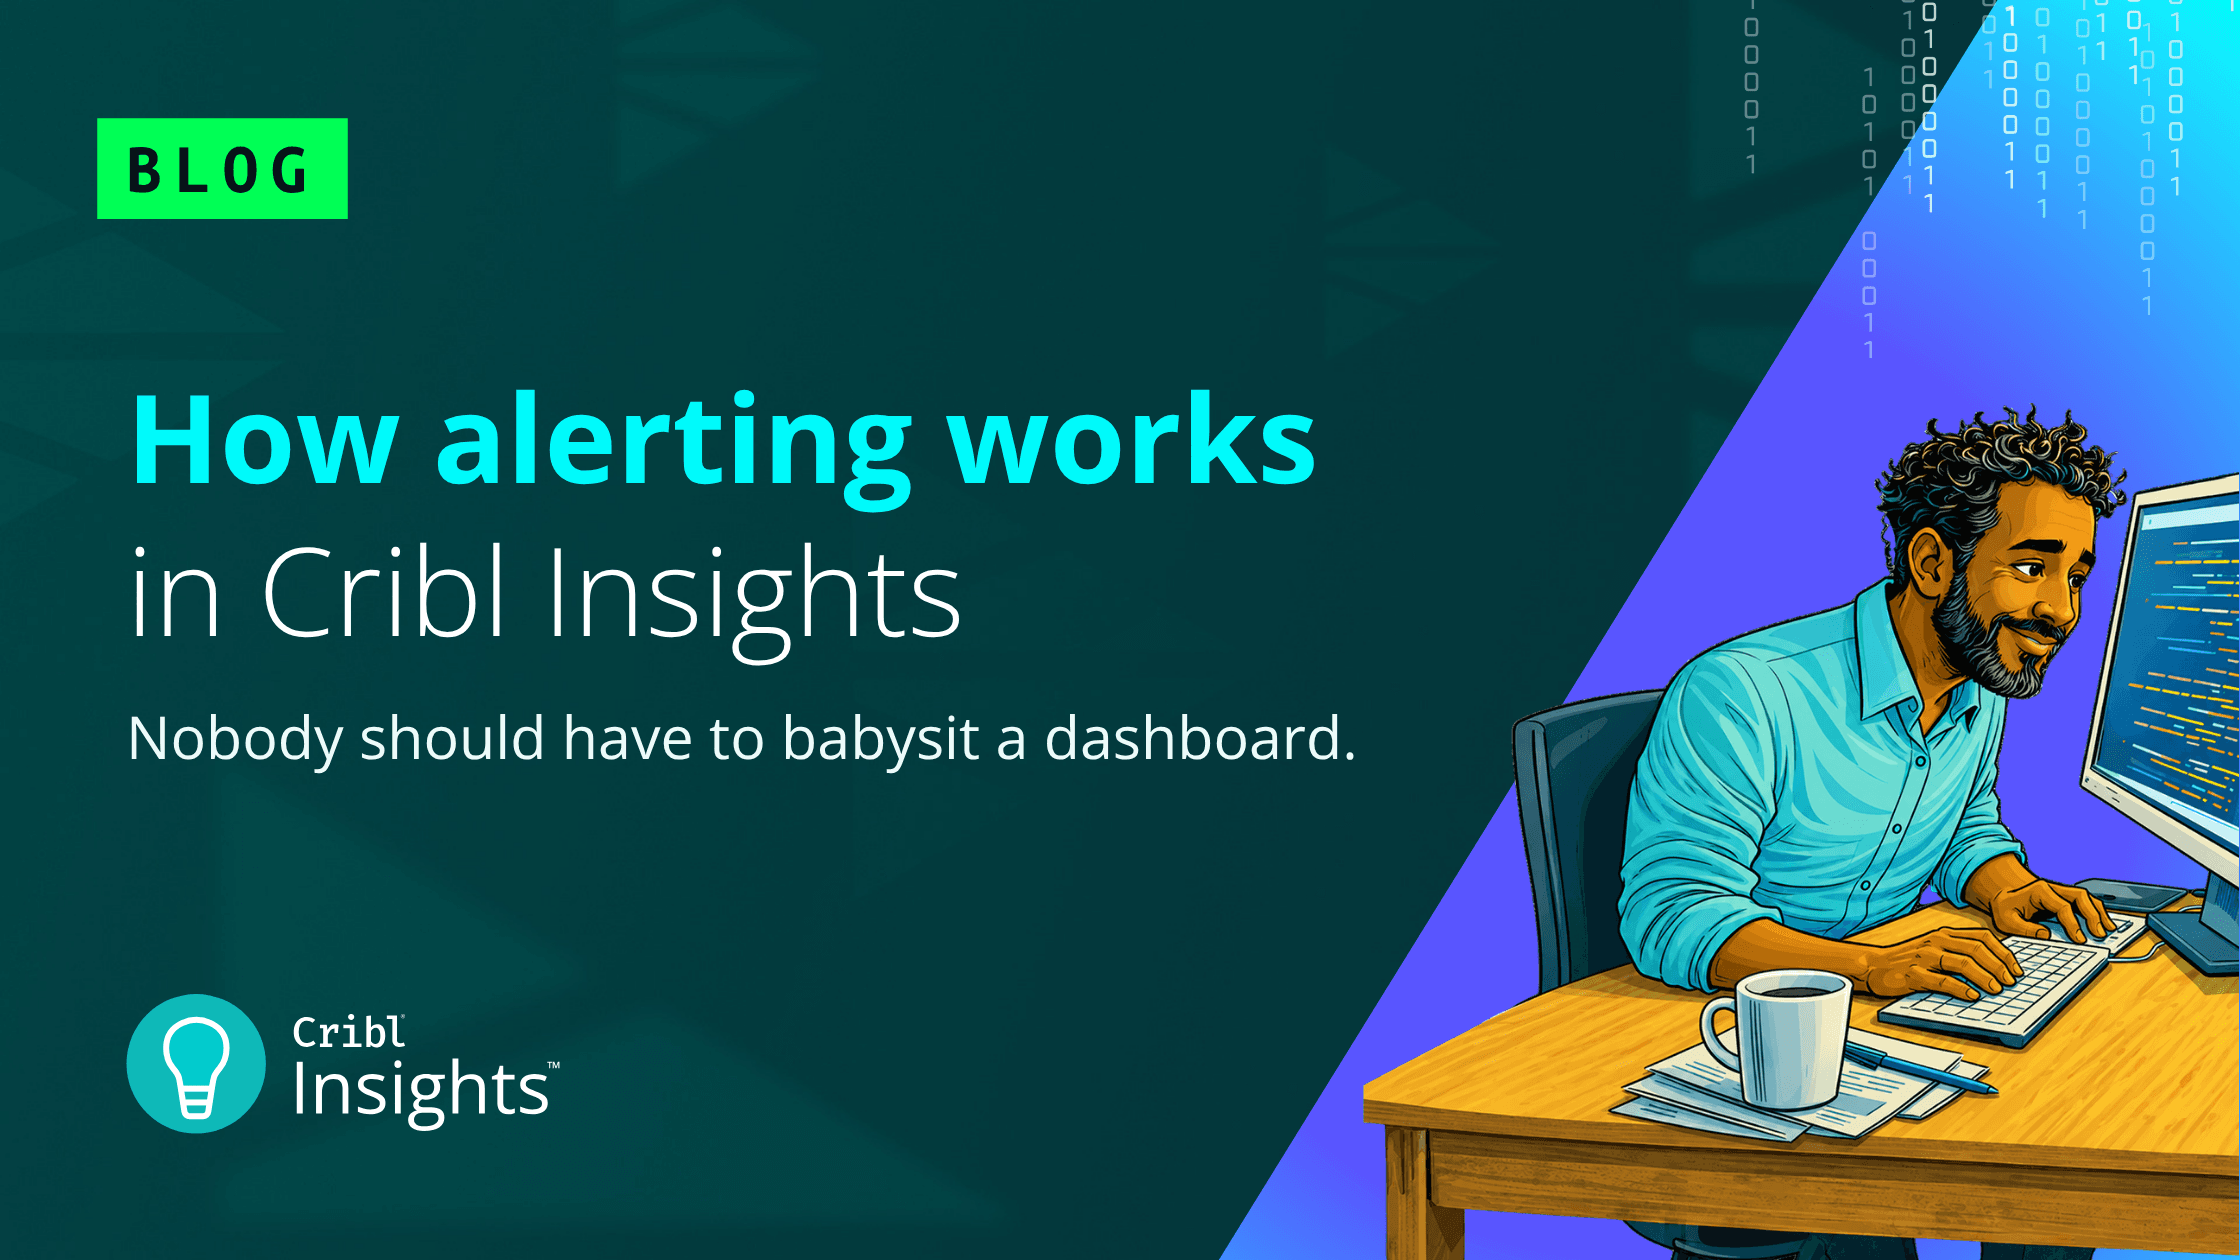
It's a fair ask. Nobody wants to babysit a dashboard, watching for the moment a line drifts the wrong way. What they actually want is the confidence that if something goes sideways, they'll hear about it.
That's exactly what Alerting in Cribl Insights does. You tell it what "normal" looks like, and it takes care of the watching and the telling for you.
Three pieces: Monitors, Alerts, and Notifications
Here's how they fit together.
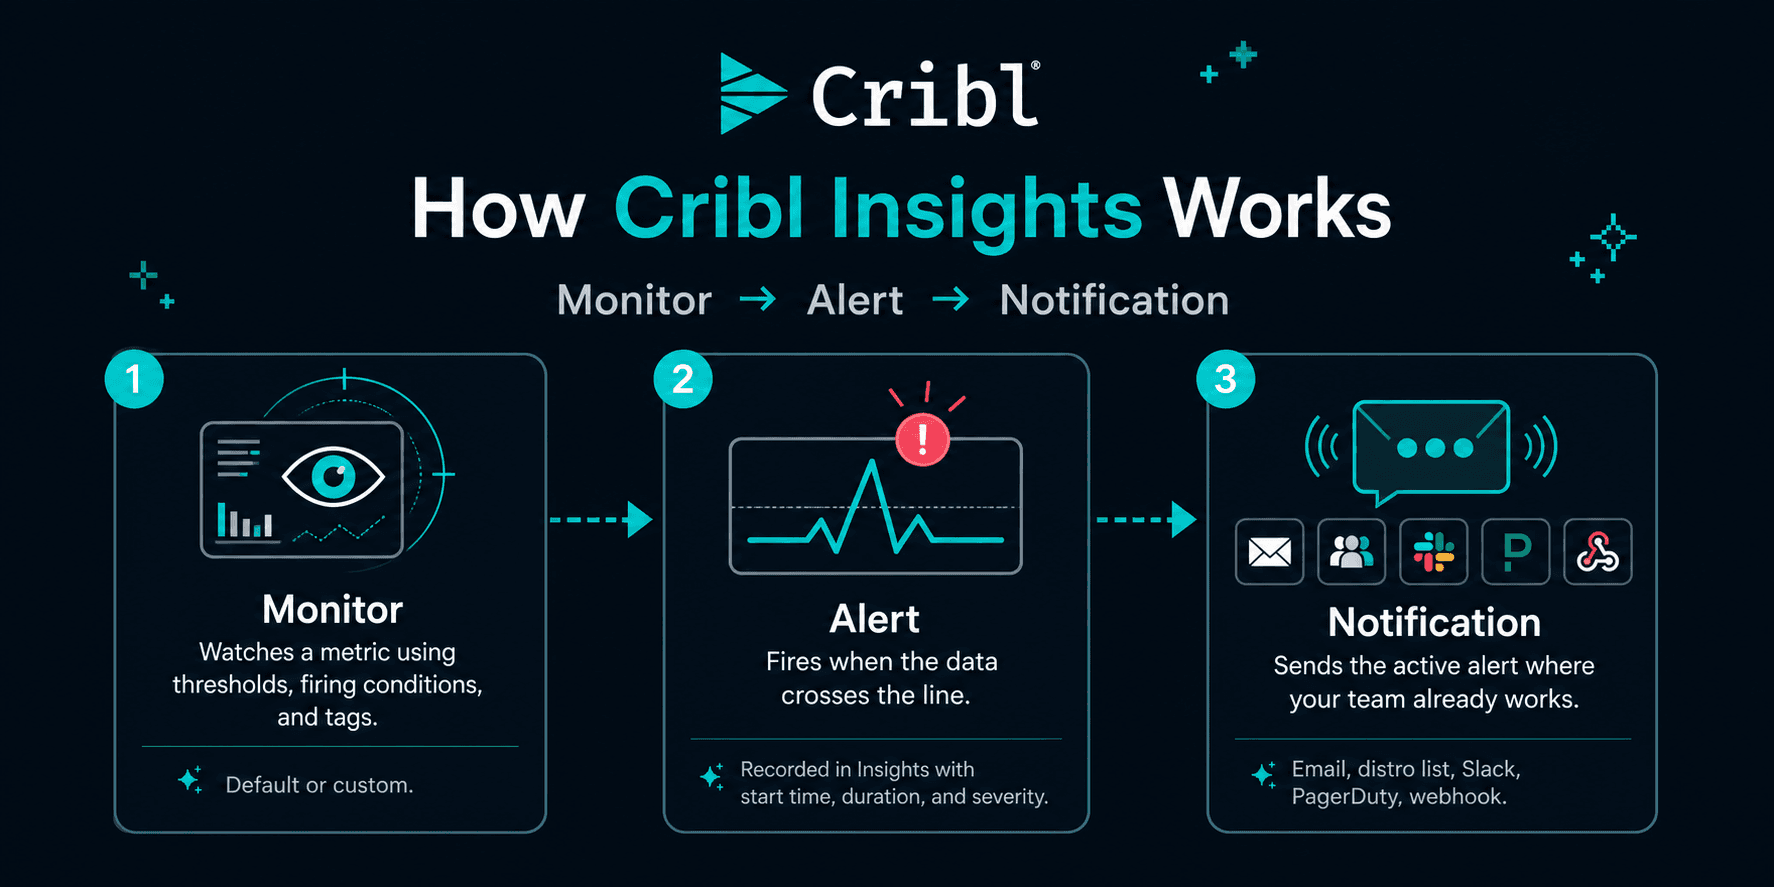
A Monitor is what keeps watch. It's the combination of a metric, your thresholds, the firing conditions, and the tags you choose to include or exclude. Think of it as someone standing watch over your data, trained to notice when something looks off. You can turn on one of the default Monitors with a couple of clicks, or build your own to track exactly what matters to you. The defaults cover what most teams want on day one, and building a custom one is as simple as choosing a metric and setting a range you're comfortable with.
When your data crosses the line a Monitor is watching, Insights fires an Alert. An Alert is just the recorded moment of "this isn't right." Every active and past Alert lives inside Insights, so you can go back and see when it started, how long it ran, and how bad it got.
An active Alert can also reach out. A Notification sends it wherever your team already works: email, a distribution list, Slack, PagerDuty, or a webhook, with the full context of what the Monitor saw. The people who need to act find out in the place they're already looking.
What this looks like in practice
Say one of your sources usually pushes a steady volume overnight. At 2 a.m., it quietly drops to a tenth of that. Data is still flowing, so most tools stay silent, but you've just lost the bulk of what should be coming in.
In Insights, a Monitor on that source's volume catches the dip the second it falls below your threshold. An Alert opens and tracks how long the gap lasts. A Notification lands in your on-call Slack channel with the details, so someone can dig in before the morning reports come up short and people start asking why. Because you set the thresholds, you also decide what's worth waking up for, which keeps that channel useful instead of turning it into noise everyone eventually mutes.
Nobody had to be awake at 2 a.m. for any of this. Instead of hearing about the gap at 8 a.m. from a frustrated stakeholder, you receive an alert at 2:01 a.m. and can remedy the situation by 7:45 a.m when you log on.
Visibility you don't have to babysit
This is the thing I keep coming back to in customer conversations. Good monitoring shouldn't depend on someone watching. You define what healthy looks like once, and Cribl Insights handles the noticing and the notifying from there.
No standing guard over graphs. No second-guessing a hunch with one more query. You get a heads-up when something actually needs you, and it leaves you alone the rest of the time.
Ready to try it out for yourself?
If you're already in Cribl.Cloud, it takes about a minute to try. Open Insights, turn on a Monitor, and point a Notification at your team's Slack or inbox. Then go do your real job and let Insights keep an eye on things.
Not already a Cribl.Cloud customer? Try it out for free!