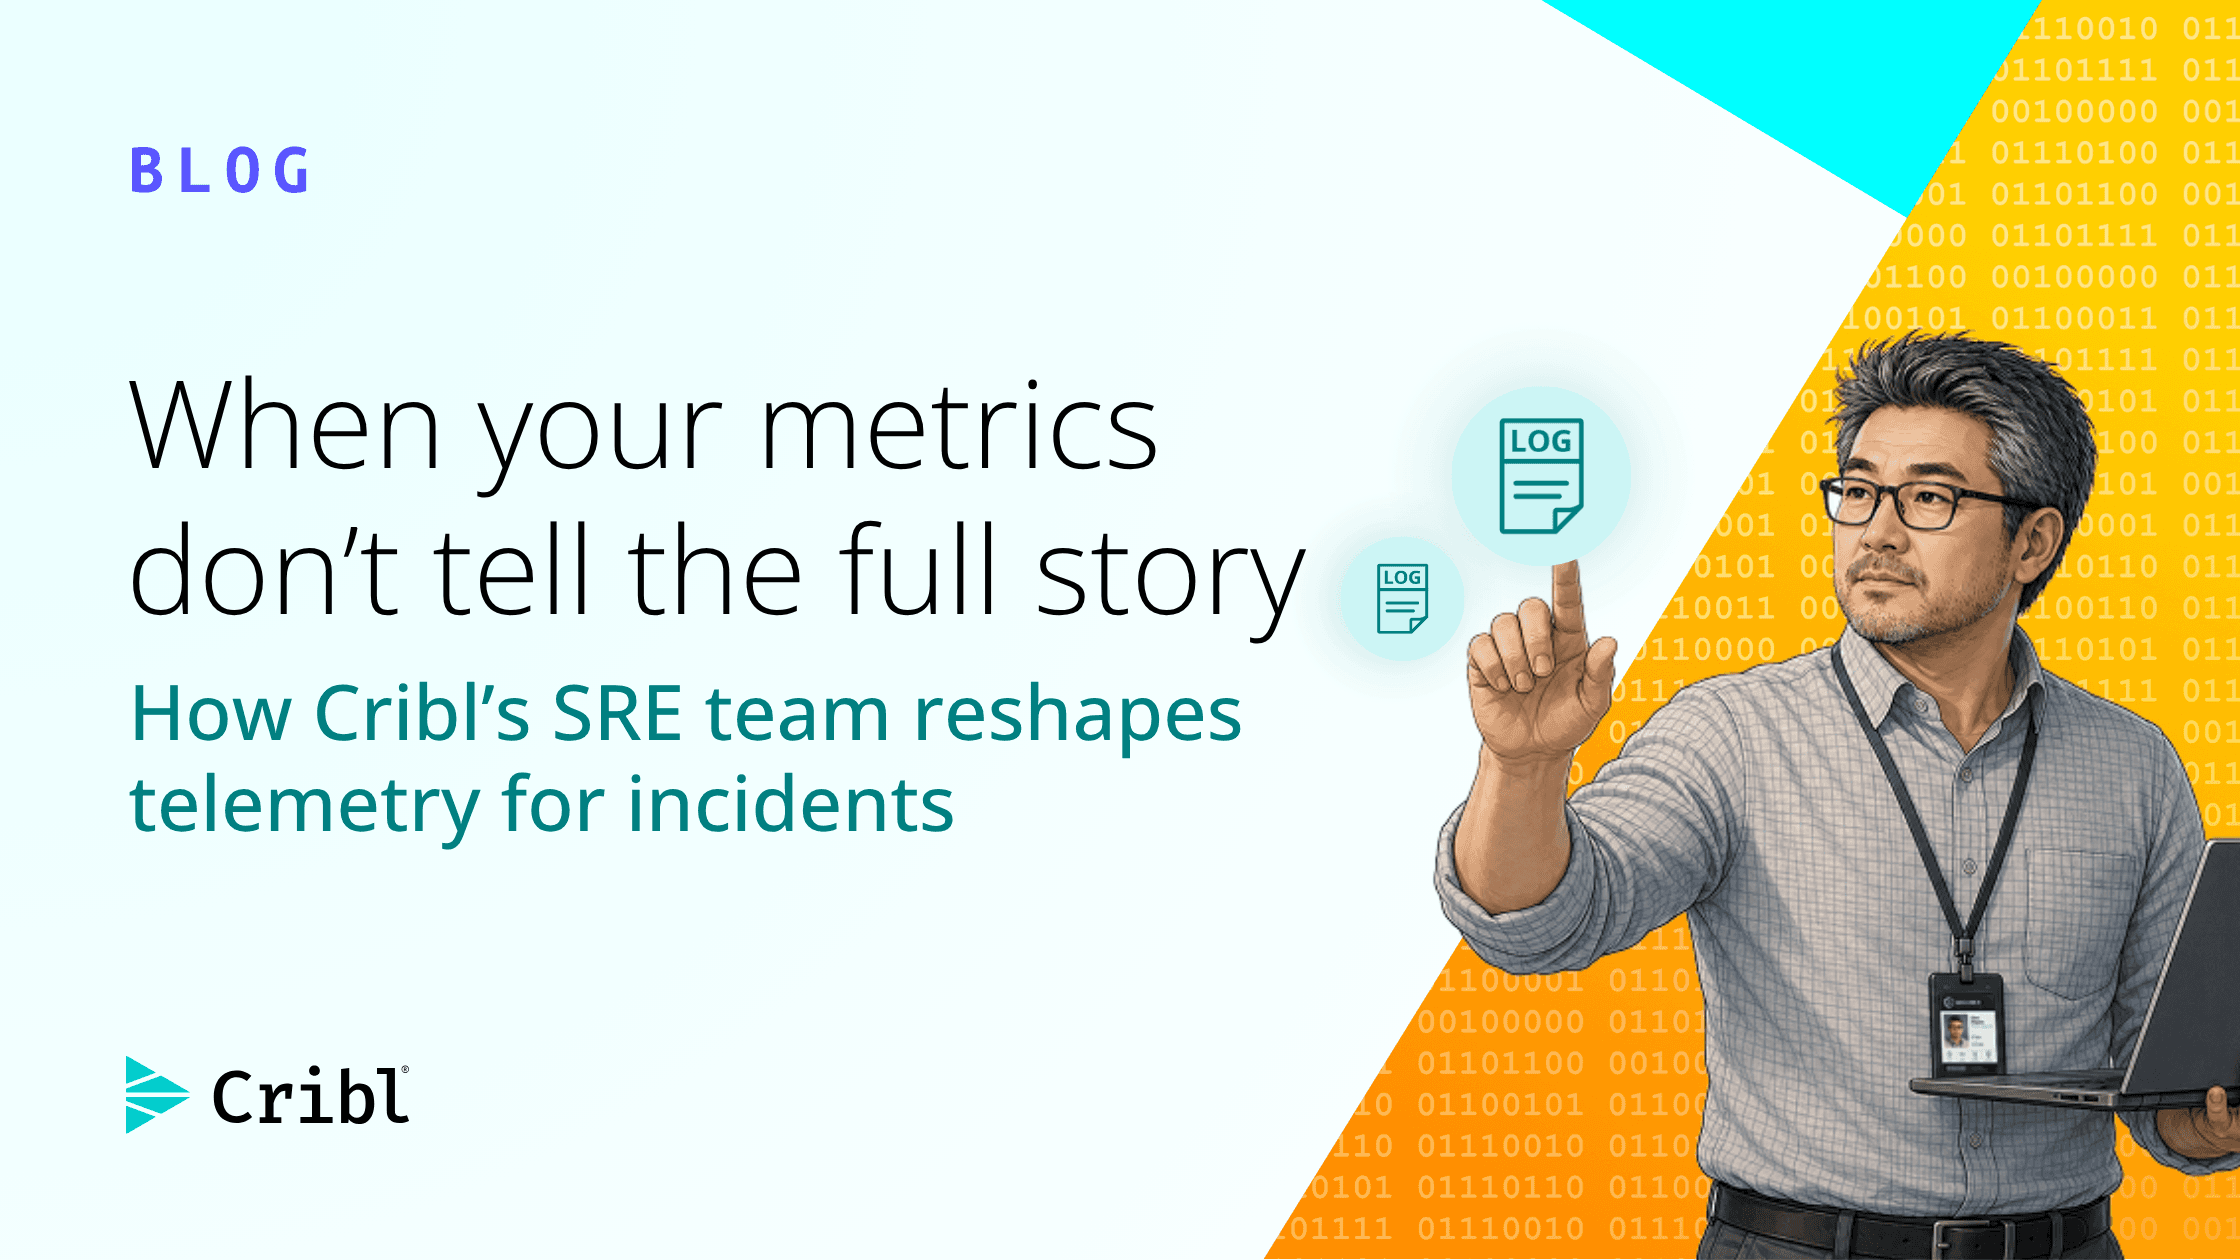

If your logs and metrics arrive without enough context, you pay for it during incidents. Queries get uglier, alerts get noisier, and your team burns time stitching together answers it should already have. At Cribl, our SRE team uses Cribl Stream and Cribl Edge to shape telemetry early, so it lands with the labels and metadata we need when things break.
Most of the time, when we collect logs and metrics, we ship them "as is" or with static enrichments, making it incredibly difficult for SREs to re-shape information once it has left the source. This lack of flexibility leads to overly complex query strings and slower incident response times.
Key Takeaways
Standardize data at the Edge or Stream to avoid complex downstream query logic.
Use centralized lookups (like Redis) to enrich data with real-time infrastructure state.
Implement control fields like ignoreAlerts to reduce noise during maintenance windows.
Use replayability so you can reshape historical telemetry when requirements change without pushing config changes to every collector.
The operational burden of unstructured data
Most of the time when we collect logs and metrics, we ship them as is, or with hard coded enrichments at the source. This makes re-shaping the metrics/logs extremely difficult, and without re-shaping of the logs/metrics, it complicates the queries strings. For example when you want to lookup a particular metrics from a node to its kubernetes node group, you’d have either update and redeploy the agent that collects those metrics or logs, or use a complex queries that have group of two sub-queries in order to lookup the node group. To stop debugging these joins during incidents, we moved the reshaping work upstream into our telemetry pipeline.
Architecture: How we leverage Cribl Stream and Cribl Edge
At Cribl, we feed all our logs/metrics to Cribl Stream. We also leverage Cribl Edge, which you can read about here: https://cribl.io/blog/how-the-cribl-sre-team-uses-cribl-edge-to-collect-metrics/)
Optimizing worker group logic
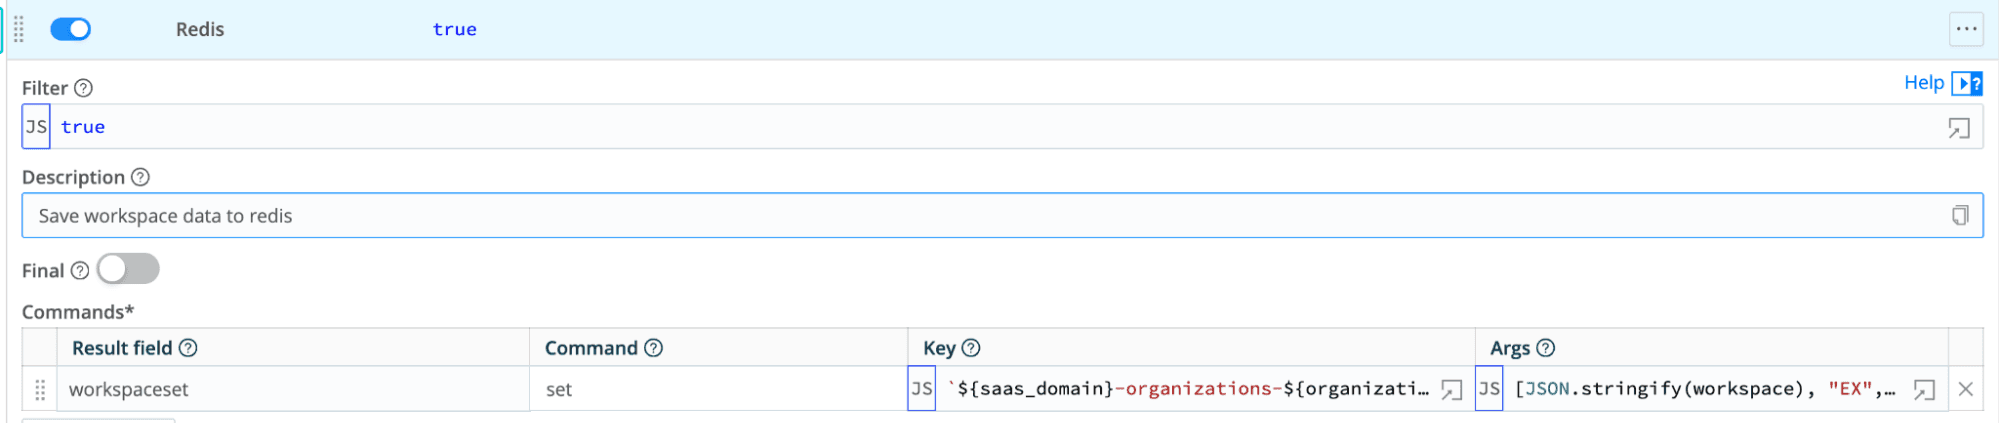
Lookup: this worker group is responsible for getting data from our API service via admin endpoints, as well as AWS resources via AWS endpoints. The data like the organizations & workspace details, infrastructure versions, product versions, etc. This information is then fed into Redis for all of our logs/metrics to enrich upon.
Cloudwatch: this worker group receives the metrics we collect from AWS CloudWatch as well as Azure (originally it only received from CloudWatch, hence the name).
Tenant: this is the largest worker group, handling metrics/logs coming from all our cloud organizations. Most of them are from Cribl Edge, which we installed in all of the instances in the organizations.
Default: this worker group handles the various logs/metrics that aren’t from organizations including API services, Kubernetes clusters, etc.
Others: there are several other worker groups, but for the sake of simplicity we’ll not list them in this article.
In practice, this layout lets us keep enrichment and collection logic in one place, so on‑call engineers see a consistent set of labels and metrics regardless of where the data originated.
Centralizing collection helped, but it didn’t fix the bigger issue: events still arrived without enough runtime context to be useful when we were on‑call. That’s what drove us to focus on dynamic enrichment rather than static labels at the source.
The solution: Dynamic enrichment and shaping
Because all the data are routed through Cribl Stream, we can easily control/update the shape before they land in the destination, and for existing data already at the destination, they can be replayed with new pipelines if needed.
When data arrives at our worker groups, it typically lacks critical context—such as whether a resource is part of a canary deployment, or its current infrastructure version. To solve this, we use a pipeline function that queries Redis to fetch real-time metadata and inject it directly into the event fields.
For our SREs, the win isn’t just cleaner metadata. It means they no longer have to reconstruct environment context in the middle of an incident, which cuts down on query gymnastics and makes the data immediately more actionable.
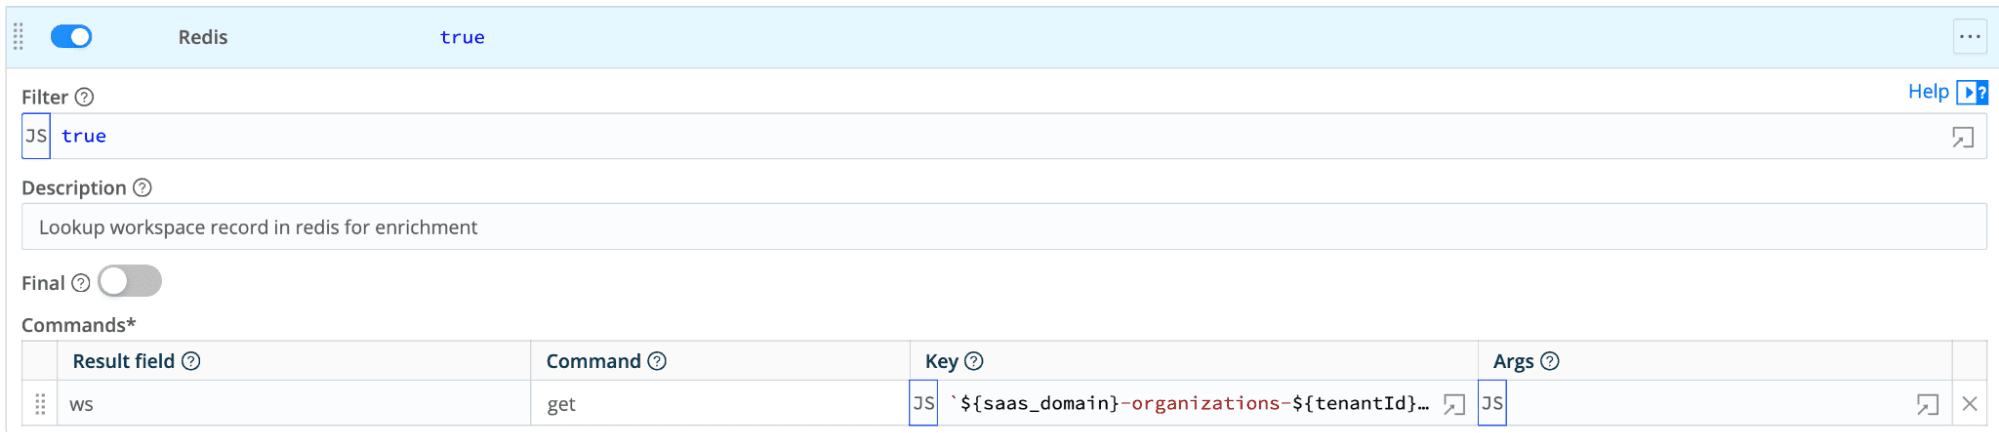
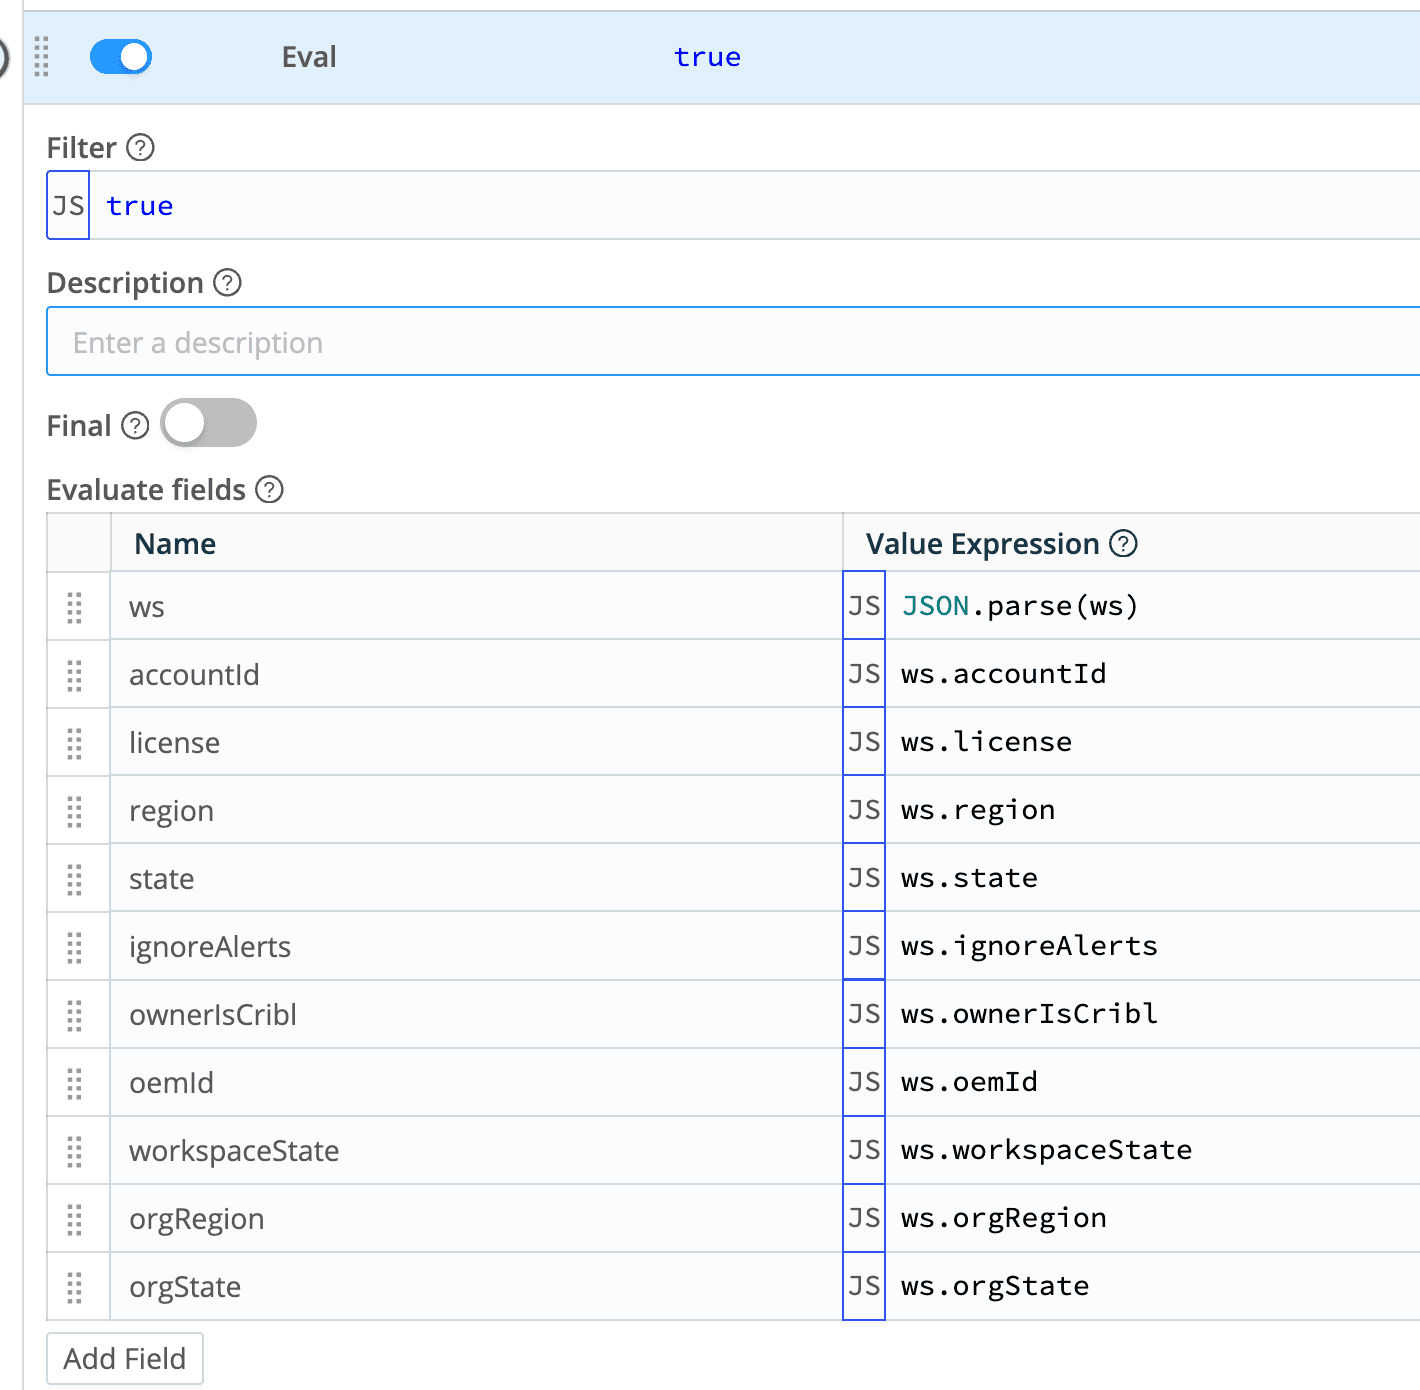
Imagine you have two metrics
organizations: the value is always 1 and with labels:organizationId: unique ID of an organizationstate: the state of the organization, for exampleready,assigned,cleaned
node_cpu_percent_active_all: the value ranging from 0 to 1 and with labelsorganizationId: unique ID of an organization, same as above metrichostname: hostname of the machine/node
Usually if you want to calculate the average of cpu for only assigned organizations (because that’s usually what we care about, for those real/active organizations. With the label of state in the node_cpu_percent_active_all metric, you have to write a query like:
avg(mem_utilization * on(organizationId) group_left() (organizations{state="assigned"}))
When the data lands our Stream, we added the state in the node_cpu_percent_active_all metrics when it arrives Cribl Stream, so our query can be simplified:
avg(mem_utilization{state="assigned"})
This will require a little extra storage because now metrics have those extra labels, but it significantly reduces computation (because instead of pulling two metrics, it only pulls one) and also makes the query much easier to understand.
Furthermore, by adding a field like ignoreAlerts, we can programmatically signal our alerting systems to suppress noise during known maintenance windows, improving our signal-to-noise ratio during critical incidents.
That’s the pattern that’s worked best for us - shape the data early so operators spend less time translating telemetry and more time resolving incidents.
Conclusion and Next Steps
Shaping data at the point of ingestion gives you cleaner logs, sure, but it also helps teams build a more reliable and searchable observability stack for on‑call engineers. By standardizing with Cribl Stream and leveraging dynamic lookups, our SRE team has reduced query complexity and alert fatigue. If you're currently struggling with messy telemetry data, start by identifying one high-volume log source and implementing a basic standardization pipeline in Cribl Stream.