
Every team in your organization needs something different from your AI telemetry. Most of them are working with a partial view. Here's what complete observability looks like for each one.
Your AI infrastructure generates the same events simultaneously for five different audiences.
When a language model processes a request, your SRE team needs to know about latency and time-to-first-token. Your FinOps team needs to know which workload consumed which tokens at what cost. Your security team needs to know what was in that prompt and whether it went somewhere it shouldn't. Your ML engineers need the full trace — prompt, retrieval documents, completion, tool calls — to understand whether the model did what it was supposed to. Your compliance team needs that same trace in a queryable archive two years from now.
One event. Five consumers. Five completely different definitions of what "visibility" means.
The standard response to this problem has been to route each team's data to the tool they already own. Security gets SIEM. ML engineering gets the eval platform. SRE gets APM. FinOps gets the cost dashboard. Each tool sees the slice of telemetry routed to it — and nothing else.
The result is five partial views of the same AI stack, none of which can see what the others are looking at. No one has the complete picture. And the questions that actually matter — why did that agent run cost three times what it should have? did the model start hallucinating after last week's update? which employee has been sending customer records to a personal AI account? — require connecting data that lives in different tools, at different retention horizons, in incompatible formats.
Complete AI observability means every team can investigate the full picture from one place. Here's what that looks like for each of the five.
SRE and Platform Engineering: beyond green dashboards
The SRE team's problem with AI systems isn't that the dashboards are wrong. It's that the dashboards are measuring the wrong things.
HTTP 200 at 85ms is a healthy response by every standard SRE metric. It tells you the system returned something. It tells you nothing about whether what it returned was correct, whether the retrieval step found the right documents, or whether the model degraded after last week's update. Latency problems in LLM applications are often retrieval failures, not model failures — and without the full trace, SRE can't tell which.
GPU infrastructure compounds this. A cluster at 40% utilization isn't obviously a problem. But 40% average utilization across a 1,000-GPU cluster could mean 200 GPUs running at capacity while 800 sit idle — or it could mean all 1,000 running at moderate load efficiently. Thermal readings and utilization percentages don't tell you which workloads are consuming which capacity, or whether that consumption is producing useful output.
SRE needs near-real-time alerting on thermal and utilization anomalies, latency and TTFT signals, and the ability to correlate infrastructure state with model behavior when something degrades. An APM tool gives you the infrastructure signals. A GPU monitoring dashboard gives you hardware metrics. Neither connects them to the model trace that explains what was actually happening at the time.
Cribl Search gives SRE one surface to correlate infrastructure telemetry, GPU state, and LLM trace data — investigating what the system was actually doing when the alert fired, not just that something was running.
Security: the footprint you can't see is the one that gets you
Security's AI observability problem has two layers, and most teams are only addressed by the first one.
The instrumented layer is visible. OTel spans from your LLM applications capture prompts and completions. Model access logs record API calls. Instrumented apps generate signals that flow into the SIEM — flagged events, PII matches, anomalous access patterns. This is the AI security posture most enterprises believe they have.
The uninstrumented layer is invisible. 47% of enterprise GenAI users access tools through personal accounts that never touch enterprise controls (Netskope, 2026). 59% of enterprises confirm or suspect shadow AI usage (Purple Book Community, 2026). Employees paste credentials, PHI, and customer records into consumer AI tools every day — and none of that appears in OTel spans, because none of it goes through your instrumented application layer.
Shadow AI is a telemetry gap, not a policy gap. You can't detect it with a SIEM rule, because the SIEM only sees what's been routed to it. The complete AI security picture requires correlating instrumented application telemetry with network egress data — what CASB, DLP, NGFW, and proxy logs capture — to surface the delta between "approved AI usage" and "all AI usage."
Cribl Search gives security the complete AI footprint — instrumented and shadow — in one investigation surface. Federated queries across the SIEM, network egress sources, and LLM telemetry without moving data between tools. The complete picture, not the instrumented subset.
FinOps: finding out about AI spend from the cloud bill
FinOps teams typically discover AI cost problems after the fact, from a monthly cloud invoice that tells them what was spent but not why.
Token costs are opaque without per-request attribution. GPU utilization percentages don't map to workload or team without enrichment at ingest. The result is that engineering and finance have the same conversation every month: costs are up, no one knows which workload, product feature, team, or model version drove it, and by the time anyone asks the question the data that would answer it has either rolled off retention or never had the right tags attached.
The fix isn't a better FinOps dashboard. It's enrichment that happens before data reaches any destination — GPU metrics tagged to team, feature, and model version at ingest, so the attribution is already there when anyone asks. Token consumption aggregated per request at the source, not reconstructed from billing logs after the fact.
Cribl Search gives FinOps the ability to investigate GPU and token cost by team, model, and feature — querying the full historical record to find where waste is compounding, which workloads are running inefficiently, and what the actual ROI of each AI initiative has been. Not a monthly report. A live investigation surface.
ML engineering: the traces your eval platform never sees
ML engineers and AI application developers live in eval platforms — LangSmith, Arize, Langfuse, Braintrust. These tools are good at what they do. What they do is show you sampled traces from instrumented applications, evaluated against the metrics you configured when you set them up.
What they don't show you is the full historical record. Production hallucination rates run 3–27% depending on task and model (Stanford HAI). Most quality regressions aren't caught in real time — they're noticed weeks later when a downstream system starts producing bad outputs, or when a customer complains, or when someone runs an ad hoc analysis and notices something has changed. By that point, the eval platform has a sampled subset of recent traces. The full trace history from the period in question is gone.
The questions that matter for AI quality are forensic: which prompts correlated with hallucinations after the model swap? did retrieval accuracy drop after the RAG pipeline change? which agent runs failed at the tooling layer versus the model layer? These questions require the complete trace — prompt, completion, retrieval documents, tool calls, hardware state — retained and queryable on the timeline the question actually arrives, not the timeline the eval platform expected.
Cribl Search gives ML engineering one place to investigate the complete historical LLM record — every trace, every retrieval document, every tool call — without rehydration, without data engineering overhead, across the full retention window. The eval platform sees sampled recent data. Search gives you everything.
Compliance and Legal: observable by design, not by accident
Compliance and legal teams are being pulled into AI governance faster than most organizations have frameworks to support it.
The immediate concerns are specific: which prompts carried PII or PHI? which model outputs touched regulated content? was sensitive data routed to a vendor-hosted backend? can we demonstrate that our AI systems handled customer data according to policy — and prove it to an auditor, retroactively, on a timeline we didn't predict when the data was generated?
OTel's binary capture flag offers no help here. Capture everything and you've created a compliance liability every time a user pastes PHI into a prompt. Capture nothing and you have no forensic signal when you need it. The only workable approach is in-flight redaction: mask the sensitive substring, preserve the structural signal, before data crosses any trust boundary. That's a policy decision that has to be enforced in the infrastructure, before telemetry reaches any destination.
Retention is the second problem. Compliance questions arrive on legal timelines, not data engineering timelines. A multi-year queryable archive of AI telemetry — at a cost model that doesn't make long-term retention structurally untenable — is the difference between being able to answer an audit and not.
Cribl Search gives compliance teams the ability to query the complete AI telemetry record at archive cost, on demand, with PII already redacted in-flight at the infrastructure layer before any data reached a vendor backend. Defensible data handling, demonstrable on any timeline.
One stack, one surface
The five teams described above are all looking at the same AI infrastructure. They have different questions, different retention requirements, different cost tolerances, and different tools they've built workflows around.
Complete AI observability doesn't require those teams to abandon their tools. It requires a place where the data from all of those tools — and the data that never reached any of them — can be investigated together. Where SRE can correlate the GPU state with the model trace. Where security can connect the SIEM alert to the shadow AI egress data. Where ML engineering can pull the full historical record the eval platform never stored. Where FinOps can attribute costs to the workload that actually drove them.
That's what Cribl Search is: the unified investigation surface where every team's partial view becomes a complete one. The infrastructure layer — Cribl Stream, Edge, and Lake — governs how telemetry is collected, governed, and routed, giving enterprises the choice and control to send data wherever they need it. Search is where it all comes together.
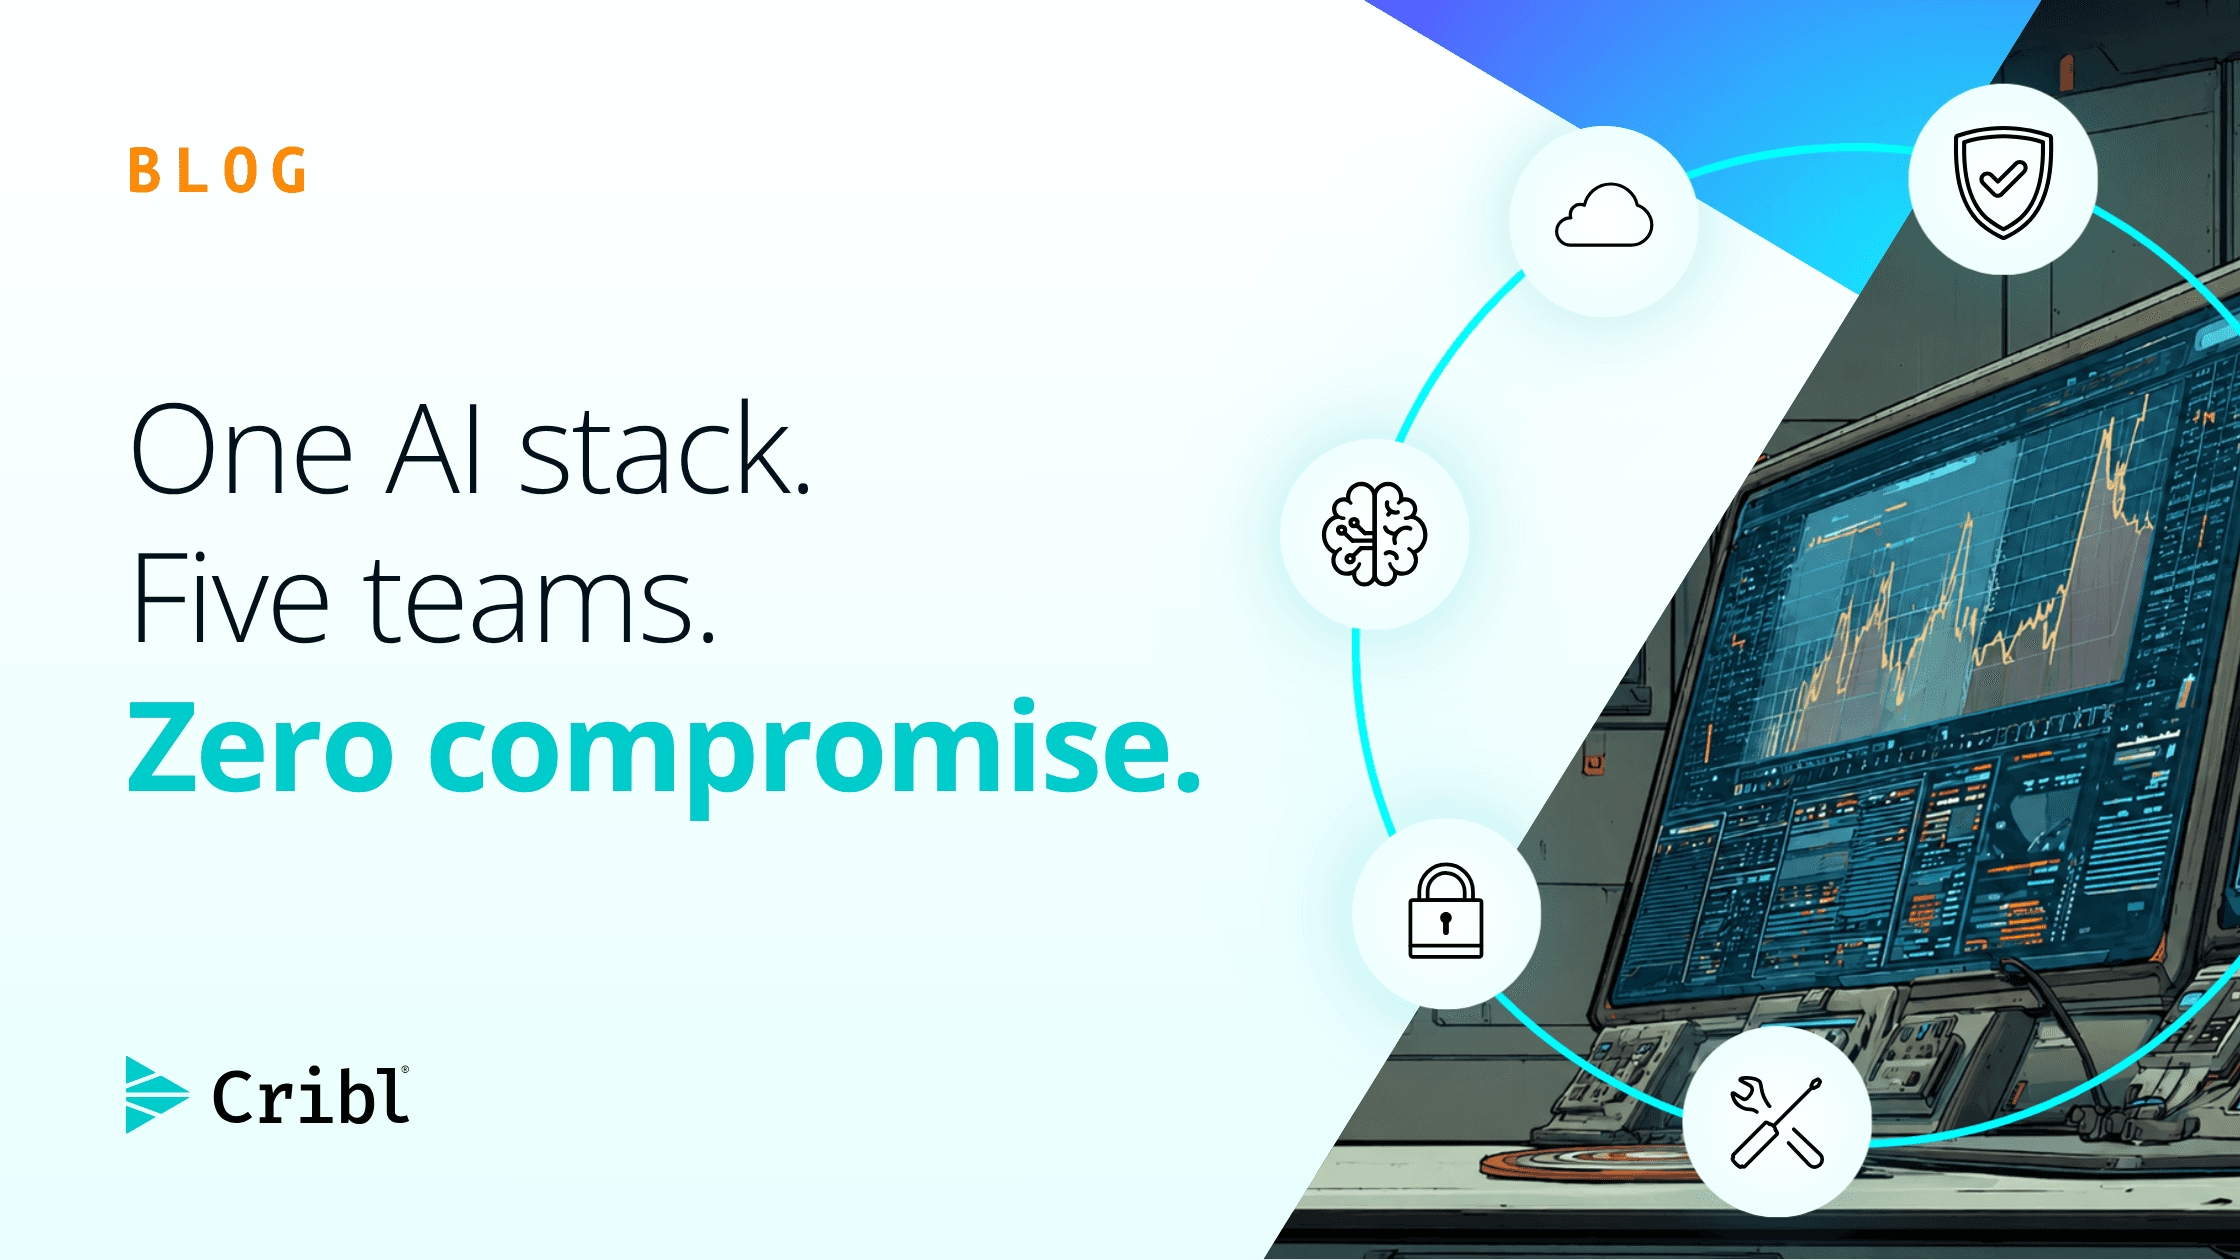
One AI stack. Five teams. Finally, zero compromise.
Want to see what your complete AI observability picture looks like? Talk to us.