
An ex-colleague at Splunk asked me in a LinkedIn post if Cribl Stream does anything else besides log reduction. This blog is for him. Stream optimizes data so that it’s consumable again. In this blog, I’ll focus on using Stream to improve Splunk performance for search while lowering CPU usage.
If you’re in the David Veuve camp, you know the value of using the tstats command to achieve performant searches in Splunk. And if you’re in the Clint Sharp camp, you know the value of time-series databases, such as a Splunk metrics index. In my small lab, in a set of Docker containers, Stream was shown to improve the performance of Splunk searches by up to 103x by populating index-time fields and searching via tstats; and for a different data set where a metrics index was populated instead of a traditional event index, performance improved by 13x and also simplified by leveraging the ‘analytics workspace.’ The performance improvements will be even larger in a production environment where billions or trillions of events are searched.
Splunk is a great tool that makes it easy to convert raw, unstructured machine data to meaningful outcomes. Curious what data you have? Just run a search like Google for your logs. Need to report on gigabytes or terabytes of unstructured data and populate statistical graphs or timecharts? Well, that’s where Splunk performance can suffer. That’s because Splunk was first designed for search-time analytics. The schema is built when you run your search.
This is where adopting a different strategy, like populating index-time fields or a time-series metrics database, produces much faster results. And since we all love Splunk, let’s love it even more with Stream! So let’s dive in on how to improve Splunk performance and lower CPU usage.
How To Improve Splunk Performance
Stream is a data pipeline solution that can help you transform your unstructured data to be more structured before it persists to disk. This doesn’t only improve sending to Splunk, but also sending to other observability solutions like Datadog, Wavefront, the Elastic Stack, or Sumo Logic, as well as writing to an S3-compliant API, GCP Cloud Storage, or Azure Blob Storage.
In this blog post, we will focus on Splunk as the destination. Regardless of the destination, transforming the data first helps reduce infrastructure costs, helps reduce storage costs, and enables you to do more with your software license.
How can Stream improve your Splunk search performance? Methods include:
Populating data into index-time fields and searching with the
tstatscommand.Converting logs into metrics and populating metrics indexes.
Aggregating data from multiple events into one record. This is beneficial for sources like web access and load balancer logs, which generate enormous amounts of “status=200” events.
Suppressing unwanted data, thereby reducing the amount of data searched, resulting in faster speeds.
So, how was this proven? To quantify the benefits, I ran various tests generating 2GB/day in Docker containers on my Macintosh. It is a relatively beefy box, with 8 CPU cores and 32GB RAM. For this test, I used Tomcat application logs; these have high variability, with several event formats in one log file.
Below is a snapshot of a Stream pipeline processing the Tomcat application logs. In this case, the pipeline is doing transformations for four distinct types of identified events:
Events reporting response times as key-value pairs, in addition to some less-structured data.
Multi-line events reporting Java exception errors.
Events reporting statuses and metrics inside a JSON payload that takes up part of the event.
All other, mostly unstructured, events of info or error severity.

The pipeline has various functions to simplify transforming events. To see the impact of a change, you simply save the pipeline, then switch to the right Preview pane’s Event In/Out view to compare the before and after. Here’s how some of the events look like before being processed by Stream:

And here’s the after:

Now, jumping to Splunk. Two versions of this dataset were sent to a Splunk instance:
Raw, unprocessed logs from a Stream datagen targeted to
index=main.Processed logs, with events targeted to
index=app_eventsAnd with converted metrics targeted toindex=app_metrics.
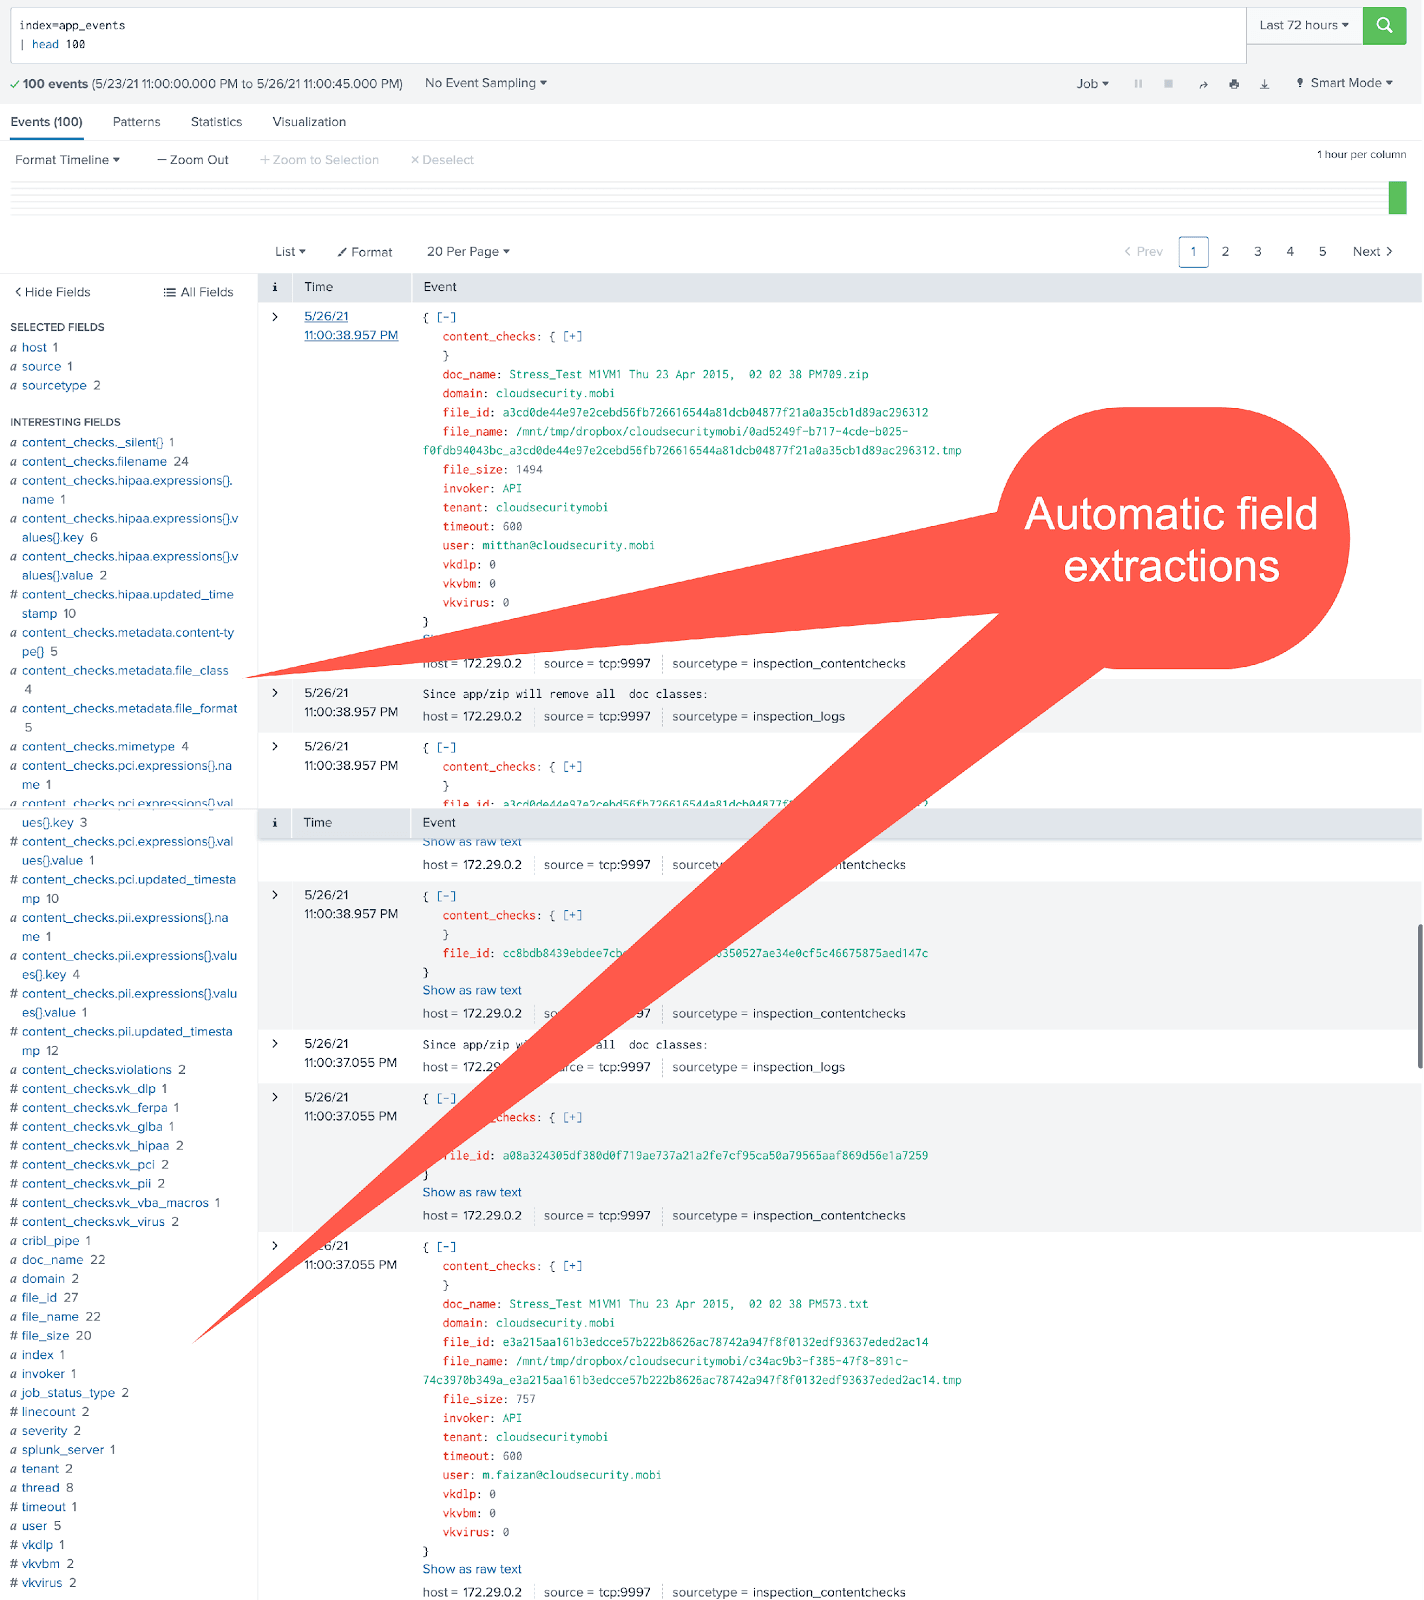
Here’s what the unprocessed events look like in Splunk:

And here are some of the Stream-processed events in Splunk:
And the metrics converted by Stream are all visible under the analytics workspace:

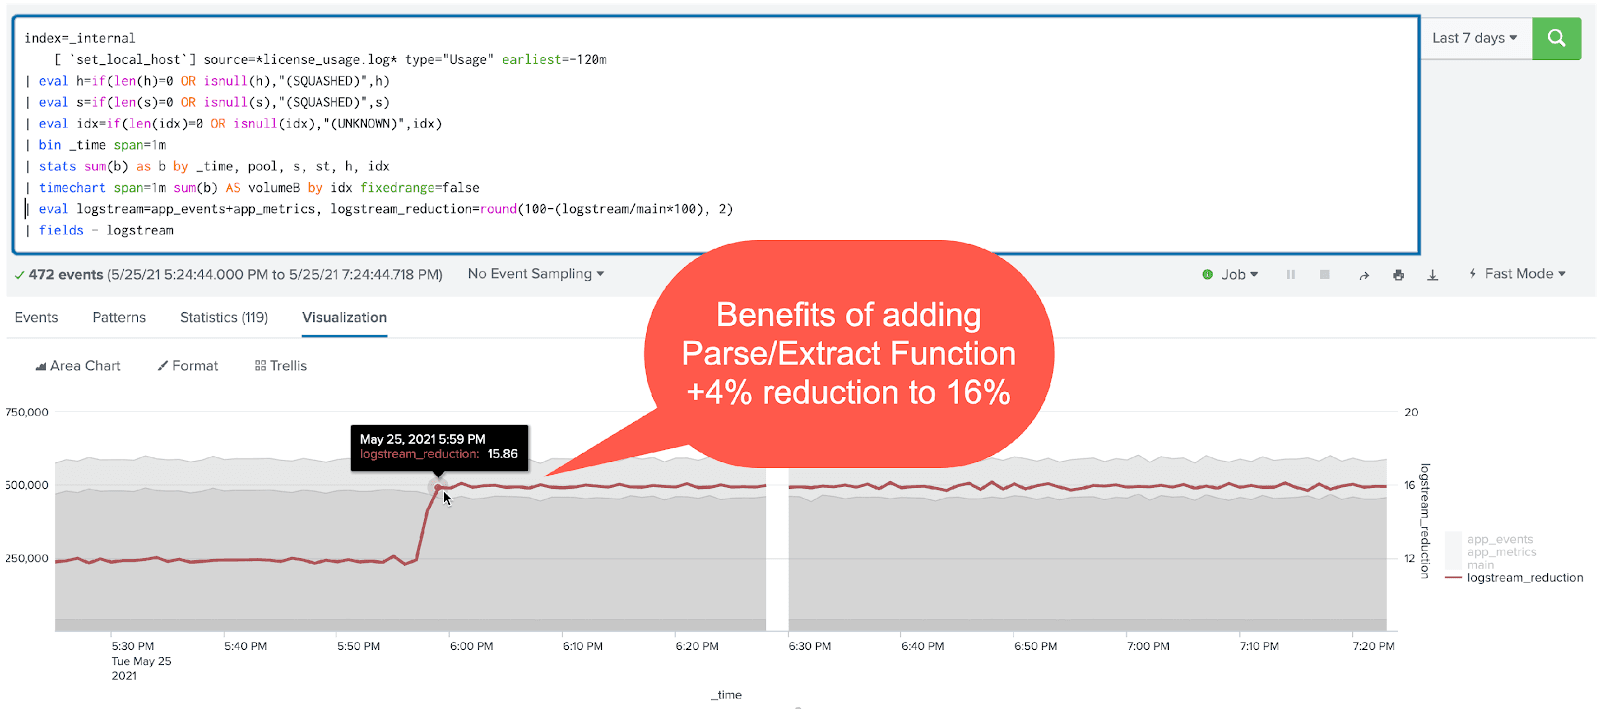
Through a single Stream pipeline, we can transform this combined dataset to make room for additional data ingest by a modest 16%. But we are reaping more benefit from faster search performance, which translates to lower CPU usage on the Splunk infrastructure.
Now for the meat and potatoes (or if you’re a vegetarian, the wok-seared tofu)!
There will be a couple of search performance comparisons:
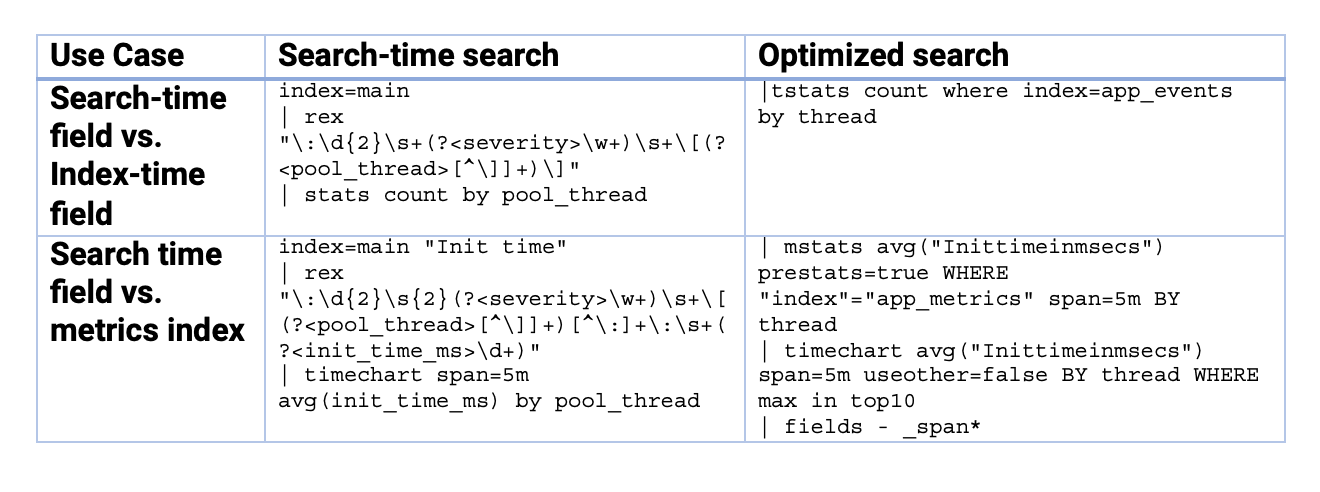
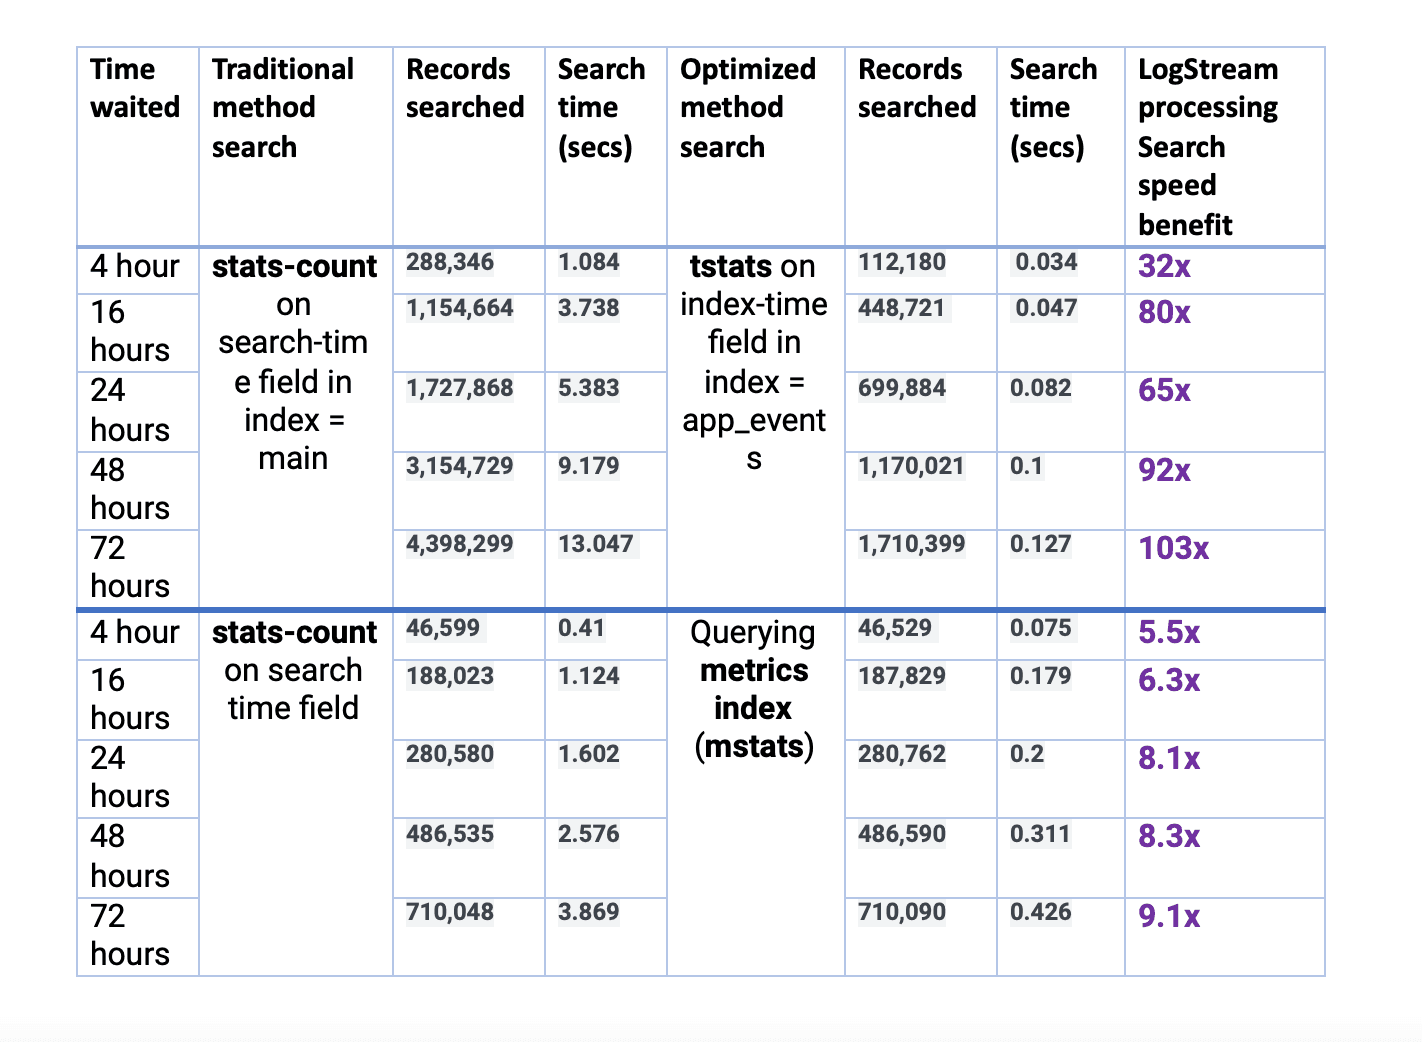
Comparison one – search-time field vs. index-time field within event indexes:
|stats countcommand on the raw events in index=main over 24,48, and 72 hours of data|tstatscommand on the raw events in index=app_events over 24,48, and 72 hours of data
Comparison two – search-time field in event index vs. data in a metrics index:
stats-averageof a metrics in one of the events in index=main over 24,48, and 72 hours of datamstats/analytics workspace rendering of the same metric inindex=app_metricsover 24,48, and 72 hours of dataAnd the searches used:

And here are the results from all the tests:
Note that the variation in record counts for the 1st scenario is due to Stream converting many events to a metrics index. Even if we filtered the higher count events within index=main to match the lower count events in index=app_events, we’d have to add a filter, which would slow down the search. This would actually result in a longer response time. And hence, this would further favor the Stream-processed method.
Conclusion on Improving Splunk Performance
While the performance difference is expected to be even better in production environments, there is no debate. Optimize your data through Stream and improve your search performance between 5x and 100x for small to moderate scenarios, and potentially, even more, when you process terabytes/day of data. If you want to get started improving Splunk performance, sign up for Cribl.Cloud to process up to 1 TB a day for free.
The fastest way to get started with Cribl Stream is to sign-up at Cribl.Cloud. You can process up to 1 TB of throughput per day at no cost. Sign-up and start using Stream within a few minutes.