
Metrics are a huge part of “modern” monitoring. Distilling a workload down to a few key metrics, and alerting based on anomalies, can be an incredibly effective way to monitor your application. According to the Google SRE book, system health can be monitored using the four “golden signals”:
Latency – time taken to service requests
Traffic – the actual use of the system
Errors – error counts (and actual errors)
Saturation – the system’s capacity to handle traffic
These are great for determining the operational health of a system, but for applications that were not built to emit these types of metrics (like many enterprise applications), solutions can often be overly complex and difficult to work with. The good news is that pretty much everything generates some operational output, most often in the form of logs…
Metrics Extraction
Most companies have a log analysis system in their monitoring toolkit. Many logging systems have mechanisms for extracting and calculating metrics from logs. This can be as simple as counting events that match some criteria. For example, take the below group of firewall events:
Jan 10 16:46:36 PA-VM 1,2021/01/10 16:46:36,44A1B3FC68F5304,TRAFFIC,end,2049,2021/01/10 16:46:36,10.0.1.54,172.16.3.204,10.0.1.54,172.16.3.204,splunk,,,ssl,vsys1,trusted,trusted,ethernet1/2,ethernet1/3,log-forwarding-default,2021/01/10 16:46:36,574240,1,51864,8000,24167,8000,0x500070,tcp,allow,5937,1520,4417,23,2021/01/10 16:46:36,13,any,0,730198,0x0,10.0.0.0-10.255.255.255,United States,0,13,10,tcp-fin,0,0,0,0,,PA-VM,from-policy,,,0,,0,,N/A,0,0,0,0Jan 10 16:46:37 PA-VM 1,2021/01/10 16:46:37,44A1B3FC68F5304,TRAFFIC,end,2049,2021/01/10 16:46:37,10.0.3.13,10.0.2.247,10.0.3.13,10.0.2.247,splunk,,,incomplete,vsys1,trusted,trusted,ethernet1/3,ethernet1/2,log-forwarding-default,2021/01/10 16:46:37,574255,1,56524,8088,56524,8088,0x400064,tcp,allow,296,296,0,4,2021/01/10 16:46:37,7,any,0,730195,0x0,United States,10.0.0.0-10.255.255.255,0,4,0,aged-out,0,0,0,0,,PA-VM,from-policy,,,0,,0,,N/A,0,0,0,0Jan 10 16:46:38 PA-VM 1,2021/01/10 16:46:38,44A1B3FC68F5304,TRAFFIC,end,2049,2021/01/10 16:46:38,10.0.1.55,172.16.3.210,10.0.1.55,172.16.3.210,splunk,,,incomplete,vsys1,trusted,trusted,ethernet1/3,ethernet1/2,log-forwarding-default,2021/01/10 16:46:38,574284,1,41916,8088,41916,8088,0x400064,tcp,drop,74,74,0,1,2021/01/10 16:46:38,0,any,0,730223,0x0,United States,10.0.0.0-10.255.255.255,0,1,0,aged-out,0,0,0,0,,PA-VM,from-policy,,,0,,0,,N/A,0,0,0,0Jan 10 16:46:39 PA-VM 1,2021/01/10 16:46:39,44A1B3FC68F5304,TRAFFIC,end,2049,2021/01/10 16:46:39,10.0.2.65,188.146.131.155,10.0.2.65,188.146.131.155,splunk,,,incomplete,vsys1,trusted,untrusted,ethernet1/3,ethernet1/2,log-forwarding-default,2021/01/10 16:46:39,574307,1,53688,8088,53688,8088,0x400064,tcp,drop,296,296,0,4,2021/01/10 16:46:39,7,any,0,730254,0x0,United States,10.0.0.0-10.255.255.255,0,4,0,aged-out,0,0,0,0,,PA-VM,from-policy,,,0,,0,,N/A,0,0,0,0Jan 10 16:46:40 PA-VM 1,2021/01/10 16:46:40,44A1B3FC68F5304,TRAFFIC,end,2049,2021/01/10 16:46:40,192.168.5.18,172.16.2.146,192.168.5.18,172.16.2.146,splunk,,,incomplete,vsys1,trusted,trusted,ethernet1/3,ethernet1/2,log-forwarding-default,2021/01/10 16:46:40,574256,1,52458,8088,52458,8088,0x400064,tcp,allow,74,74,0,1,2021/01/10 16:46:40,0,any,0,730194,0x0,United States,10.0.0.0-10.255.255.255,0,1,0,aged-out,0,0,0,0,,PA-VM,from-policy,,,0,,0,,N/A,0,0,0,0Jan 10 16:46:41 PA-VM 1,2021/01/10 16:46:41,44A1B3FC68F5304,TRAFFIC,end,2049,2021/01/10 16:46:41,192.168.1.217,10.0.1.80,192.168.1.217,10.0.1.80,splunk,,,incomplete,vsys1,trusted,trusted,ethernet1/3,ethernet1/2,log-forwarding-default,2021/01/10 16:46:41,574252,1,34740,8088,34740,8088,0x400064,tcp,drop,296,296,0,4,2021/01/10 16:46:41,7,any,0,730193,0x0,United States,10.0.0.0-10.255.255.255,0,4,0,aged-out,0,0,0,0,,PA-VM,from-policy,,,0,,0,,N/A,0,0,0,0Jan 10 16:46:43 PA-VM 1,2021/01/10 16:46:43,44A1B3FC68F5304,TRAFFIC,end,2049,2021/01/10 16:46:43,172.16.2.251,10.0.3.188,172.16.2.251,10.0.3.188,splunk,,,incomplete,vsys1,trusted,trusted,ethernet1/3,ethernet1/2,log-forwarding-default,2021/01/10 16:46:43,574277,1,52564,8088,52564,8088,0x400064,tcp,allow,74,74,0,1,2021/01/10 16:46:43,0,any,0,730218,0x0,United States,10.0.0.0-10.255.255.255,0,1,0,aged-out,0,0,0,0,,PA-VM,from-policy,,,0,,0,,N/A,0,0,0,0Jan 10 16:46:44 PA-VM 1,2021/01/10 16:46:44,44A1B3FC68F5304,TRAFFIC,end,2049,2021/01/10 16:46:44,172.16.3.198,10.0.2.123,172.16.3.198,10.0.2.123,splunk,,,incomplete,vsys1,trusted,trusted,ethernet1/3,ethernet1/2,log-forwarding-default,2021/01/10 16:46:44,574293,1,42010,8088,42010,8088,0x400064,tcp,allow,74,74,0,1,2021/01/10 16:46:44,0,any,0,730227,0x0,United States,10.0.0.0-10.255.255.255,0,1,0,aged-out,0,0,0,0,,PA-VM,from-policy,,,0,,0,,N/A,0,0,0,0Jan 10 16:46:45 PA-VM 1,2021/01/10 16:46:45,44A1B3FC68F5304,TRAFFIC,end,2049,2021/01/10 16:46:45,172.16.3.30,172.16.1.187,172.16.3.30,172.16.1.187,splunk,,,incomplete,vsys1,trusted,trusted,ethernet1/3,ethernet1/2,log-forwarding-default,2021/01/10 16:46:45,574281,1,48644,8088,48644,8088,0x400064,tcp,allow,296,296,0,4,2021/01/10 16:46:45,7,any,0,730228,0x0,United States,10.0.0.0-10.255.255.255,0,4,0,aged-out,0,0,0,0,,PA-VM,from-policy,,,0,,0,,N/A,0,0,0,0
If you were simply to do a count of of these 9 events, grouped by the firewall action, you’d end up with:
So now, you’ve got a metric that shows you what your firewall is doing. Track that out over time, and you can see trends. Any anomaly in that trend could be a problem that you need to investigate.
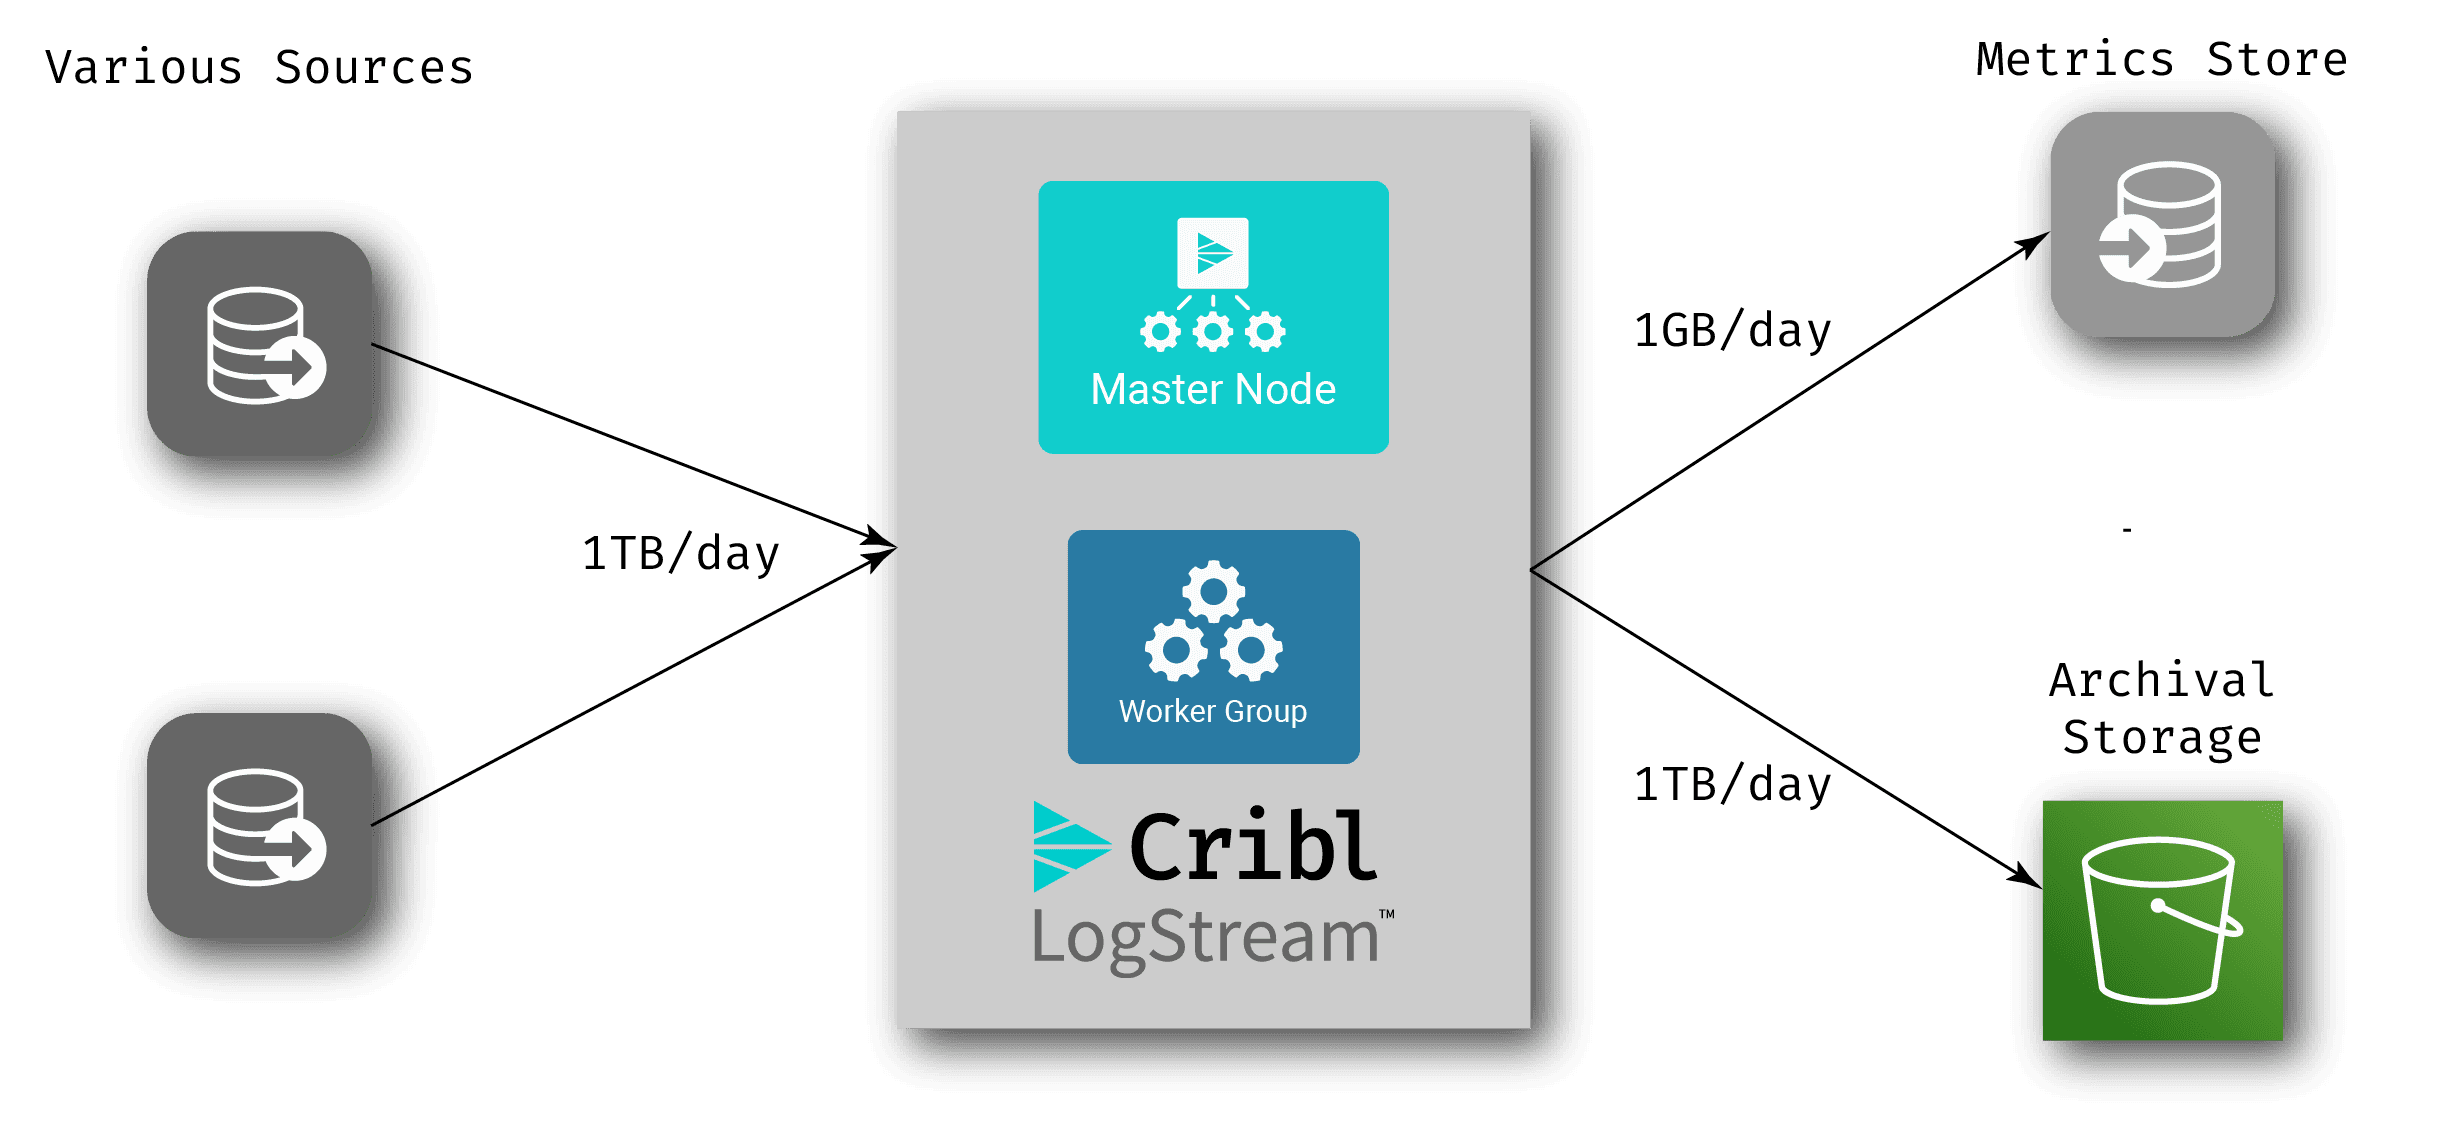
But what if you don’t want to ingest all of your log data into a log system, or you have multiple log systems, each handling a different set of operational systems? This is a fairly common scenario as organizations move to more distributed development models. In this case, placing an intermediate system in front of your logging/monitoring systems can give you the ability to calculate these metrics, send them to an analytics system, and then archive that data in cheap archive storage. Cribl LogStream does this out of the box.
Incremental Retooling
While complete retooling may not be practical, some tools already present (for example Splunk or ElasticSearch/Kibana) can be used to extract metrics out of existing data and build dashboards and alerts, implementing the “metric-first” monitoring approach.
If you have more than one tool present (and most do), you might need to implement the same thing across both, and that can be both complicated and a maintenance nightmare – if you don’t have the same metadata in both places, you’ll end up with systems that give different answers to the same question. Inserting a system like Cribl LogStream into your data flow can facilitate low-maintenance “incremental retooling”: Since LogStream can receive, transform, and route data to multiple destinations, adding a workflow to send metric data to a new tool is trivial. We do this in our corporate LogStream environment – we’ve used this approach to evaluate new time series databases, additional logging systems, SaaS systems, etc.
Publishing Metrics in LogStream
The LogStream product allows you to create pipelines for your data, assembling functions to aggregate or transform the data as it makes its way through. We have parsing functions that can extract data from a log line, either via regex or known formats (like JSON, CSV, K=V, etc.), as well as a number of useful functions for converting that data to metrics:
Aggregations
This function aggregates the data from multiple events into calculated values. It provides multiple statistical functions, like summation, calculation of standard deviations, and averaging (for example, over a configurable time period).
Publish Metrics
This function formats the event as a metrics event, setting things like the field type (counter, gauge, or timer), as well as any field name tweaking that might need to be done for the metrics store.
Prometheus Publisher
If you are a Prometheus shop, this function allows you to take the metrics you’ve extracted from logs and publish them to a Prometheus endpoint.
Rollup Metrics
If you have metrics data that is coming in at a rate that’s too high, you can use this function to change the granularity. For example, if your metrics are coming in at 2-second intervals, but you’d prefer to store it at 1-minute intervals, the Rollup Metrics function will stage those metrics, and calculate them in the 1-minute time window.
Supercharge your Workflow
If you add archiving of all of your log data to archive storage, you enable reprocessing of that data at any time – what we like to call “Replay”. Combining this with our metrics approach can help you drastically reduce the amount of data you’re sending to your analysis systems, while still maintaining all of that data for later use. This opens up some interesting options for streamlining workflow. Take, for example, the following setup:
In this scenario, there is no log analytics system in the normal workflow – log data comes into LogStream, gets archived off, and via metrics extraction, a much smaller set of data gets written to the metrics store. When an anomaly occurs, you can add LogStream’s replay capabilities (our data collection feature) to pull all the relevant raw data from the archive storage into an analysis system that’s created just for the investigation of that anomaly – also known as an ephemeral analysis system. There are multiple cloud-based options out there log/metrics systems that you can spin up and spin down in a pay-as-you-go model. Take the following example:
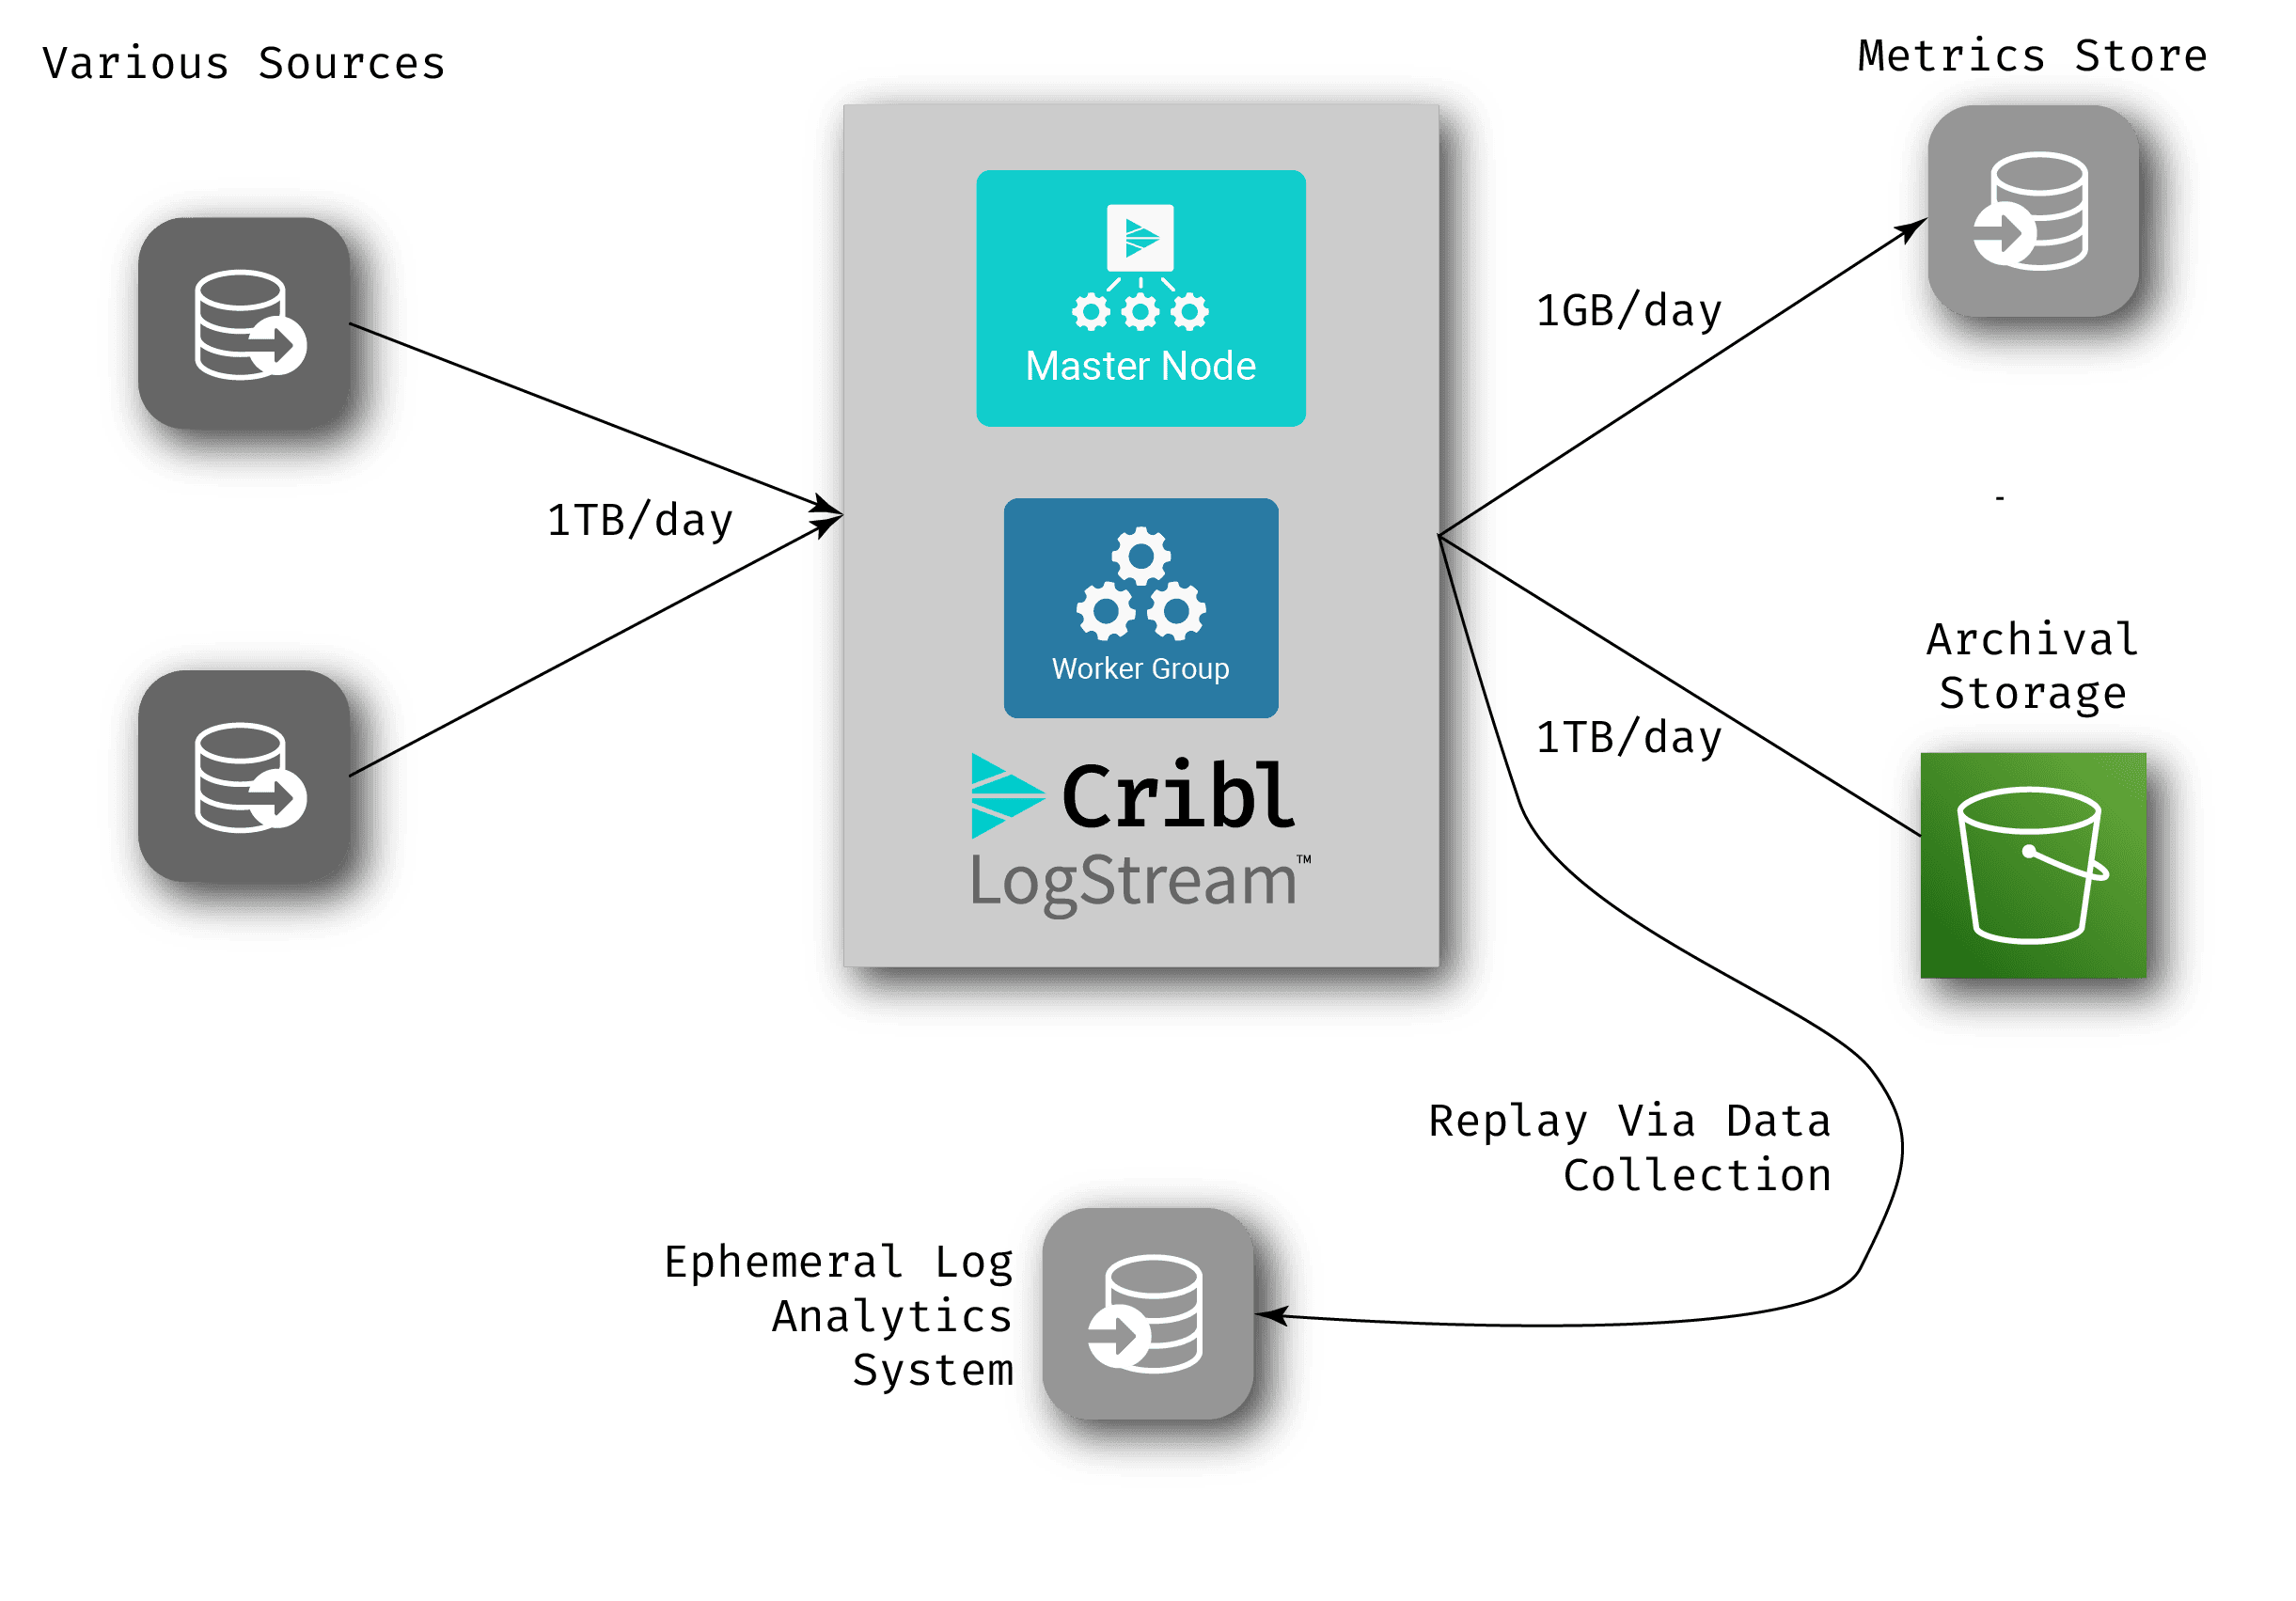
Engineers can then investigate in the ephemeral system. If they find that they need more data, they can use the replay capability to retrieve it, and then once the problem is fixed, simply delete the entire log analytics system.
Putting it All Together: Metric Extraction
Metrics can be an incredibly useful and important part of your observability strategy. A system that can extract metrics that you otherwise would not have available – as well as enrich and route data – provides a very powerful tool to unlock those metrics. LogStream is that tool.
Want to learn more? Try our Metrics Sandbox to see this in action. Want to try LogStream with your own data? LogStream Cloud gives you a dedicated LogStream environment that you can start using immediately. We take care of the data infrastructure management and scaling, so you don’t need to, making this the easiest and fastest way to realize the value of an observability pipeline.