

VMware vSphere Kubernetes Service (VKS) is the feature of VMware Cloud Foundation (VCF) that streamlines the hardest parts of running Kubernetes: cluster provisioning, upgrades, and automated lifecycle etc., and does so with a CNCF-conformant runtime. The telemetry those clusters produce is a different story. Container logs need to reach the SIEM. Metrics need to reach Grafana for the app teams and VCF Operations for the VI admins. Events need to land somewhere searchable, and everything needs a cheap place to live for the next year.
There is a common observability problem that we all relate to: Fluent Bit shipping the same log stream to both Loki and VCF Operations for Logs, and the same metrics landing in both Grafana and VCF Operations. Two audiences, two collection paths, the same data twice. Multiply by every cluster and every tool, and platform teams end up managing agent sprawl and paying twice for data they only collected once.
Cribl Edge on VKS solves this with one lightweight agent per node that decouples collection from destination — and we've now validated it end to end on VKS 3.6 in a joint reference architecture published by Broadcom.
One agent per node, no in-cluster control plane
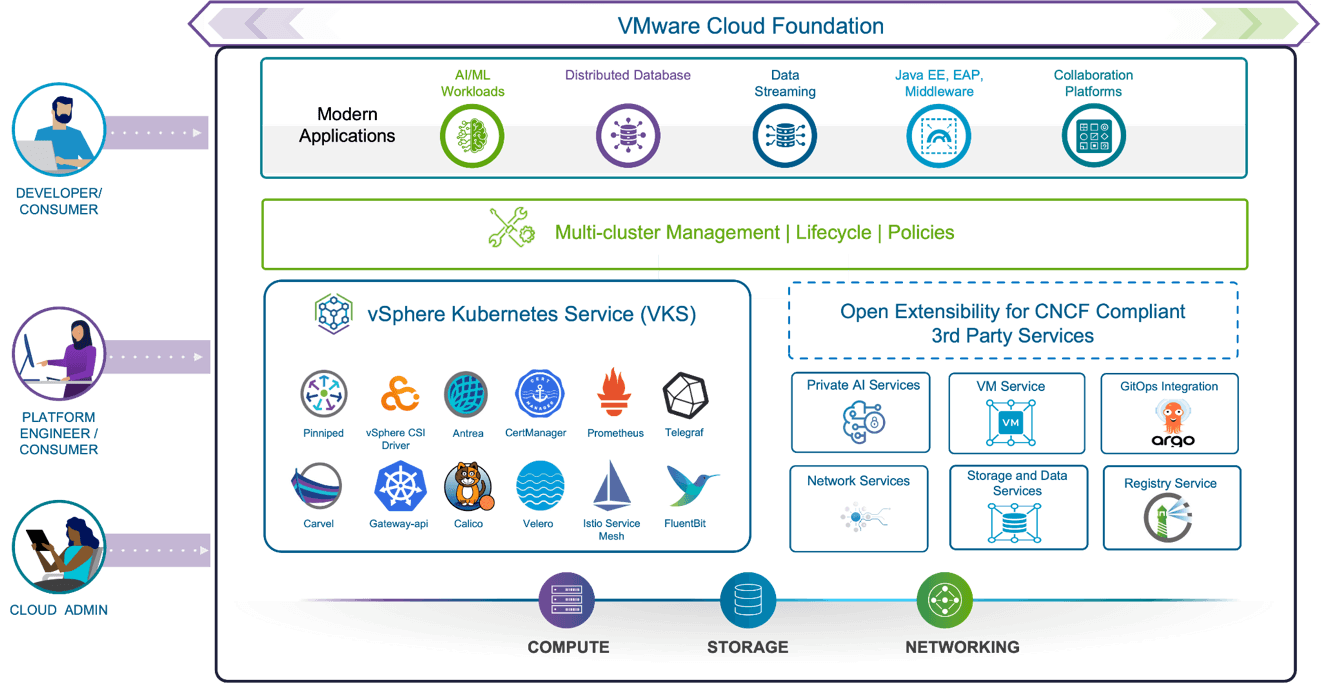
VKS on VCF: a CNCF-conformant Kubernetes runtime with multi-cluster lifecycle management, core packages such as Antrea, Pinniped, and the vSphere CSI driver, and open extensibility for third-party services like Cribl Edge.
Cribl Edge deploys to a VKS cluster as a Kubernetes DaemonSet using the official Cribl Helm chart. One pod schedules on every worker node. Each pod authenticates outbound to Cribl.Cloud over TLS on port 4200, receives its configuration from the assigned Fleet, and starts collecting three classes of telemetry from the local node: container logs, cluster events, and node and workload metrics.
There is nothing else to run inside the cluster. No Leader, no persistent volumes, no per-node configuration once workers register. That matches how VKS itself operates — the cluster is disposable, declaratively defined, and managed by Cluster API — so Edge fits the lifecycle rather than fighting it.
Edge also integrates with the Kubernetes control plane directly. Every event it emits is enriched at the source with pod, namespace, node, container, image, and owner metadata, plus pod labels and annotations. By the time data leaves the node, it already knows where it came from.
Collect once, route anywhere
The part that changes the economics is what happens after collection. Traditional log forwarders hardwire a source to a destination; if two tools need the data, you run two forwarders or configure one to ship twice. Cribl Edge separates the two. The same telemetry streams once from the node to Cribl Stream, and Stream decides where it goes.
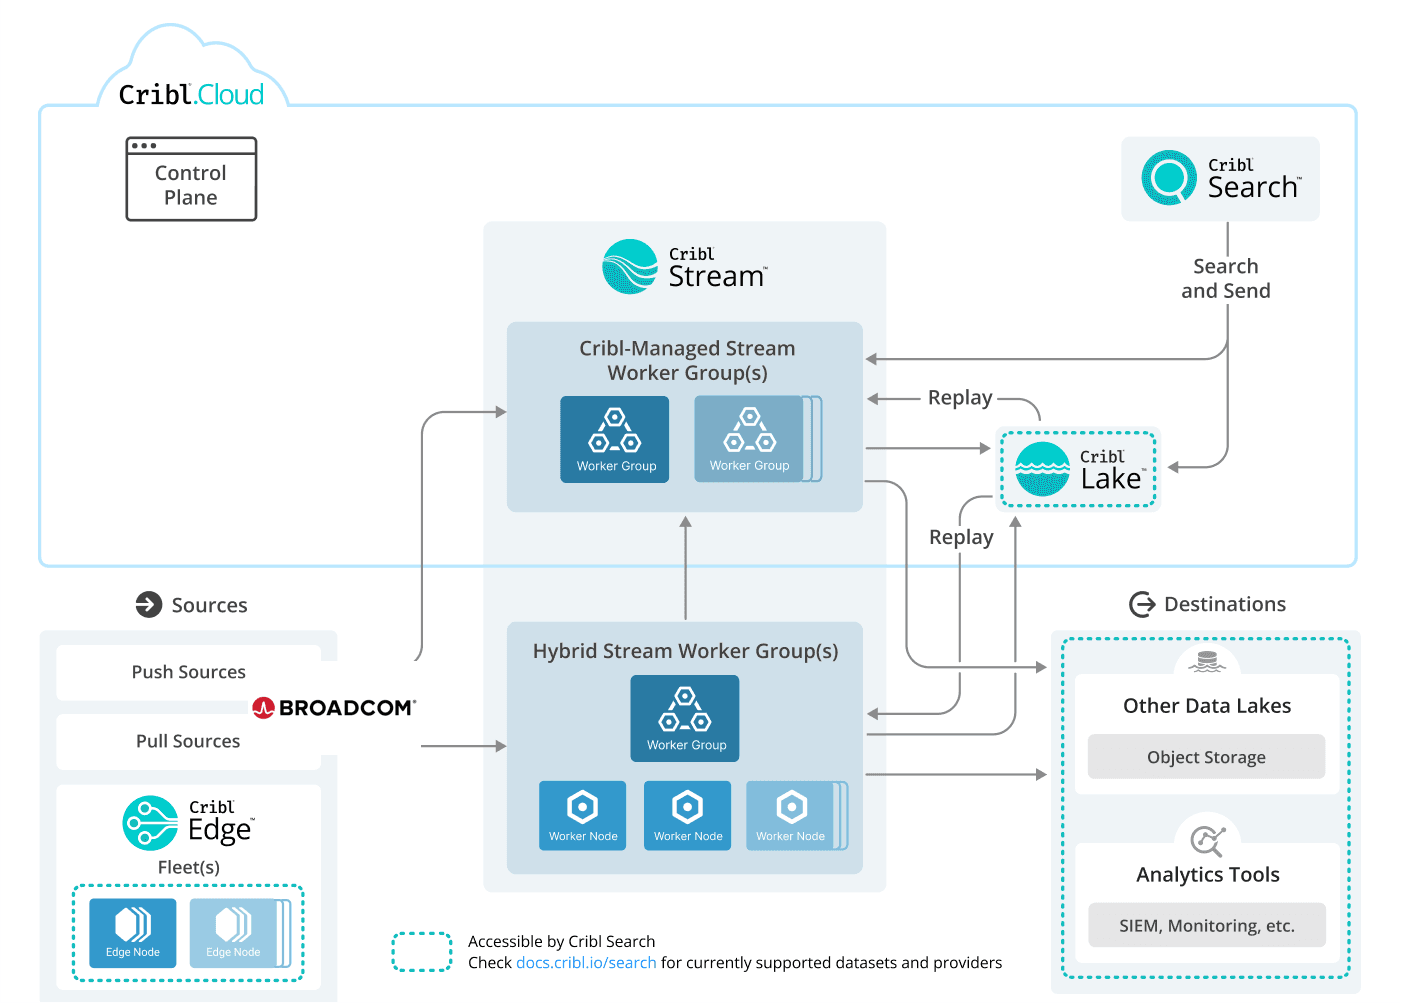
Edge fleets on Broadcom VKS worker nodes feed Cribl Stream, Cribl Search, and Cribl Lake in Cribl.Cloud, with routing to downstream data lakes and analytics tools and replay from Lake when a new destination needs history.
That means one VKS cluster can feed Splunk, Elastic, Datadog, Grafana, VCF Operations, and Amazon S3 from a single agent. Stream converts formats in flight — Syslog, OpenTelemetry, HEC, JSON — so each destination gets what it expects. And because routing is a pipeline decision rather than an agent decision, you can add a destination, drop one, or change what each receives without touching the cluster.
The cost lever is fidelity tiering. Full-detail logs go to Cribl Lake for search and replay. A reduced, sampled stream goes to the SIEM, where every gigabyte is metered. Summarized metrics go to Grafana and VCF Operations. The VKS observability reference architecture's double-ship to Loki and VCF Operations for Logs becomes one collection pass with two outputs, each sized for its audience. Teams observe more clusters without commit-tier growth on the tools downstream.
Cribl Edge on VKS in action
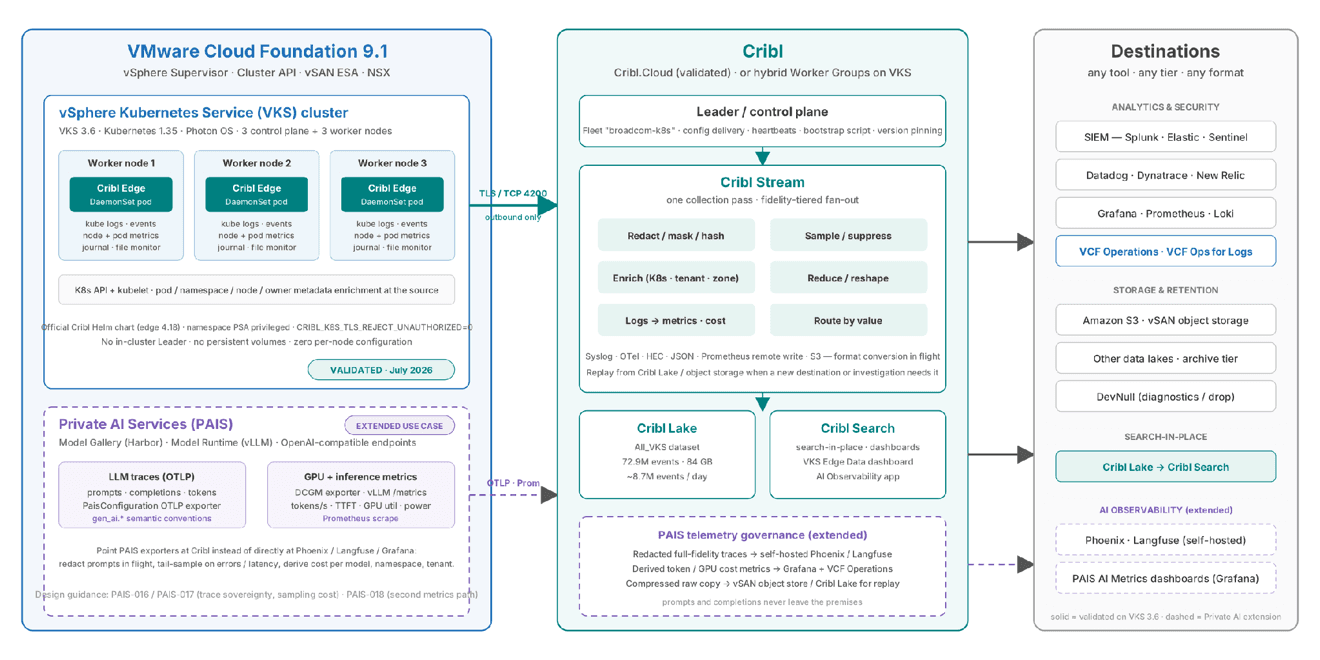
Cribl Edge on every VKS worker node streams to Cribl.Cloud, where Stream routes each signal at the fidelity its destination needs. Solid lines are the validated path; dashed lines show the Private AI Services extension.
Here is what the deployment looks like on a three-worker VKS 3.6 cluster. The full command-line walkthrough is in the joint reference architecture, Cribl Edge on vSphere Kubernetes Service on VMware Cloud Foundation (https://www.vmware.com/docs/isv-cribl-edge-vks-vcf); these are the four steps that matter.
Prepare the namespace. VKS enables Pod Security Admission by default, and the baseline profile forbids hostPath volumes. Edge needs hostPath to read container logs and node metrics, so the target namespace is labeled pod-security.kubernetes.io/enforce=privileged before anything deploys.
Deploy with the Cribl.Cloud bootstrap script. In Cribl.Cloud, open your Fleet, choose Add/Update Edge Node, pick Linux, and copy the generated Helm command. It already carries the workspace URL, Leader address, and auth token. Add one environment variable, CRIBL_K8S_TLS_REJECT_UNAUTHORIZED=0, so Edge tolerates the self-signed kubelet certificates VKS issues per node.
Confirm the DaemonSet scheduled. kubectl get daemonset cribl-edge -n cribl should show DESIRED, CURRENT, and READY all equal to your worker count. Within a couple of minutes, the Fleet header in Cribl.Cloud shows those nodes connected.
Verify data is flowing. Open the Fleet's Collect view to see sources wired to destinations, then check the destination's Charts tab for climbing event counts and zero drops.
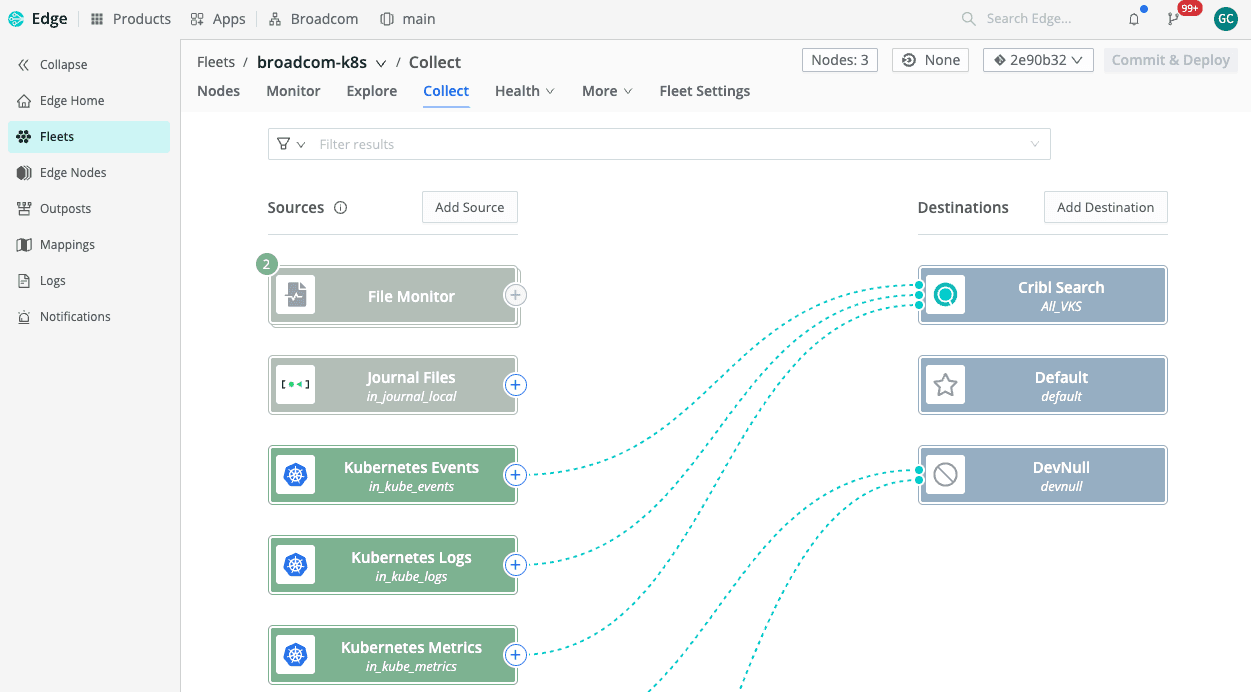
The broadcom-k8s Fleet with three Edge nodes connected. Kubernetes Events, Logs, and Metrics sources plus File Monitor and Journal Files are routed to a Cribl Search destination, with a DevNull tap for diagnostics.
From there the data is immediately usable. A Cribl Search dashboard querying the VKS dataset in Cribl Lake renders an operational view of the cluster with no additional transformation.
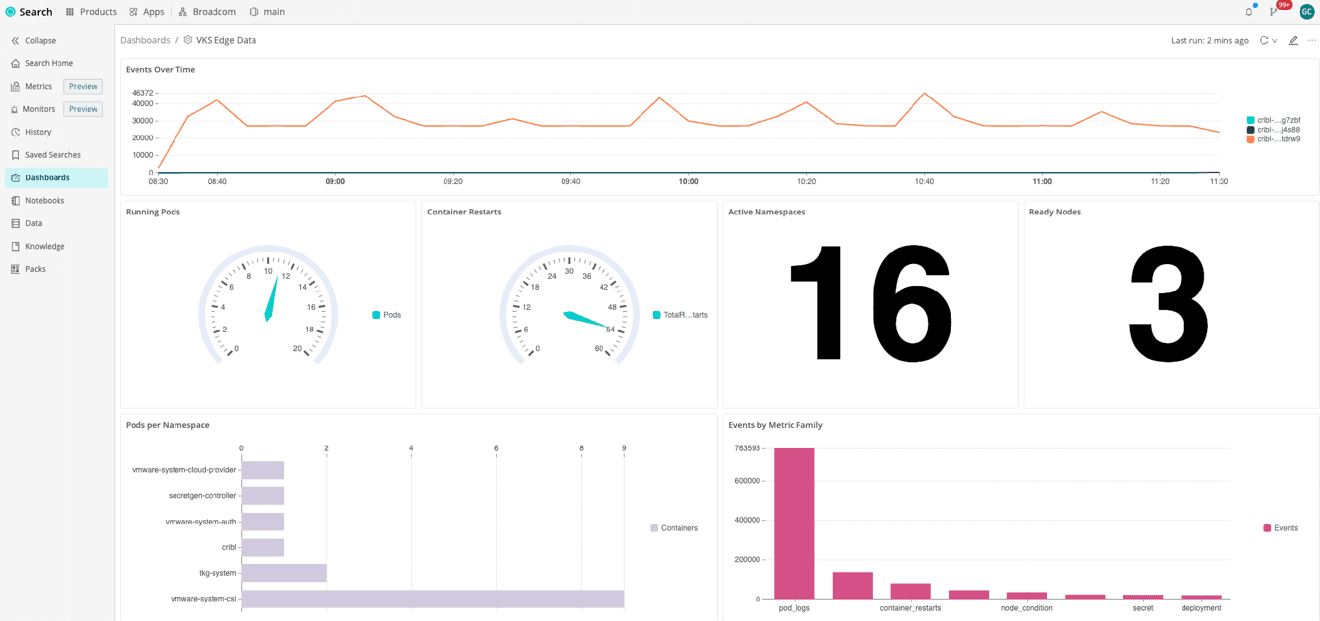
Events over time by Edge node, running pods, container restarts, 16 active namespaces, 3 ready nodes, and event volume by metric family — all from telemetry Edge enriched at the source.
One place to search all of it
Routing solves where the data goes. Cribl Search solves the question that comes right after: when something breaks at 2 a.m., where do you look? With VKS telemetry landing in Cribl Lake, the answer is one search bar.
The Lakehouse engine ingests Edge data directly into search-optimized storage and returns results in near real time, which is what the VKS Edge Data dashboard above is built on. In the validation, that was 72.9 million events across twelve days, queryable the moment they landed, with no pipeline to build and no schema to define first. Analysts type a question in plain language and Copilot turns it into the query; agentic search suggests the next step and surfaces the people who touched the same incident.
The federated engine handles everything that did not land in Lake. It searches in place across Amazon S3, vSAN object storage, Azure Blob, and third-party stores without moving the data first, so the compressed raw copy you archived last year is still one query away. Search first, collect second: check whether cold data is worth rehydrating before you pay to ingest it.
For VKS platform teams this changes the operating model. Instead of standing up Loki for logs, Prometheus for metrics, and a separate store for events, the Edge DaemonSet lands all three in one dataset with the Kubernetes metadata already attached. A pod restart, the node it was on, the container image, and the events around it are one search, not three tools and a spreadsheet. And because Cribl Search coexists with Splunk, Elastic, an teams that already live in those tools keep their routed slice while everyone else gets the full-fidelity view at object-storage prices.
What we validated
The joint reference architecture validates Cribl Edge 4.18 on VKS 3.6 running Kubernetes 1.35 on Photon OS, with vSAN ESA storage and FIPS-mode containerd. Three control plane nodes, three workers, one Edge pod per worker.
Over a twelve-day window, the three Edge nodes sustained roughly 58 events per second and 53 KB/s with zero dropped events, delivering 72.9 million events and 84 GB into a Cribl Lake dataset at a steady 8.7 million events per day. Every event carried full Kubernetes metadata: node, pod, container, image, owner kind, and owner name.
Two VKS-specific accommodations were needed, and both are one-liners: the privileged PSA label on the namespace, and the CRIBL_K8S_TLS_REJECT_UNAUTHORIZED environment variable for the per-node kubelet certificate. For production environments that require explicit certificate trust, mount the kubelet CA into the Edge pods and set NODE_EXTRA_CA_CERTS instead. Nothing else about VKS — Antrea networking, Pinniped auth, the vSphere CSI driver — required any change.
Where this goes next: VMware Cloud Foundation Private AI Services
VCF Private AI Services supports AI inferencing on the VCF platform, with vLLM behind OpenAI-compatible endpoints, and it emits extensive telemetry: OpenTelemetry LLM traces, vLLM inference metrics, and DCGM GPU metrics. Broadcom's design guidance notes that because these traces can contain prompts and completions, they should stay on-premises, and sampling must be tuned to balance coverage against cost.
The same pipeline pattern applies. Point the PaisConfiguration OTLP exporter at a Cribl Stream OpenTelemetry source instead of directly at Phoenix or Langfuse. Redact or hash prompt and completion content in flight. Tail-sample on errors and latency outliers. Derive token-to-dollar cost metrics per model, namespace, and tenant. Then fan out: redacted full-fidelity traces to a self-hosted trace store, cost metrics to the Grafana dashboards PAIS already requires and to VCF Operations, and a compressed raw copy to vSAN object storage or Cribl Lake for replay.
This is the same pattern we describe for AI telemetry generally: five consumers — SRE, security, FinOps, eval platforms, and long-term archive — each needing a different fidelity and cost tier from the same GPU cluster, served from one collection pass instead of four competing scrapes. On VCF, Edge is already on the node and Search is already indexing the cluster, so the AI signals join the same dataset the platform team is searching today. We are building out this extension now and will cover it in a follow-up post.
Kubernetes observability without the lock-in
VKS gives platform teams a managed, CNCF-conformant Kubernetes runtime on VCF. Cribl Edge gives them a telemetry layer that scales with it: one lightweight agent per node, no in-cluster control plane, Kubernetes context attached at the source, routing decoupled from collection so the same data can reach every tool at the fidelity each one deserves, and Cribl Search to investigate all of it in one place, whether it lives in Lake or in the object store it was archived to. It's validated, documented, and takes about ten minutes to stand up.
If you're running VKS, download the reference architecture from Broadcom, spin up a free Cribl.Cloud workspace, and point a Fleet at your cluster. The free tier covers 1 TB a day, which is more than enough to see it work.