
What are log monitoring tools?
Log monitoring tools are software platforms that collect, parse, index, and analyze log data from applications, infrastructure, and security systems in real time. They enable teams to detect anomalies, trigger alerts, and speed incident response across distributed environments.
It helps to distinguish log monitoring from the broader discipline of log management. Log monitoring focuses on real-time detection, alerting, and operational response. Log management covers the full lifecycle: ingestion, indexing, storage, retention, governance, and compliance reporting. Centralizing logs from multiple sources into one platform simplifies troubleshooting and performance monitoring, and layering real-time analysis on top adds further value.
Modern observability platforms correlate logs with metrics, traces, and events, making log monitoring a key pillar of unified observability rather than a standalone function.
Enterprises in 2026 must monitor several distinct log types: application logs generated by code, event logs from operating systems and middleware, syslog data from network devices and infrastructure, and security logs feeding SIEMs and compliance workflows. Each category has different volume profiles, retention requirements, and query patterns.
Three forces are converging. First, AI-assisted anomaly detection can reveal unusual patterns without preset thresholds, reducing noise and prioritizing high-risk events. Second, OpenTelemetry has become the standard for instrumenting, generating, collecting, and exporting telemetry data across metrics, logs, and traces. Third, data volumes continue to surge, with IBM noting that organizations at scale may handle billions of log events daily, making pipeline-level control and cost optimization essential.
Evaluation rubric and tl;dr picks
Every tool in this guide was evaluated across six dimensions: scalability, alerting and automation, cost efficiency, security and compliance readiness, integration depth, and vendor neutrality. The picks below reflect which platforms lead in each category based on those criteria. No single tool tops every dimension, which is why the strongest enterprise architectures combine a pipeline and routing layer with one or more analytics destinations.
Best for pipeline control and cost reduction: Cribl Stream and Cribl Lake
Best for unified observability and AI-assisted analytics: Datadog
Best for security and compliance: Splunk
Best open-source full-text search: Elastic Stack (ELK / OpenSearch)
Best for cost-efficient Kubernetes logging: Grafana Loki
Best for APM-to-log correlation: New Relic
Best for automated root-cause analysis: Dynatrace
Best for cloud SIEM plus log analytics: Sumo Logic
Best purpose-built log management for compliance: Graylog
Best OpenTelemetry-native open-source observability: SigNoz
Best for simple cloud log management: Loggly
Best for real-time syslog tailing: Papertrail
Best for log pipeline pre-processing: Mezmo
Best for unified IT operations: SolarWinds Observability
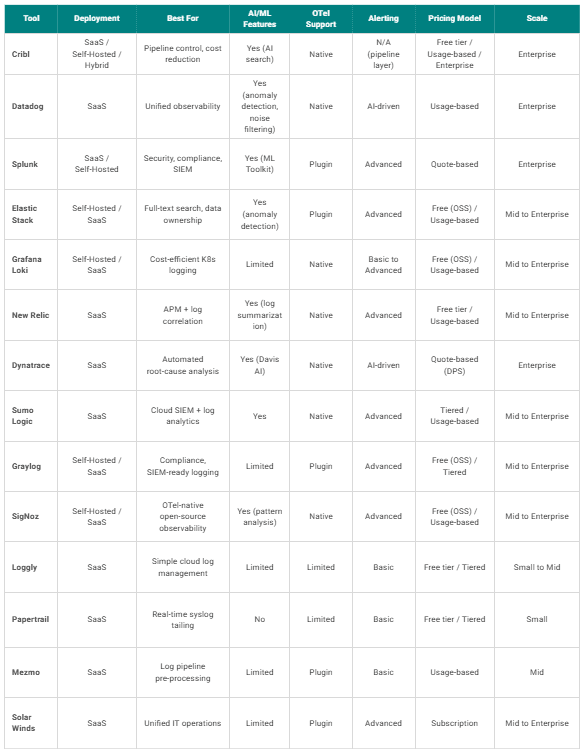
Comparing features and pricing of top log monitoring tools
The table below gives you an at-a-glance comparison across all 14 tools covered in this guide.
Cribl
Cribl is not a replacement for your log monitoring or SIEM platform. It is the data engineering layer between your sources and destinations, giving you control over what data goes where, in what format, and at what cost. Cribl treats pipelines as code and separates compute from storage, simplifying migrations and scale.
Cribl Stream is a real-time data routing and transformation engine. It lets teams filter, enrich, parse, and forward logs, metrics, and traces to any destination, whether that is Splunk, Elastic, Datadog, a cloud data lake, or all of them simultaneously. Because it is vendor-agnostic, you can onboard new tools or migrate away from old ones without lock-in or data loss.
Cribl Lake provides turnkey, cost-effective storage for raw telemetry data. It preserves full forensic value and enables search-in-place retrieval, which means you can meet compliance retention requirements and investigate incidents without rehydrating data into expensive analytics tiers. It preserves every byte while premium analytics costs are applied only to the data that needs it.
Cribl lakehouse engines bridge the gap between low-cost storage and high-speed investigation by pairing flexible retention with fast, investigation-ready search. With Cribl’s tiered approach, teams can keep broad volumes of lower-touch data in Lake or object storage, while using lakehouse engines for the hot, high-value data that needs sub-second performance and rapid time to insight.
Cribl Search is the layer that turns all of that data into answers. It gives teams one search experience across ingested and federated data, letting them ask questions in plain language, investigate faster with AI-assisted workflows, and get to insight without the usual delays of rehydration, pipeline work, or tool switching.
Pros: Vendor-agnostic routing to multiple destinations simultaneously. Reduces SIEM ingest costs by filtering and transforming data before it arrives. Supports OpenTelemetry natively. AI-powered search and retrieval in Cribl Lake. Trusted by half the Fortune 100. Free tier available for Cribl Stream (up to 1 TB/day).
Cons: Not a standalone dashboarding or alerting UI. Designed to work alongside analytics and SIEM platforms, not replace them.
Pricing: Free tier for Cribl Stream up to 1 TB/day. Cribl Lake pricing is based on storage consumed. Enterprise pricing is available for larger deployments.
Best for: Enterprises managing high-volume telemetry pipelines who need to reduce costs, avoid vendor lock-in, and maintain full data fidelity across hybrid and multi-cloud environments. Cribl complements Splunk, Elastic, Datadog, or any SIEM, and it integrates with partners including Elastic, Palo Alto Networks, SentinelOne, and CrowdStrike.
If you are weighing SIEM vs. log management, Cribl sits at the intersection, ensuring the right data reaches the right tool at the right cost.
Datadog
Datadog combines infrastructure monitoring, application performance, metrics, traces, and log management in one integrated platform. For teams running complex microservice architectures, having all signals in a single console reduces context switching and accelerates root-cause analysis.
In 2026, Datadog added smarter anomaly detection and noise filtering, increasing its AI-assisted analytics. Its real-time dashboarding, extensive integrations, and unified query experience make it a top choice for DevOps and SRE teams.
Pros: Unified logs, metrics, traces, and AI-assisted analytics in a single workflow. Strong for complex microservice environments. Extensive integrations. Real-time dashboarding with powerful query capabilities.
Cons: Can become expensive quickly at high log volumes. Pricing complexity with per-host and per-GB models can make budgeting unpredictable. Middleware notes it is best for large enterprises with complex environments and big budgets.
Pricing: Usage-based. Log management starts at $0.10/GB ingested plus indexing costs. Verify current pricing at time of evaluation.
Best for: DevOps teams running complex microservice architectures who want unified observability and AI-assisted analytics in a single workflow.
A practical cost-control strategy is to use Cribl Stream to route only high-value logs to Datadog while sending lower-priority data to cheaper storage. You keep full observability where it matters and reduce ingest costs where it does not.
Splunk
Splunk ingests, indexes, and searches machine data from applications, servers, and devices, and it remains the enterprise standard for security and compliance use cases. Its SPL query language is among the most powerful in the industry, and Splunk Enterprise Security provides full SIEM capabilities including security monitoring, incident detection, and response.
Pros: Mature SPL query language with deep analytical power. Deep security ecosystem including Splunk ES and SOAR. Extensive compliance reporting. Large community and app marketplace.
Cons: Quote-based pricing can be expensive at high volumes. Operational complexity for on-prem deployments. Steep learning curve for SPL.
Pricing: Quote-based. Workload pricing and ingest-based models are available.
Best for: Enterprises with security and compliance-focused monitoring needs, especially those already invested in the Splunk ecosystem.
Cribl Stream is widely deployed alongside Splunk to reduce ingest costs. By filtering, sampling, and routing data before it reaches Splunk indexes, teams routinely cut their Splunk licensing costs while preserving the data needed for security investigations and compliance.
Elastic Stack (ELK and OpenSearch)
The ELK Stack, consisting of Elasticsearch, Logstash, and Kibana, is one of the most popular log management and analytics solutions. Its full-text search capabilities are fast and well-understood, and Kibana's visualization layer is mature and flexible.
The trade-off is operational: running Elasticsearch at scale requires cluster, shard, and lifecycle expertise. Elastic Cloud reduces that burden but increases cost. For teams that want the Elastic experience without the Elastic licensing model, OpenSearch provides a fork alternative with full-text search, real-time analytics, dashboards, alerting, and anomaly detection.
Pros: Powerful full-text search. Mature Kibana visualization. Large ecosystem. Self-hosted or managed options. OpenSearch fork available for those wanting an open-source path.
Cons: Cluster management complexity at scale. Index tuning required for performance. Managed Elastic Cloud adds cost.
Pricing: Open-source self-managed is free. Elastic Cloud starts at approximately $95/month. OpenSearch is free and open-source.
Best for: Teams that want full-text analytics and data ownership, especially those with Elasticsearch operational expertise. Often chosen as a more affordable open-source alternative to Splunk.
Grafana Loki
Grafana Loki takes a different approach to log storage. Inspired by Prometheus, it indexes only metadata labels, not the log lines themselves. This design lowers indexing and storage costs, making it a strong option for teams that prioritize efficiency over full-text search.
Loki integrates natively with Grafana dashboards and is Kubernetes-friendly by design, which makes it a natural fit for cloud-native environments where container logs are ephemeral and cost per GB matters.
Pros: Extremely cost-efficient storage. Native Grafana integration. Kubernetes-friendly. Metadata-based indexing reduces overhead.
Cons: Limited full-text search compared to Elasticsearch. Query performance depends on label cardinality. Less suited for compliance-heavy use cases requiring deep forensic search.
Pricing: Open-source self-managed. Grafana Cloud offers a managed Loki tier with free and paid plans.
Best for: Cloud-native and Kubernetes monitoring teams using Grafana dashboards who prioritize storage cost over full-text search power. Middleware describes it as cost-efficient log storage for Grafana and Prometheus stacks.
New Relic
New Relic brings deep APM heritage to its log monitoring capabilities. Teams can get logs flowing quickly with its forwarder, guided install, or Fluent Bit and Logstash agents. The platform's AI features include log summarization and faster root-cause hypotheses, which accelerate investigations for DevOps teams already using New Relic for application performance.
Pros: Deep APM integration. AI-powered log summarization. Easy agent-based collection. Generous free tier with 100 GB/month ingest.
Cons: Log-specific features are newer compared to its APM capabilities. Costs can dramatically rise with high-cardinality custom attributes.
Pricing: Free tier with 100 GB/month ingest. Paid plans are usage-based.
Best for: DevOps teams that want application log monitoring tools tightly integrated with APM and traces for faster root-cause analysis.
Dynatrace
Dynatrace takes an AI-first approach to full-stack observability. Its Davis AI engine automatically correlates logs, metrics, and traces to surface root causes without manual query building, which is a differentiator for large enterprises with complex hybrid environments.
Pros: Automated root-cause analysis. Full-stack observability. Strong for enterprise-scale hybrid environments. AI-driven anomaly detection that reduces MTTR.
Cons: Premium pricing. Can feel opinionated in its workflow. Less flexibility for custom pipeline control compared to open-source or pipeline-first tools.
Pricing: Quote-based. DPS (Dynatrace Platform Subscription) model.
Best for: Large enterprises seeking automated, AI-driven observability that reduces mean time to resolution with minimal manual investigation.
Sumo Logic
Sumo Logic is a cloud-native log analytics and security analytics platform built for multi-cloud environments. Its built-in Cloud SIEM capabilities make it a strong option for enterprises that want combined log monitoring and security analytics without managing separate platforms.
Pros: Cloud-native architecture. Built-in security analytics (Cloud SIEM). Strong multi-cloud support. Real-time dashboards and alerting.
Cons: Can be expensive at high ingest volumes. Query language has a learning curve. Fewer APM-depth features than Datadog or New Relic.
Pricing: Tiered plans based on daily ingest. Free trial available.
Graylog
Graylog is purpose-built for centralized log management, not adapted from a search engine. It emphasizes its search query language and alerting as core features, and Graylog Operations centralizes and aggregates log data for fast search. In security-heavy environments, its built-in SIEM features, access controls, and user management are distinguishing features.
Pros: Purpose-built for log management. Built-in SIEM features. Strong access controls and compliance reporting. Open-source option available.
Cons: Visualization is less polished than Kibana or Grafana. Scaling requires MongoDB and OpenSearch/Elasticsearch backend management. Smaller community than ELK.
Pricing: Open-source is free. Graylog Operations and Security editions offer tiered pricing.
Best for: Security and compliance-focused monitoring teams, especially those needing security log management solutions that meet PCI-DSS and similar frameworks.
SigNoz
SigNoz positions itself as an OpenTelemetry-first open-source alternative to commercial observability platforms. It offers unified logs, traces, and metrics in one platform, with AI Log Pattern Analysis that automatically groups similar errors and alerts users to new exceptions not seen in previous deployments.
Pros: OpenTelemetry-native. Unified logs, metrics, and traces. AI pattern grouping. Open-source with self-hosted and cloud options. No vendor lock-in.
Cons: Smaller ecosystem than Elastic or Datadog. Enterprise support is newer. Self-hosted requires ClickHouse operational knowledge.
Pricing: Open-source is free for self-hosted. SigNoz Cloud offers usage-based pricing.
Loggly
Loggly is aimed at cloud-centric log management and analytics for teams that value simplicity. Its fast setup, intuitive search, and cloud-based architecture let you go from zero to first insights in minutes without managing infrastructure.
Pros: Fast setup. Intuitive search and dashboards. Cloud-based with no infrastructure to manage. Good for application logging and tailing.
Cons: Limited multi-signal correlation. Less suited for high-volume enterprise workloads. Fewer compliance features than Splunk or Graylog.
Pricing: Free tier available. Paid plans start at approximately $79/month.
SolarWinds Papertrail
Papertrail is built for speed and simplicity. It excels at real-time log tailing and search, with setup that takes minutes via syslog, HTTP, or a lightweight agent. For network operations teams that need to monitor syslog data from routers, switches, and firewalls, Papertrail delivers immediate value at a low price point.
Pros: Real-time tail and search. Extremely fast setup. Affordable for low-volume use. Good for syslog monitoring from network devices.
Cons: Limited dashboarding and analytics. Not designed for compliance retention. Lacks APM or trace correlation.
Pricing: Free plan with 50 MB/month. Paid plans start from approximately $7/month.
Mezmo
Mezmo takes a pipeline-first approach, focusing on parsing, enriching, and routing logs before they reach storage or analytics destinations. For teams with high-volume log streams, this pre-processing step can meaningfully reduce downstream costs and improve query performance.
Pros: Pipeline-focused parsing, enrichment, and routing. Helps reduce downstream storage costs. Supports multiple output destinations.
Cons: Not a full observability platform. Visualization and alerting are limited compared to Datadog or Splunk. Smaller market presence.
Pricing: Usage-based. Contact for enterprise pricing.
Best for: Teams with high-volume log pipelines that need pre-processing and routing before data reaches SIEM or analytics platforms.
Worth noting: Cribl Stream offers robust pipeline capabilities with broader ecosystem support, more destinations, and additional data transformation features allowing a more complete telemetry strategy. If pipeline control is a priority, compare both before committing.
SolarWinds Observability
Pros: Unified view across logs, metrics, traces, network, and database performance. Strong for hybrid IT environments. Familiar brand for network-centric teams.
Cons: Less depth in log-specific analytics compared to Splunk or Elastic. May require additional SolarWinds products for full coverage.
Pricing: Subscription-based. Contact for enterprise pricing.
Best for: IT operations teams already using SolarWinds products who want to add log monitoring within a familiar unified platform.
No single tool dominates every column. The most resilient enterprise architectures combine a pipeline and routing layer with one or more analytics destinations. This approach helps control costs, avoid vendor lock-in, and adapt as needs change.
Key trade-offs to weigh include manageability versus control (managed SaaS vs. self-hosting), query and index cost versus storage efficiency, and feature depth versus price. Your optimal stack depends on which trade-offs align with your team's priorities.
How to choose log monitoring tools
Picking a log monitoring platform is not about chasing the longest feature list. It is about matching the tool to your log volume, retention needs, query patterns, team expertise, and compliance requirements. Selection criteria across industry sources consistently emphasize ingestion speed, real-time alerting, dashboarding, AI/ML-assisted detection, OpenTelemetry integration, deployment model, and total cost of ownership.
Before you shortlist any platform, walk through this evaluation flow:
Quantify daily log volume and growth trajectory. Know your baseline and where it is heading. A tool that handles 50 GB/day gracefully may buckle at 5 TB/day.
Map compliance and retention requirements. PCI DSS 10.7 calls for retaining security logs for at least one year, with three months immediately available for analysis. HIPAA and SOX carry their own mandates.
Inventory existing tooling. Document your current SIEM, APM, and cloud-native logging services. IDC reports that more than 80% of enterprises use multiple monitoring or observability tools, and that sprawl creates integration and cost-management challenges.
Define query patterns. Are you doing real-time tailing, forensic deep dives, or dashboard-driven monitoring? Each pattern favors different architectures.
Assess team expertise and operational capacity. Self-hosted Elasticsearch demands cluster management skills. A managed SaaS platform trades control for convenience.
Evaluate total cost of ownership. Factor in storage, egress, licensing, and the hidden cost of maintaining infrastructure. The cheapest sticker price rarely stays the cheapest in production.
Key selection criteria for enterprises
Decision-makers need a clear lens for comparing platforms. Here are the dimensions that matter most.
Matching tools to specific use cases and environments
Not every tool fits every scenario. The table below maps common enterprise use cases to the right tool category and key considerations, so you can jump directly to the sections most relevant to your environment.
Evaluate expected log volumes, retention, query patterns, and operational expertise before committing. The most resilient architectures separate the pipeline from the analytics, giving you the freedom to swap or add destinations as your needs change.
Recommendations for different enterprise needs
Security and compliance-focused monitoring
For teams where threat detection speed and regulatory compliance are non-negotiable, Splunk and Graylog lead the pack. Splunk's Enterprise Security module delivers full SIEM capabilities, while Graylog's built-in SIEM features, access controls, and user management make it a strong fit for compliance-heavy environments. NIST emphasizes that log management is essential for detecting incidents, troubleshooting, and compliance, providing a retrospective record of events.
Pair either platform with Cribl Stream to filter, enrich, and route security-relevant logs to the SIEM while sending lower-priority data to Cribl Lake for cost-effective compliance retention. This helps you meet PCI-DSS 10.7 retention requirements without paying SIEM-tier storage prices for every byte.
Cost-effective and scalable log storage
The pipeline-first approach is the biggest lever for reducing log monitoring costs. Use Cribl Stream to filter noise, reduce data volume, and route only high-value logs to expensive analytics tiers. Store raw data in Cribl Lake for search-in-place retrieval at a fraction of SIEM storage costs. Observability pipelines can cut costs by filtering and aggregating data before storage, and this principle applies whether your destination is Splunk, Datadog, or a cloud data lake.
Grafana Loki is another cost-conscious choice for teams with Kubernetes-heavy workloads, where metadata-only indexing reduces storage overhead. The self-managed Elastic Stack offers cost control too, but requires operational expertise to run well at scale.
Cloud-native and Kubernetes-friendly monitoring
Kubernetes logs are ephemeral because containers are short-lived, which means you need a central log store that captures everything before pods disappear. Grafana Loki is often the primary log aggregation layer here, paired with Grafana dashboards and Prometheus metrics.
SigNoz is a good choice for teams committed to an OpenTelemetry-first architecture who want unified observability without commercial lock-in. Cribl Stream supports OpenTelemetry natively, so it can route Kubernetes logs to any destination, giving you flexibility as your stack changes.
Unified observability and AI-assisted analytics
Datadog, New Relic, and Dynatrace are leading unified observability platforms with AI capabilities that reduce mean time to resolution. Datadog excels in microservice environments. New Relic offers a generous free tier and strong APM-to-logs correlation. Dynatrace's Davis AI automates root-cause analysis with minimal manual investigation.
The caveat is cost at scale. Using Cribl Stream as a data optimization layer in front of these platforms helps control ingest costs while preserving full observability. Send the signal, not the noise.
Why you should choose Cribl for log monitoring
Every log monitoring tool in this guide solves a piece of the puzzle. Cribl solves the problem underneath all of them: getting the right data to the right tool, at the right cost, without giving up control or flexibility.
Most enterprises have a data routing problem. Logs pile up from dozens of sources, get ingested in full into expensive analytics platforms, and teams end up paying for noise they never query. Cribl's Data Engine for IT and Security sits between your sources and destinations, letting you decide what to collect, how to transform it, and where to send it, before a single byte hits your SIEM or analytics tier.
Teams using Cribl Stream alongside Splunk, Datadog, or Elastic routinely reduce ingest costs by filtering low-value data, sampling repetitive events, and routing only what matters to premium analytics. The rest goes to Cribl Lake, where it stays searchable, compliant, and retrievable on demand at a fraction of the cost.
Here is what makes Cribl the right foundation for your log monitoring strategy:
No lock-in. Cribl routes data to any destination simultaneously. Swap tools, add destinations, or migrate SIEMs without losing a single event or starting from scratch.
Full data fidelity. Cribl Lake preserves every byte of raw telemetry. You meet compliance retention requirements without paying analytics-tier prices for data you rarely touch.
Telemetry usable by AI. Cribl Search gives your team and your AI agents one unified search experience across ingested and federated data, with plain-language queries and investigation-ready workflows built in.
OpenTelemetry-native. Cribl Stream ingests and routes OTel data natively, so your investment in modern instrumentation standards is protected as your stack evolves.
Proven at enterprise scale. Half the Fortune 100 trust Cribl to manage their telemetry pipelines across cloud, on-premises, and hybrid environments.
A free tier that delivers real value. Cribl Stream is free up to 1 TB/day, so you can start reducing costs and gaining control without a procurement cycle.
The best log monitoring stack is not the one with the most features. It is the one where every tool gets exactly the data it needs, nothing more and nothing less. Cribl makes that possible, regardless of which analytics platforms, SIEMs, or cloud environments you are running today or plan to adopt tomorrow.
Log Monitoring FAQs
Which log monitoring tools scale best for very high log volumes?
Enterprise-grade platforms are proven at terabyte-scale daily ingest. IBM notes that advanced log management can handle terabytes of logs per day, and organizations at scale may process billions of log events daily. For organizations that need to manage costs at those volumes, a telemetry pipeline layer like Cribl Stream can filter and route data before it reaches analytics, ensuring scalability without runaway spending.
How do log monitoring tools support hybrid and multi-cloud environments?
The best log monitoring tools provide centralized visibility across AWS, Azure, Google Cloud, and on-premises systems. AWS CloudWatch Logs, Google Cloud Logging, and Azure Monitor each handle their respective clouds well, but a vendor-agnostic pipeline ensures data from any environment reaches the right destination without lock-in.
What level of control do these tools offer over log data pipelines?
Control varies widely. Some platforms handle ingestion opaquely, while dedicated data engineering tools like Cribl Stream let teams define routing, filtering, enrichment, masking, and forwarding rules at the pipeline level. Full pipeline control is essential for reducing costs and maintaining data fidelity across multiple analytics destinations.
Can log monitoring platforms reduce storage and SIEM costs without compromising security?
Yes. By filtering noisy or low-value data before ingestion, applying tiered retention policies, and storing raw logs in cost-effective data lakes for on-demand retrieval, enterprises can significantly reduce SIEM and storage costs while preserving full forensic and compliance value. Cribl Lake is designed for this scenario.
How quickly can enterprises expect to realize value from these tools?
Time to value depends on deployment complexity, but many modern log monitoring platforms offer guided installs, pre-built dashboards, and sandbox environments that deliver first insights within hours. Pipeline-based tools like Cribl Stream can show cost savings from day one by optimizing data flow before it reaches analytics destinations.