
Observability vs monitoring vs telemetry: what do they actually do?
These three terms are interconnected, but each has its own job. Swap one for another and you risk buying the wrong tool for the wrong problem. Let's break them down.
What is observability?
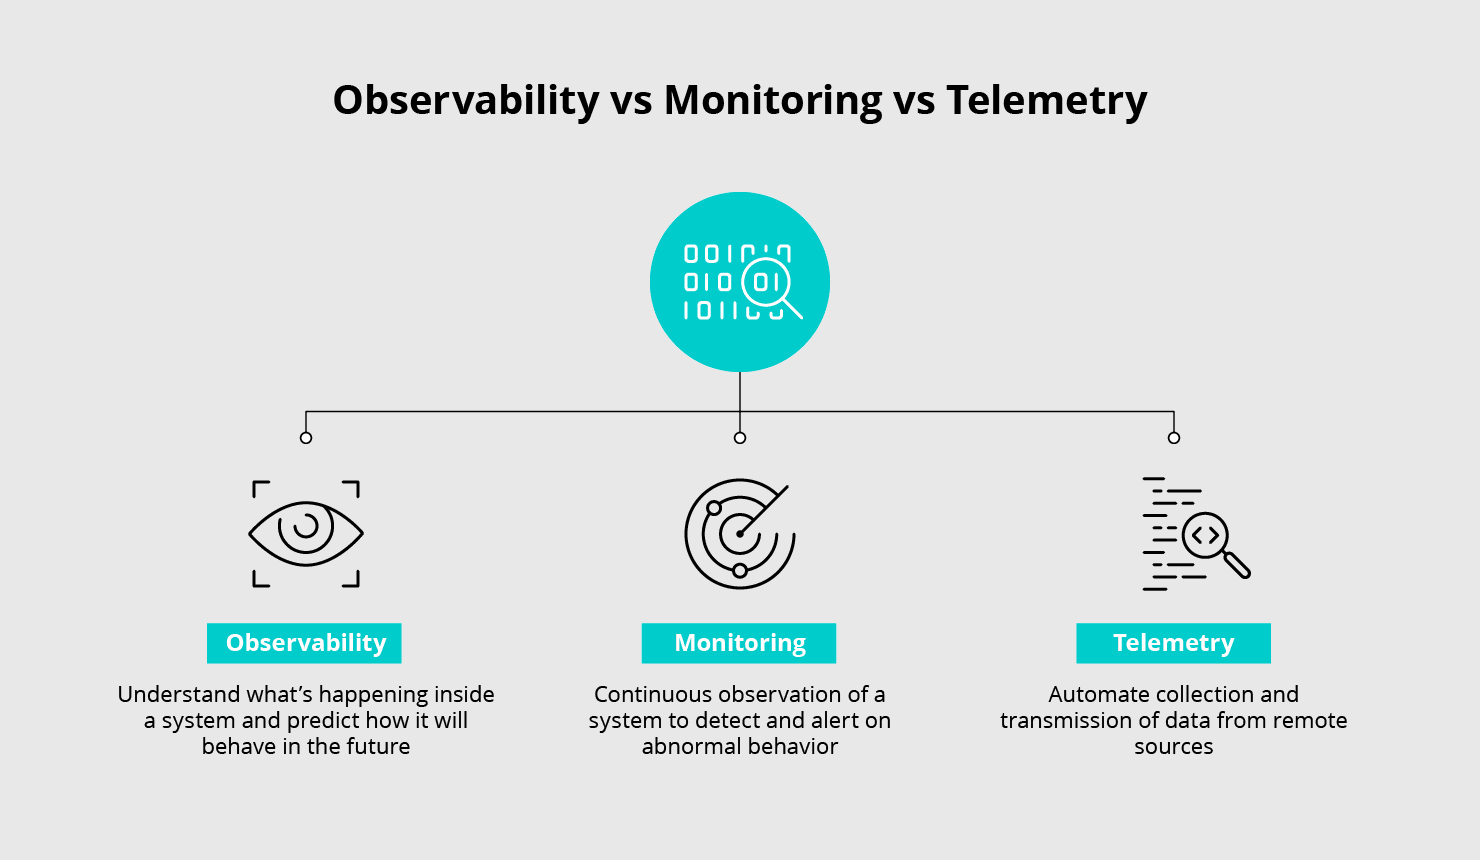
Observability answers the question, "What's going on inside the system?" To be observable, a system must produce enough data and make it available to operators or observability tools. When it does, IT and DevOps teams can pinpoint where a problem lives without opening a war room or running tests all night.
An observable system lets you understand its current state, predict future behavior, and diagnose problems when they occur. That happens through logs, metrics, traces, and other data outputs. Observability tooling typically includes log aggregators, metrics platforms, distributed tracing systems, and log collection and analysis platforms. These tools collect and analyze data from across your stack, giving you insight into internal state and behavior.
One nuance matters: observability is about discovery. It is how you find signals you did not know to look for. That makes it important for modern distributed systems, but it is not the same as monitoring or telemetry.
What is monitoring?
Monitoring is the continuous observation of a system to detect and alert on abnormal behavior. It answers the question, "Is the system working correctly?" To monitor anything, you first have to define what "correct" means, then set up alerts or notifications for when the system deviates from that definition.
Monitoring is a proactive approach. It catches problems early so you can act before they become critical, keeping the system available and performing as expected. Monitoring tools include alerting systems and application performance management (APM) platforms. They watch a system continuously and notify operators when specific conditions are met.
Monitoring covers the things you already know to watch for. That is both its strength and its limit, and it explains why monitoring is distinct from observability and telemetry.
What is telemetry?
Telemetry is the automated collection and transmission of data from remote sources. It answers the question, "What's happening on the ground?" Telemetry has roots in monitoring equipment in hard-to-reach or hazardous environments, such as aircraft, satellites, and oil rigs. Sensors and other devices capture data and transmit it over a network to a central location for analysis and storage.
The same idea applies in IT. Industrial control systems and Internet of Things (IoT) platforms are classic telemetry examples, and so are the agents and collectors that pull logs, metrics, and traces from your servers, containers, and cloud services. Telemetry data supports performance monitoring, asset tracking, predictive maintenance, and security analytics.
Telemetry has grown in recent years, largely because of the OpenTelemetry project. OpenTelemetry created a standardized, vendor-neutral approach to collecting logs, metrics, and traces from distributed systems. That standardization made it easier to collect and analyze telemetry data without rewriting instrumentation for every tool. It has also driven renewed interest in telemetry as the foundation of performance management.
When should you use observability, monitoring, or telemetry?
You need all three, for different jobs. Here are some guidelines:
Use observability when you need to diagnose problems and understand the root cause of issues, especially ones you have never seen before.
Use monitoring to confirm a system is working correctly and to trigger corrective action when it is not. Monitoring is your early warning system.
Use telemetry whenever you need to collect and transmit data from remote sources, whether that is an oil rig sensor or a Kubernetes node. Telemetry is what makes the other two possible.
How do telemetry, observability, and monitoring fit together?
Telemetry is the foundation, monitoring is the alarm, and observability is the investigation. Together they form a complete approach to running IT systems.
Telemetry collects the raw material: metrics, logs, and traces from every source across your environment. That data feeds both monitoring and observability.
Monitoring uses telemetry data to track system health and performance against predefined metrics and alerts. It gives you a high-level view of system status and fast detection of anomalies, answering, "Is the system working correctly?"
Observability uses the same telemetry data to dig deeper into system internals and behavior. It enables detailed analysis and troubleshooting to identify root causes, answering, "Why is the system behaving this way?"
A useful model is the OODA loop: Observe, Orient, Decide, Act. Observability covers the Observe and Orient steps, where you discover new or unexpected signals. Monitoring covers Decide and Act, where you automate responses to conditions you know about. We cover this framing in The Strategic Importance of Observability.
One caveat: if your telemetry layer is brittle, siloed, or locked to a single vendor, everything built on top of it inherits those problems. The telemetry layer deserves as much design attention as your dashboards.
How do you choose the right observability and monitoring tools?
Start with your requirements, not the vendor demo. These seven factors will help:
System requirements: Assess the complexity and scale of your environment. Distributed systems need tools that handle rich telemetry and advanced analytics.
Data needs: Identify the data you actually need to collect. If detailed logs, metrics, and traces are required, choose tools that support that telemetry.
Integration capabilities: Make sure tools integrate cleanly with your existing infrastructure and each other. Compatibility with open standards like OpenTelemetry reduces the risk of vendor lock-in.
User interface: Look for clear dashboards and visualizations that make data easier to interpret and act on.
Scalability: Choose tools that grow with your system and handle rising data volumes without degrading performance.
Alerting and automation: Effective monitoring tools offer strong alerting and automation so you can address issues before users notice.
Cost: Evaluate cost-effectiveness against your budget. Balance feature set with affordability, and pay attention to ingest-based pricing.
That last point deserves emphasis. Telemetry growth is outpacing budgets in many organizations, and the median annual spend on a single observability platform now exceeds $800,000, according to Cribl's 2026 trends and predictions report, 2025. Evaluate these factors carefully so you can select observability and monitoring tools that fit both your needs and your budget.
Three concepts, one data strategy
Observability, monitoring, and telemetry are essential for keeping modern distributed systems performing and reliable. Understand the differences, know when to use each, and you can manage every layer of your IT environment, from applications down to infrastructure. Treat these practices as a connected system rather than three separate purchases.
Get the telemetry layer right, and everything above it gets easier
Every observability and monitoring tool runs on telemetry. If that data arrives noisy, duplicated, in the wrong format, or trapped inside one vendor's agent, your dashboards and alerts inherit the problem. Cribl is a platform for telemetry that aims to address that layer. Built on the Data Engine for IT and Security, Cribl provides a vendor-agnostic hub to collect, transform, route, and store telemetry across sources, tools, clouds, and SIEMs, without vendor lock-in, without data loss, and without compromises.
Here is what that looks like in practice. Cribl Edge collects logs and metrics at the source across Linux, Windows, and Kubernetes, with centralized fleet management to reduce agent overhead. Cribl Stream acts as a telemetry pipeline where you filter out noise, convert chatty logs into metrics, enrich events with context, mask sensitive fields, and route the same data to multiple monitoring and observability tools. Stream speaks OpenTelemetry natively, so OTLP logs, metrics, and traces flow through the same pipeline as your syslog and cloud audit data. Cribl Lake stores full-fidelity telemetry in open formats at lower cost, ready to replay into any tool when an investigation requires it. And Cribl Search lets you investigate data where it lives, across Lake, object storage, and the edge, without rehydrating it into your most expensive platform first.
The result is that you can choose observability and monitoring tools on merit, not on which vendor happens to own your agents. Want to test a new APM platform, migrate a SIEM, or tier infrequently used data to cheaper storage? Change a routing rule, not your entire collection layer. Half of the Fortune 100 already rely on that approach.
Telemetry is the signal for your practitioners and the fuel for your agents. Make sure you control it. Spin up a free Cribl.Cloud account and process up to 1TB a day, no license required, to see how your monitoring and observability stack can simplify when the underlying data is under your control.
Observability vs Monitoring vs Telemetry FAQs
What is the difference between observability, monitoring, and telemetry?
Telemetry is the automated collection and transmission of data (logs, metrics, traces) from remote sources. Monitoring continuously evaluates that data against predefined thresholds and alerts you when it deviates. Observability uses the same data to understand a system's internal state and diagnose the root cause of issues, including problems you never anticipated.
Is telemetry the same as monitoring?
No. Telemetry is the raw material: the data collected from servers, applications, network devices, and sensors. Monitoring is one way you use that data: by defining what "correct" looks like and alerting when the system drifts from it. Without telemetry, there is nothing to monitor, but telemetry alone does not tell you whether a system is healthy.
Does observability replace monitoring?
No. You need both. Monitoring handles known conditions; it detects issues you already understand and triggers a fast response. Observability addresses unknown issues; it lets you discover new signals and determine root cause.
Why has OpenTelemetry made telemetry more important?
OpenTelemetry created a standardized, vendor-neutral way to collect logs, metrics, and traces from distributed systems. That means you can instrument once and send data to any compatible backend instead of rewriting collection for every tool. Standardization has made telemetry a common base for monitoring and observability, and it reduces vendor lock-in.
How do I choose the right observability and monitoring tools?
Where does Cribl fit in observability vs monitoring vs telemetry?
Cribl operates at the telemetry layer that feeds every monitoring and observability tool. Cribl Edge collects data at the source, Cribl Stream filters, enriches, and routes it to any destination, Cribl Lake stores full-fidelity data in open formats, and Cribl Search lets you investigate data where it lives. You keep your existing tools and gain control over what data reaches each one.