Introduction
Security teams get comfortable with their model vendor's compliance API: point it at the org, pull the activity log, pipe it to the SIEM, done.
Then someone finds half the company's actual usage runs through a cloud marketplace or a self-hosted deployment, and that compliance API has nothing on it. Anthropic customers hit this with Bedrock and Vertex; OpenAI customers hit it with Azure OpenAI. The vendor changes, the gap doesn't.
This piece works through Claude as the deep example, since the pattern holds regardless of model. Enterprises pick Bedrock or Vertex for a cloud perimeter they already govern, or for procurement and residency requirements, trading away the single-pane compliance view. Their cloud provider's telemetry tells a more complete story than it looks, assembled from four such places instead of one API call.
Incomplete compliance is non-compliance. Security teams need full visibility into model usage, regardless of how those models are invoked. This paper will demonstrate how, as with traditional telemetry, the solution is to collect compliance data across all sources in a cost-effective manner and stitch them into a single pipeline, and how Cribl fits at every step.
Why does the compliance API stop at the tenant boundary?
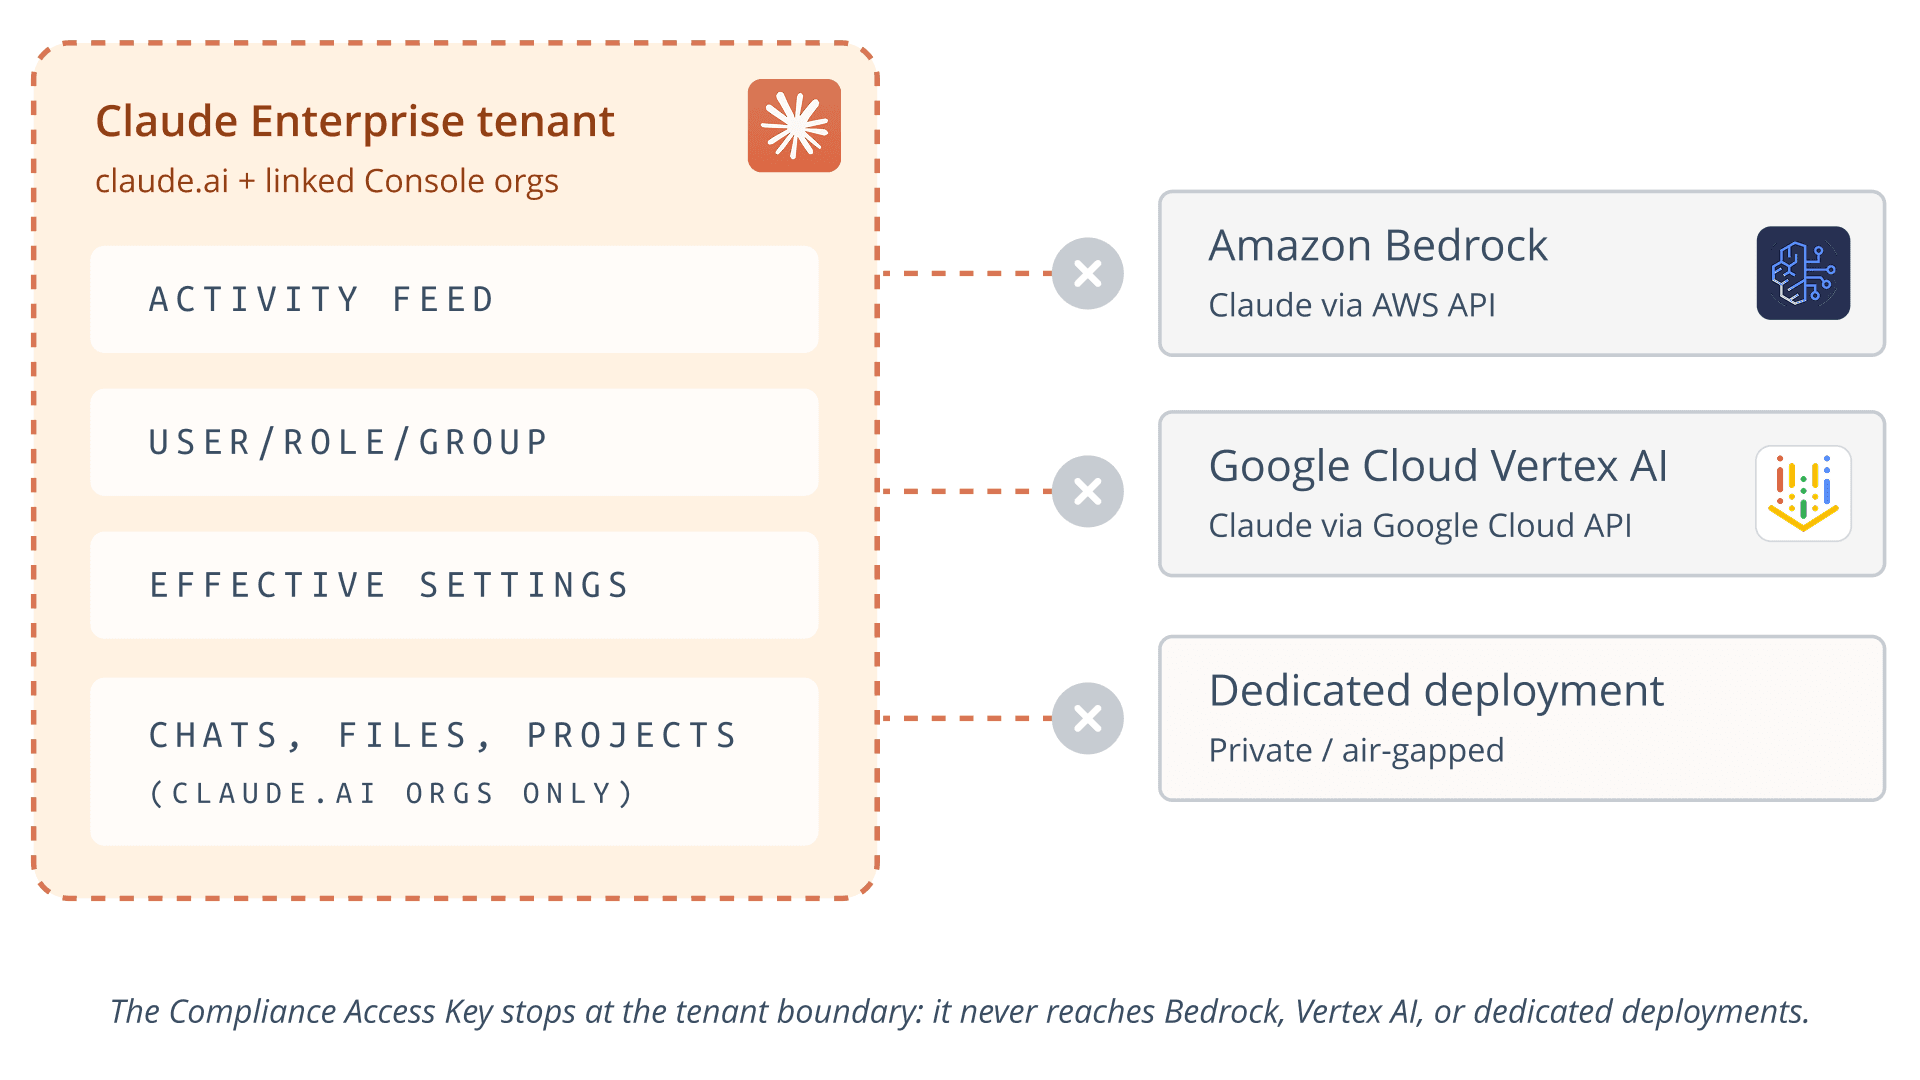
The Compliance API gives Claude Enterprise customers programmatic access to the Activity Feed, the user/role/group directory, and effective settings. For claude.ai orgs, it also covers the underlying chats, files, and projects. Every endpoint sits under /v1/compliance/* on api.anthropic.com.
Bedrock and Vertex traffic never hits that surface. A Bedrock call goes through AWS's API, bills through AWS, and logs through AWS-native services if enabled; Vertex works the same way on Google Cloud. The request never touches api.anthropic.com, so there's no Activity Feed entry. Same logic for dedicated or air-gapped deployments: no tenant, no record.
Anthropic's audit-log CSV export doesn't help either. It's claude.ai-only, with a capped lookback window. Outside the tenant, both compliance surfaces are blind.
Other vendors draw the same line. OpenAI's Enterprise Compliance Logs Platform covers ChatGPT Enterprise/Edu activity. It doesn't reach Azure OpenAI Service or self-hosted traffic, for the same structural reason.
How Cribl helps:
One telemetry layer, any vendor. Cribl's AI Platform for Telemetry treats compliance-API traffic, marketplace logging, and dedicated-deployment traffic the same way, regardless of model vendor.
Built for AI telemetry, not repurposed for it. The Cribl AI Observability app, in development, gives security and compliance teams one place to search, investigate, and report on AI activity.
No new collection infrastructure. Teams already running Cribl Stream can extend it to cover Claude traffic outside the tenant boundary, no new vendor required.
Where should you collect LLM telemetry instead?
1. OpenTelemetry, straight from the source
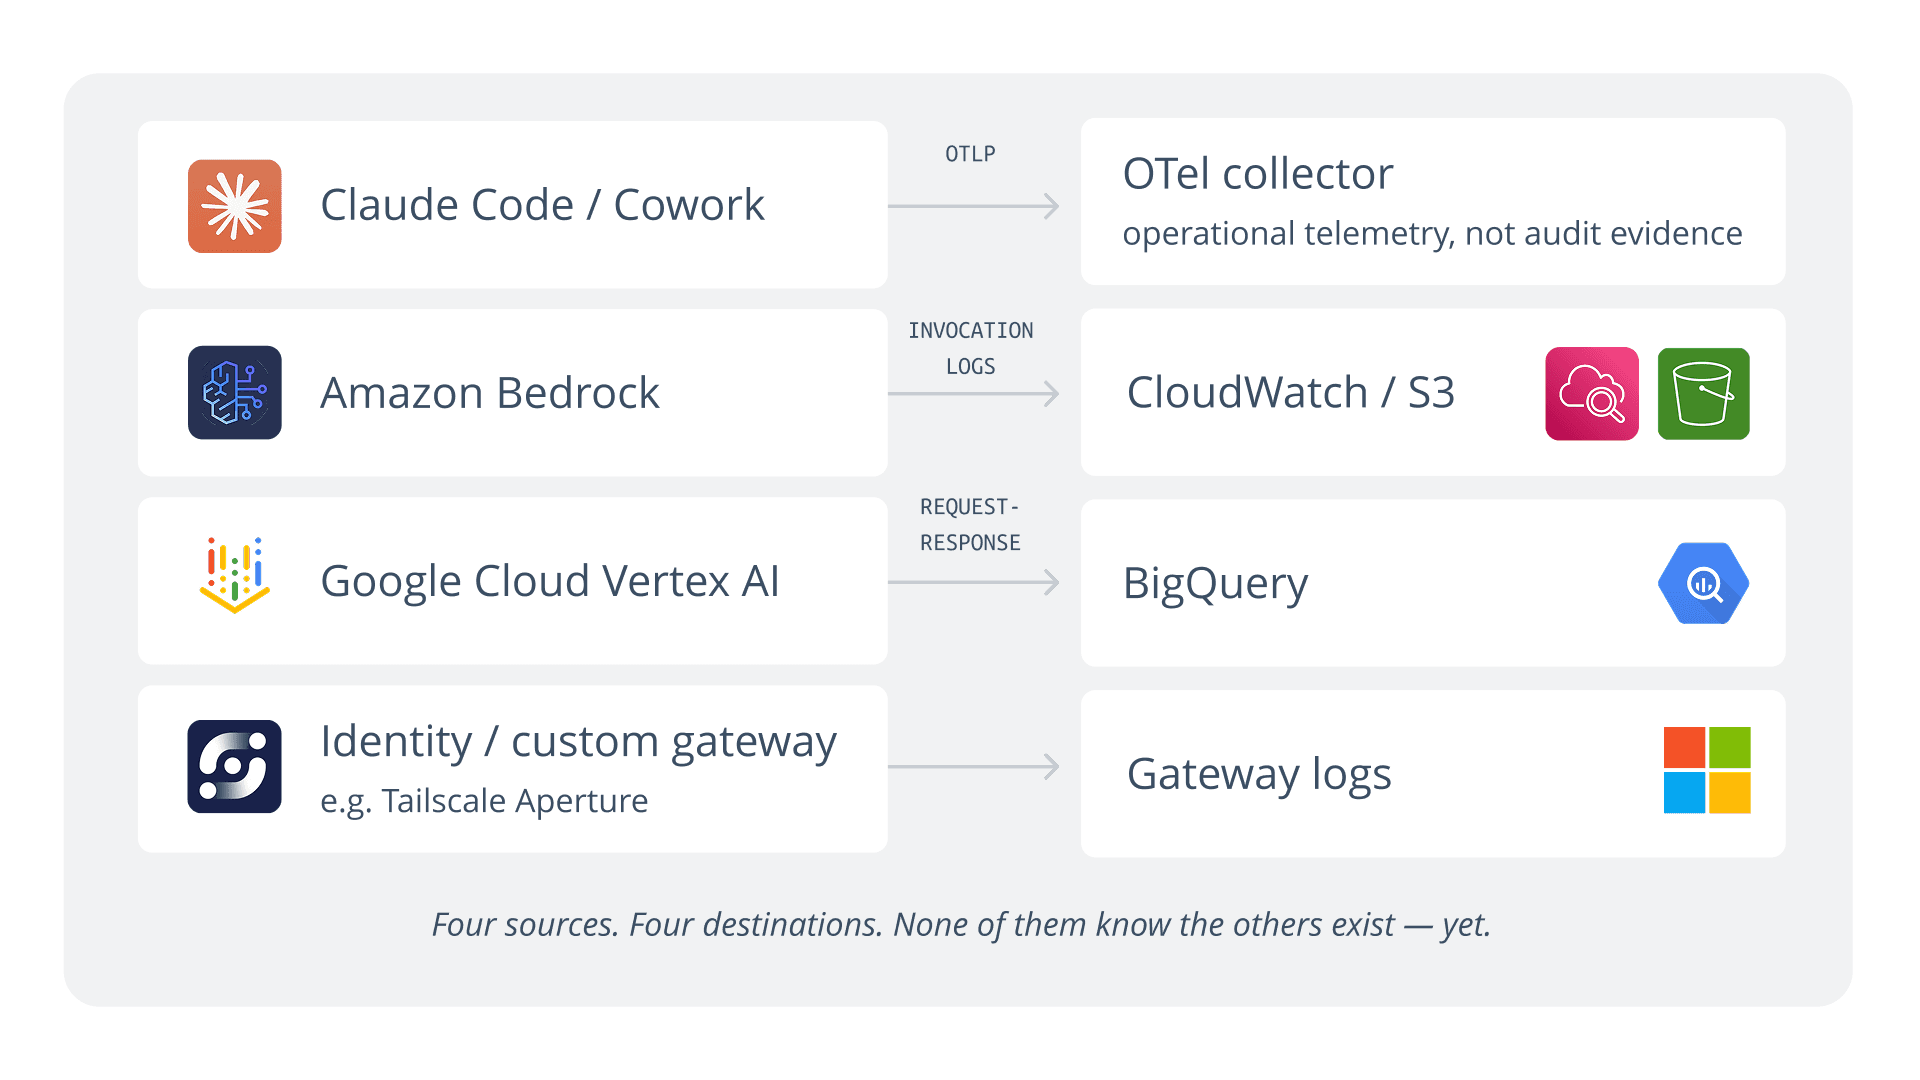
Claude Code and Claude Cowork each emit usage and audit telemetry over OpenTelemetry (OTLP), instrumented at the client layer rather than Anthropic's tenant. It runs independent of the Compliance API, regardless of which backend serves the model.
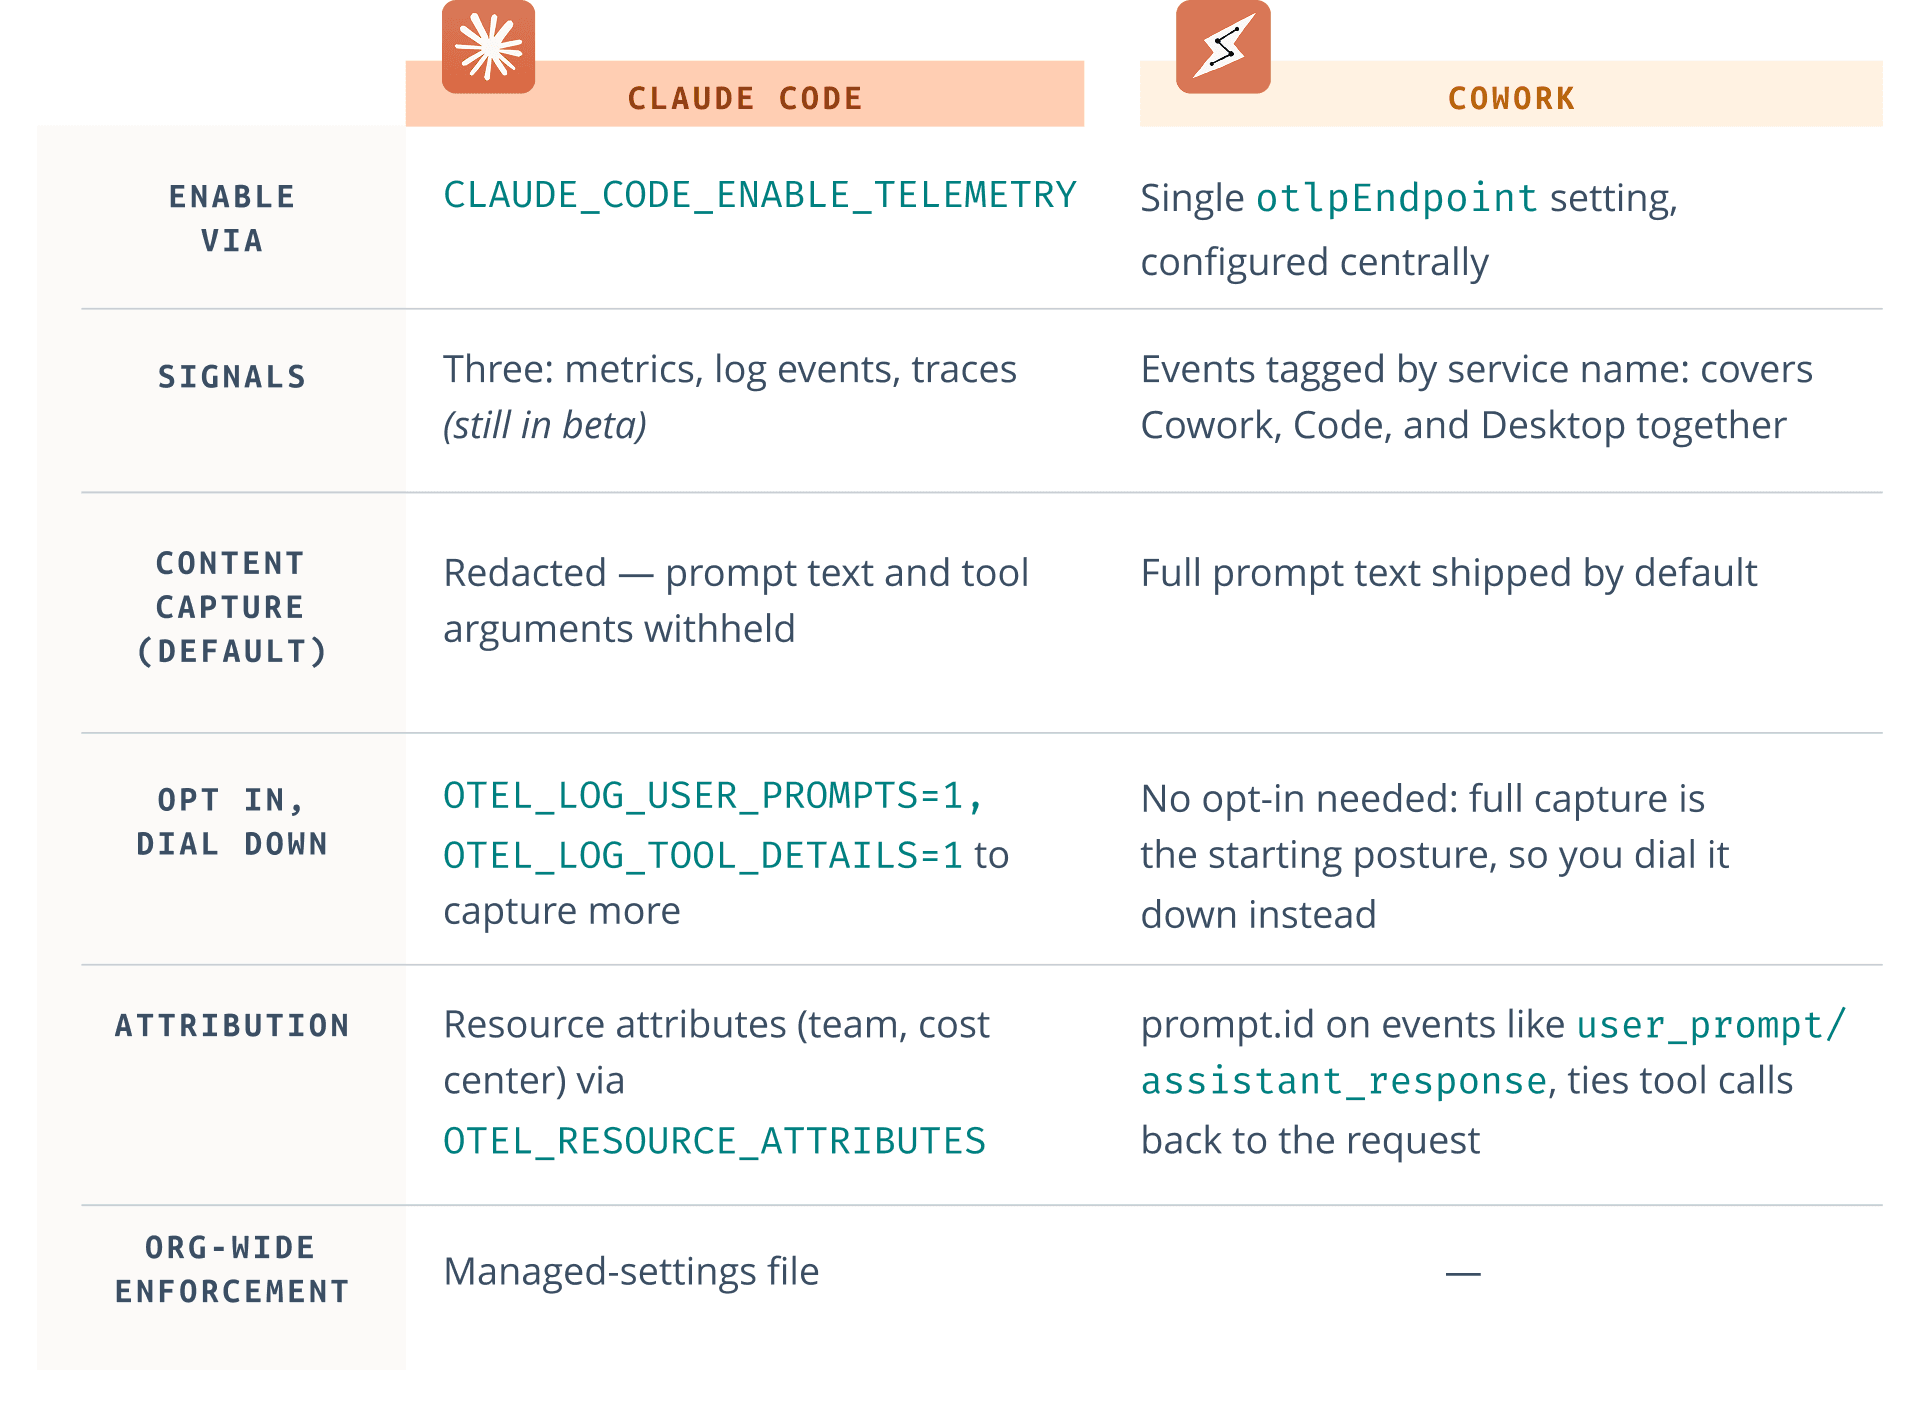
WATCH THIS - Cowork's export always goes out over HTTP to the configured endpoint, even if
otlpProtocolis set togrpc. Point it at a gRPC-only receiver, and telemetry silently never arrives.
One distinction matters here: this OTel stream is operational telemetry, not a formal audit trail. It's built for monitoring, not for satisfying a SOC 2 or HIPAA auditor the way the Compliance API's Activity Feed does. It lacks the same retention guarantees or content-deletion mechanics. Check your own vendor's scope before assuming this gap is universal. OpenAI, for one, already folds Codex usage logs into its Compliance Logs Platform.
2. Your cloud provider's native logging
This replaces what the Compliance API gave you for request/response visibility. Both major clouds support it; neither turns it on by default.
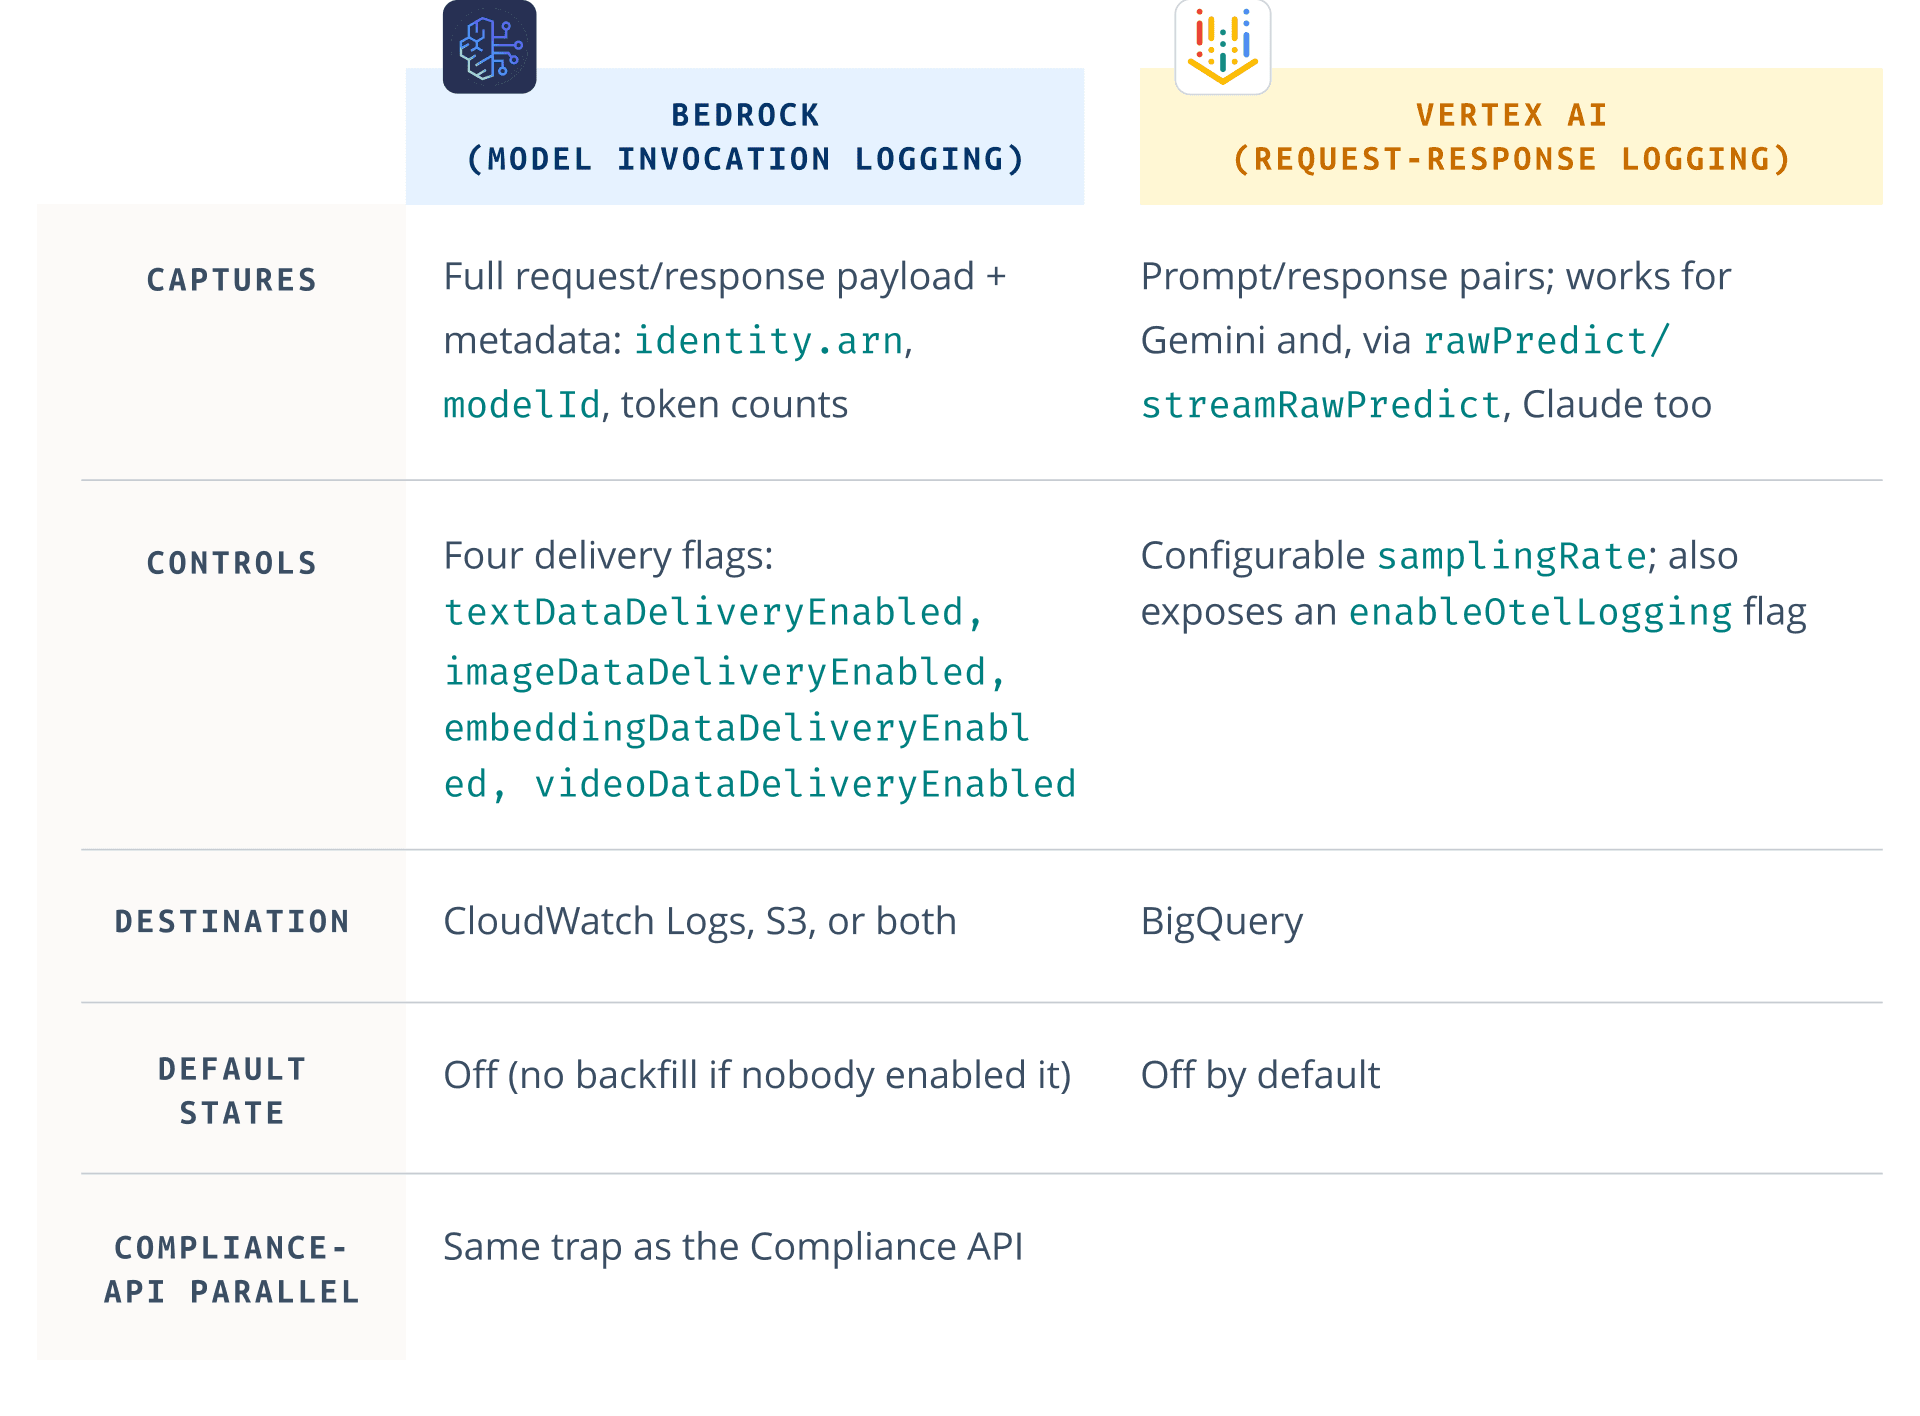
Neither cloud's logging replaces the Compliance API's content-retrieval or deletion endpoints. But for "who did what, with which model, when," it gets you most of the way there.
3. A gateway you control, as the fallback
If native logging isn't available, put your own proxy or gateway in front of the traffic and log at that layer. It's more overhead and only sees what passes through it, but it's the most vendor-agnostic option by construction.
This is also where purpose-built AI gateways fit. Tailscale's Aperture, for example, proxies between LLM clients and upstream providers: OpenAI, Anthropic, Google, self-hosted. It uses Tailscale identity instead of distributed API keys, logging every request by caller, model, and vendor. Useful for a mixed estate, but still in early access; validate before relying on it as a control.
How Cribl helps:
Pre-built sources for every route. Cribl Stream ships native sources for S3, Kinesis, CloudWatch Logs, Pub/Sub, and OTLP: the exact destinations Bedrock, Vertex, and Claude Code/Cowork already log to.
Edge collection where it's needed. Cribl Edge can sit close to distributed OTel emitters, including Claude Code on developer laptops, forwarding centrally without a fleet of manually managed exporters.
Guided onboarding, one collection layer. A setup wizard configures what's needed or reuses what's running, so security, FinOps, and AI engineering draw from one dataset instead of separate pipelines.
How should you size an AI telemetry pipeline?
Know what you're signing up for first. The rule of thumb: a single LLM call generates 8 to 15 spans against 2 to 3 for a typical API call. A multi-step agent run can throw 40 to 75 spans for one interaction. Vendors add that up to a claim of 10 to 50 times more telemetry than a traditional app.
That figure counts spans, not bytes, and bytes are what your bill tracks. A redacted span (Claude Code's default) might carry 300 bytes; a span with full prompt and completion text can run 50 to 100 times heavier. Customer-reported numbers push past even that ceiling. Long-running agentic sessions, where history and tool payloads stack up turn over turn, have logged as high as 200 KB in one turn.
What drives a turn to 200 KB:
Conversation history, resent every turn. Chat completions are stateless, so most requests carry the entire prior conversation. By turn ten, the new content might be 500 bytes, but the logged payload is the whole thread.
System prompts, tool schemas, and tool results. Agentic frameworks add a system prompt and tool schemas to every call. A file read, git diff, or search result can each add 10 to 50 KB.
Multiple spans counted as one "turn." If "one turn" really means the whole agent loop, several spans get summed into it: inference, tool calls, retrieval.
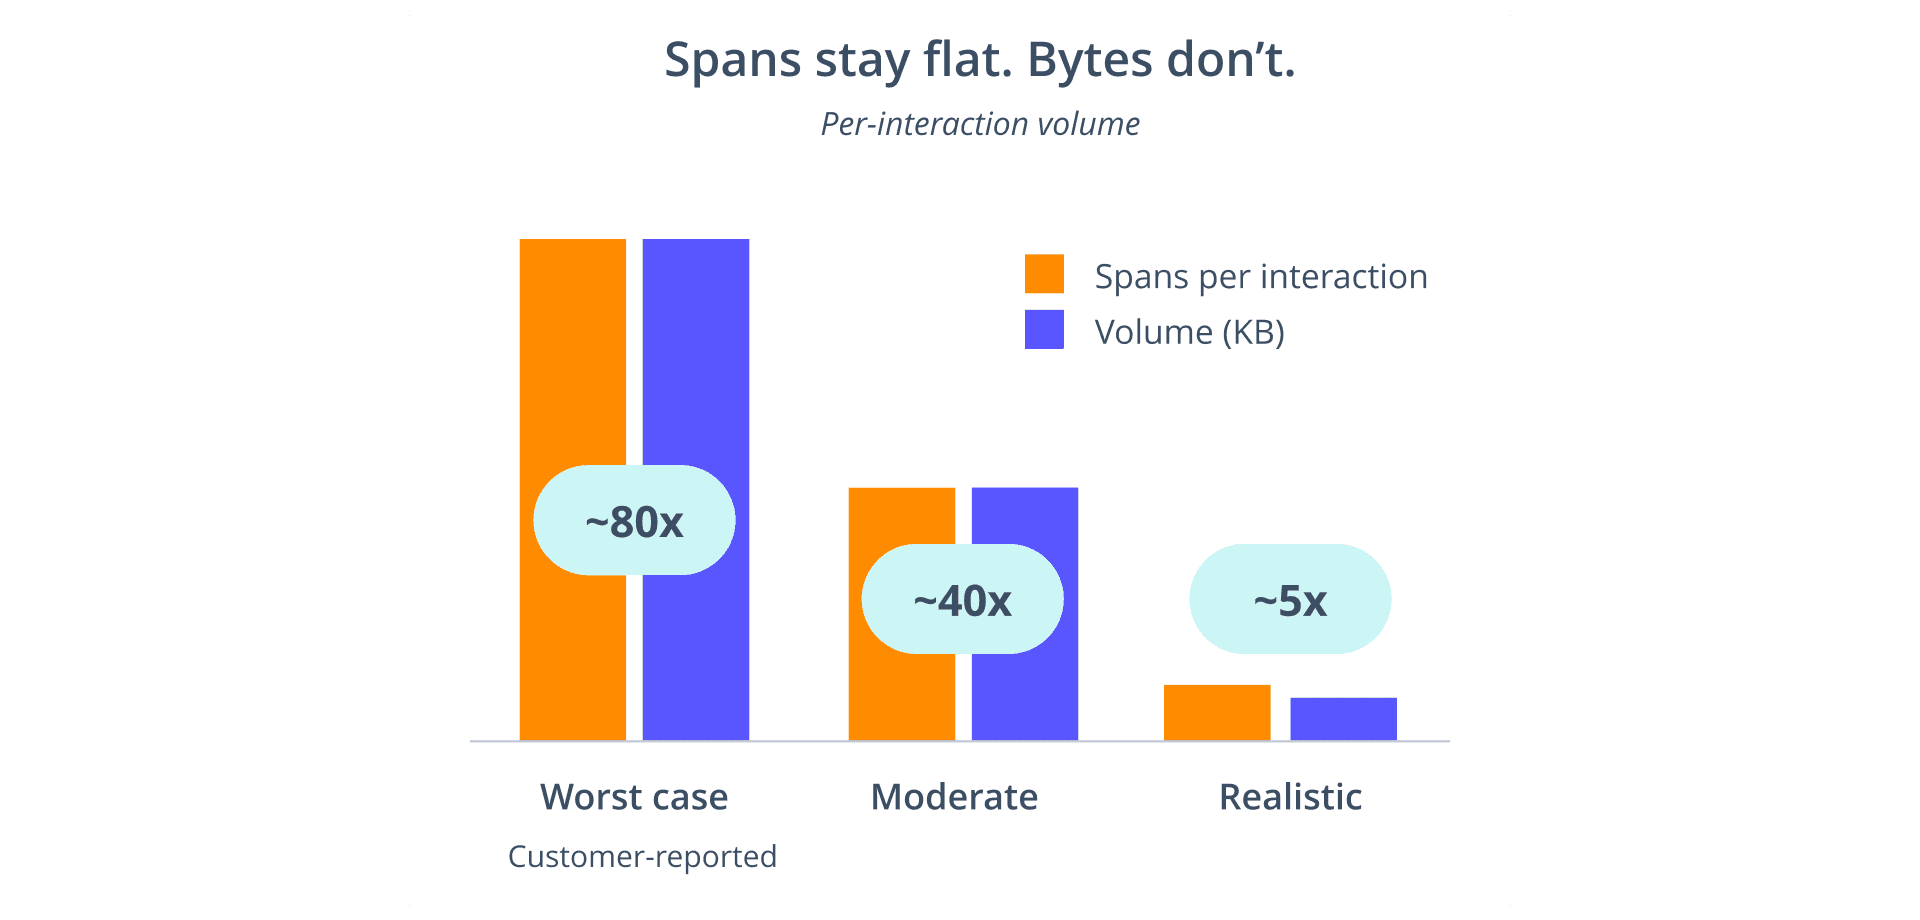
Simple, single-turn calls without tools look nothing like this: low single-digit KB. If 200 KB looks like your floor rather than your ceiling, check traffic type, whether history's included, and whether full capture is on.
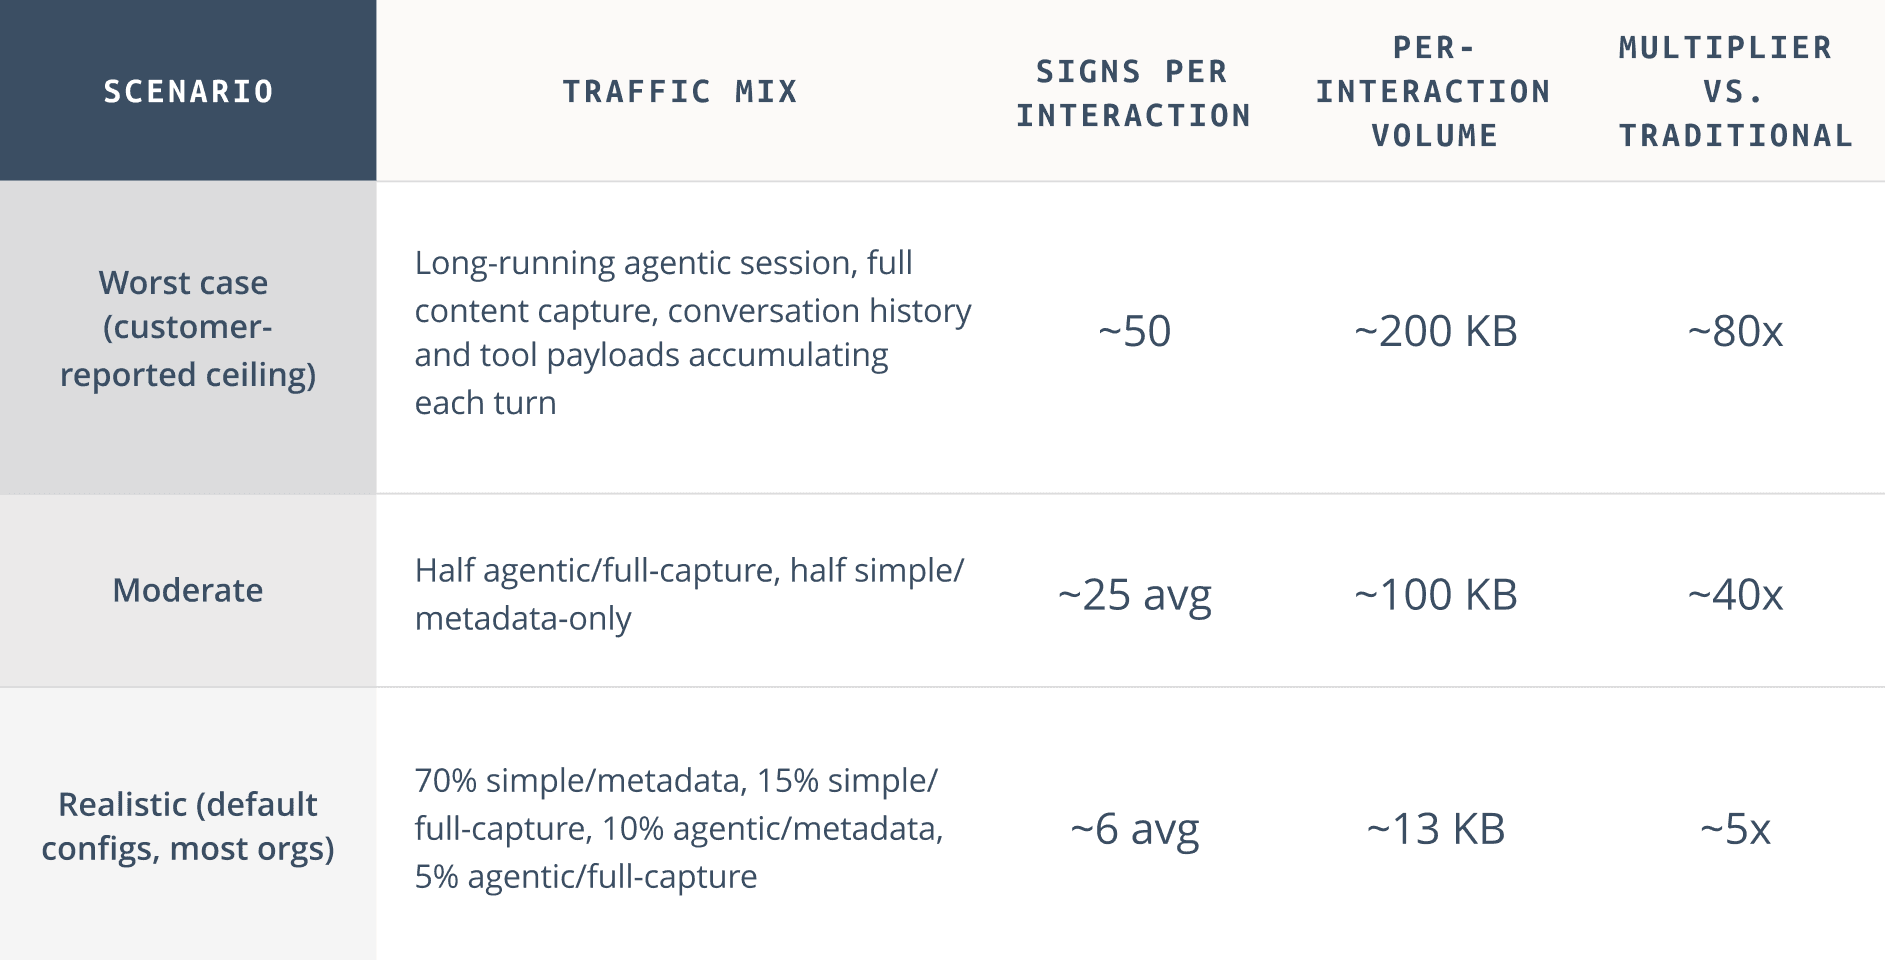
The same math, run three ways, against a 2.5-span, 1 KB traditional API call as baseline. Treat this as an illustrative model, not measured data. Swap in your own numbers before sizing anything real.
How Cribl helps:
Reduce before you store. Cribl Stream filters, samples, and reshapes telemetry in flight, so the worst case above doesn't have to be what lands in a premium backend.
Sensitive content gets caught before storage. Cribl Guard masks PII, credentials, and API keys in prompts and completions before they're written anywhere.
Full-fidelity retention without full-fidelity pricing. Lakehouse Engine storage economics mean keeping complete history doesn't require paying observability-tool rates on every byte.
Cost visibility as a query, not a project. Pre-aggregated cost metrics, enriched with model, team, and workload context, turn "who burned the budget" into a search.
How do you combine multiple telemetry schemas?
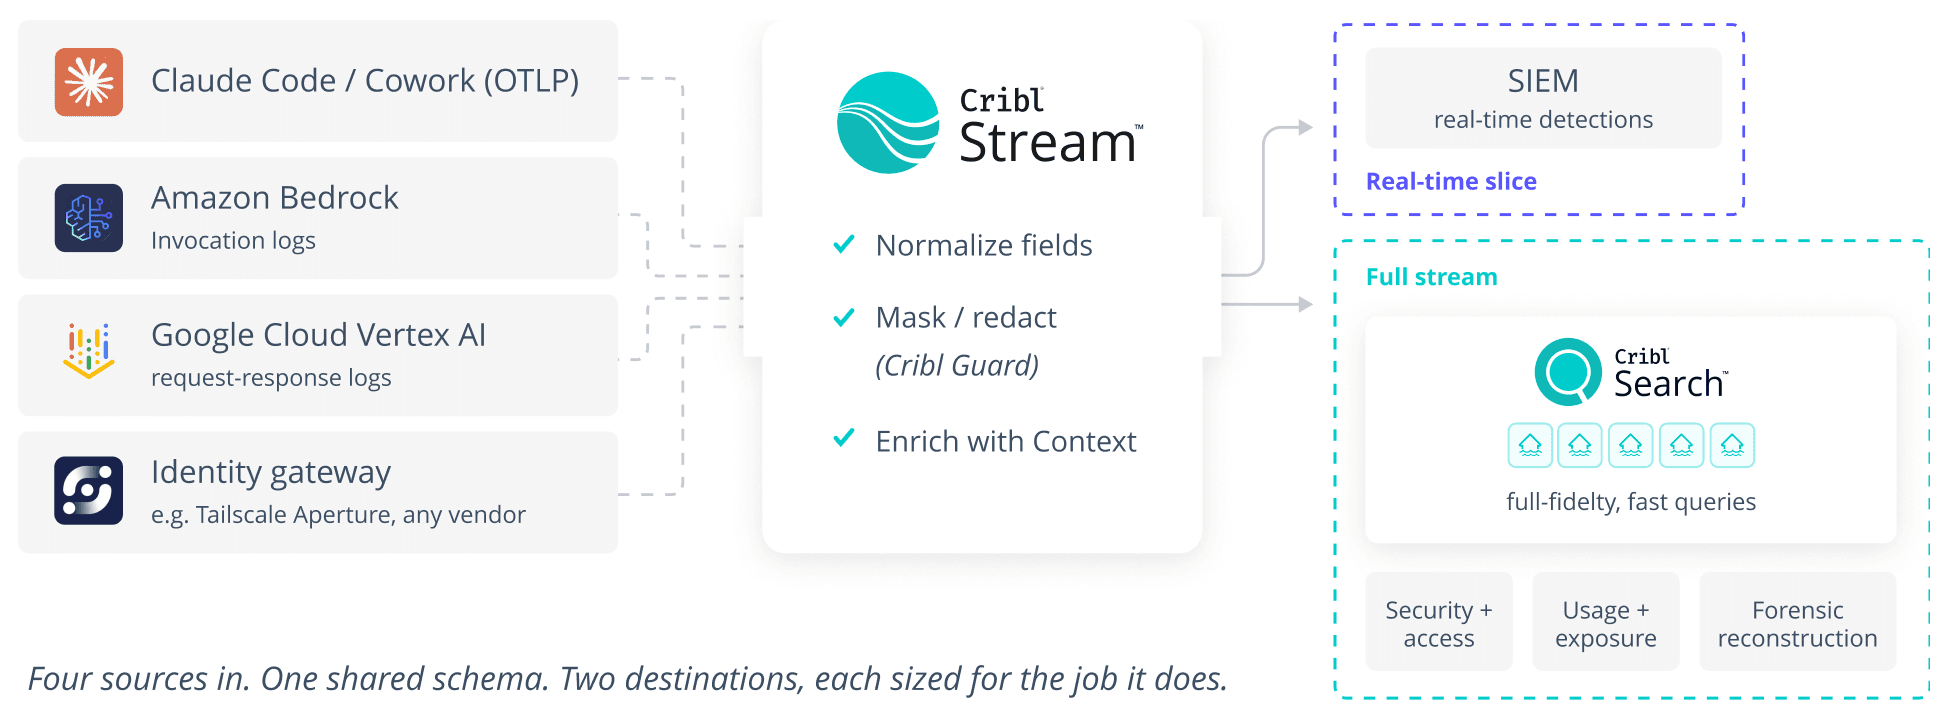
Once OTel, Bedrock, and Vertex logging are all on, you have four schemas and four identity models. You also have three landing zones (CloudWatch/S3, BigQuery, one or more OTLP collectors), none of which know the others exist. Answering "did anyone outside engineering touch customer data through Claude last week" means learning multiple query languages and correlating timestamps by hand.
A stream-processing layer solves this. Ingest Bedrock's logs from S3 or Kinesis. Pull Vertex's Cloud Audit Logs and Cloud Logging exports off Pub/Sub. Take the Claude Code and Cowork OTLP streams natively, all into one pipeline. Normalize the fields you'll query (identity, model, deployment route, tool, approval state, timestamp), mask content where policy requires it, and enrich with business context.
Route the real-time slice to your SIEM for detections that need to fire now. Route the full stream to a storage-plus-compute layer built for fast queries, for everything else. It ingests directly, auto-parses and structures the data, and ages it out on schedule. Queries run faster than a federated scan against raw storage, since the data's already indexed.
Teams typically build three views first. A security and access view: who triggered what, was it approved. A usage and exposure view: which teams and models are most active, which touch sensitive data. A forensic reconstruction view: a 30-to-90-day history on one user or workload.
How Cribl helps:
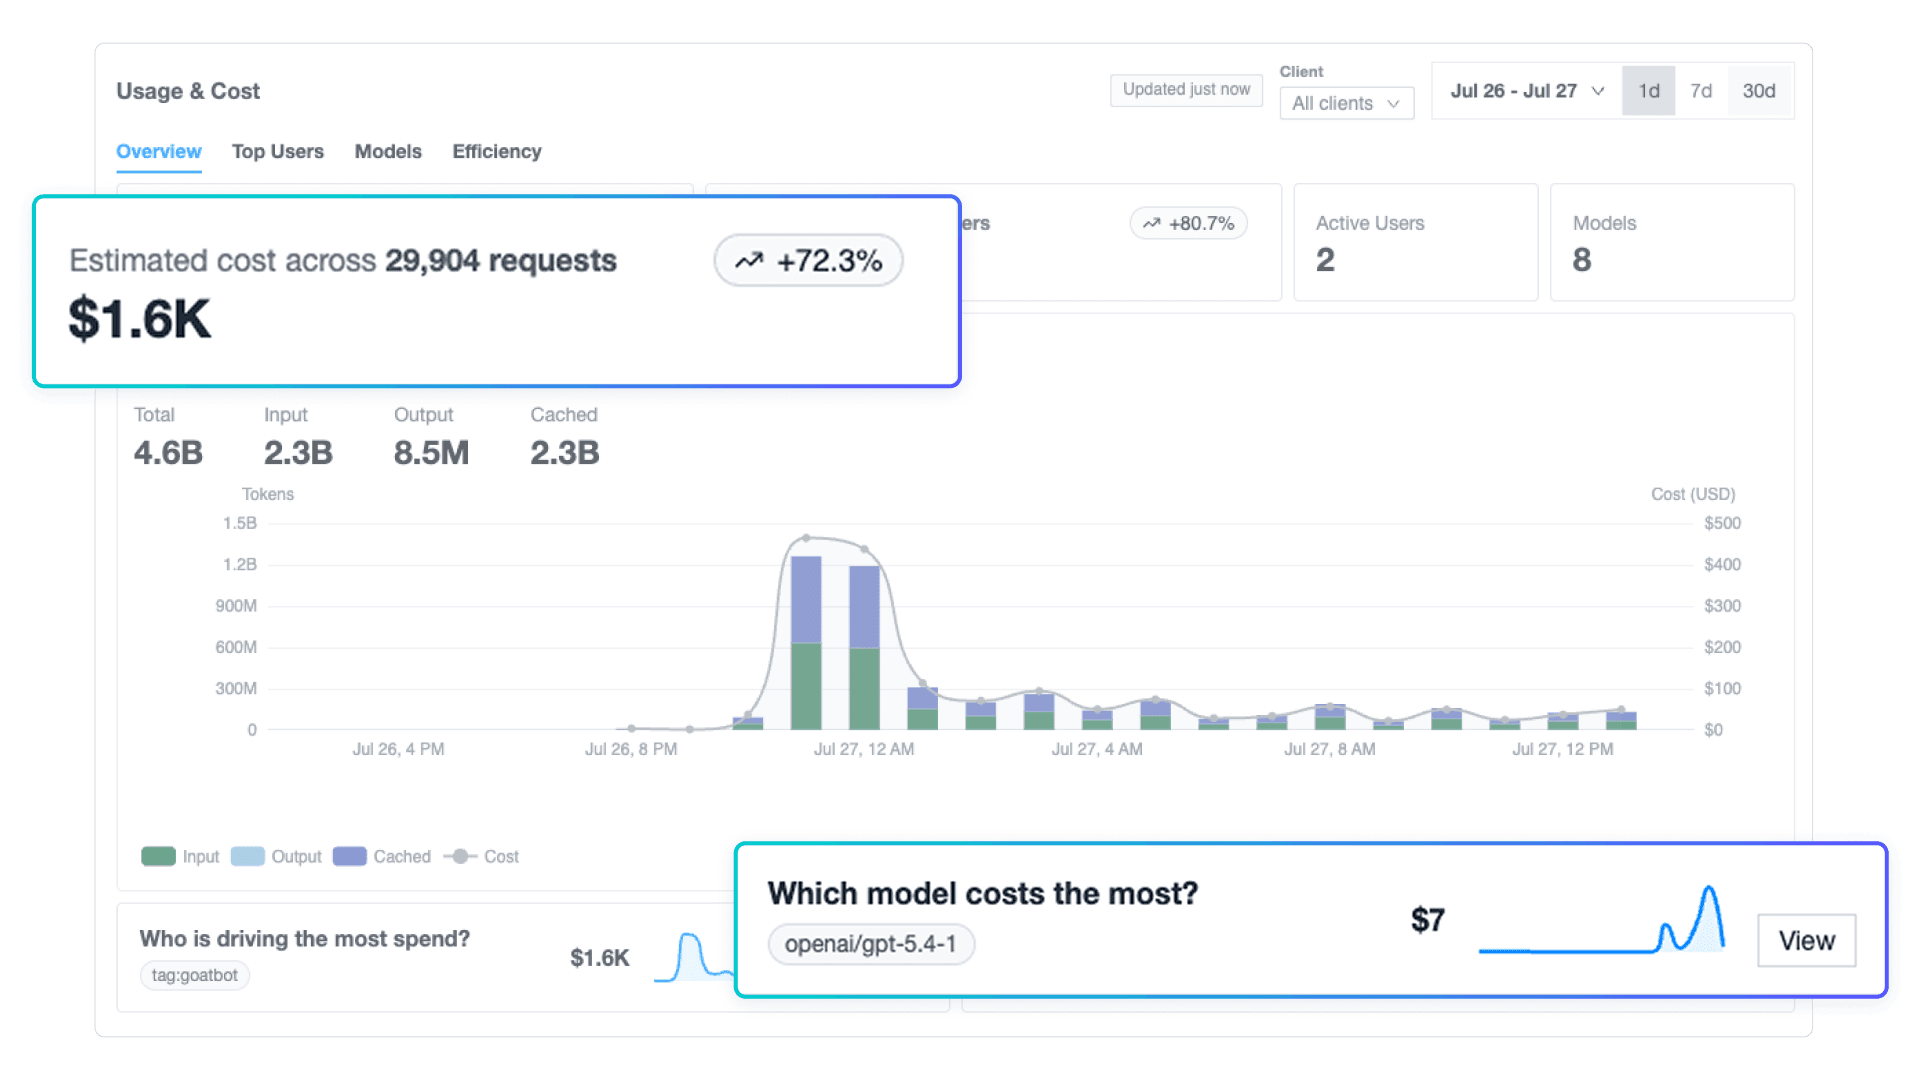
The Cribl AI Observability app. This app gives teams one place to search, investigate, and report on AI telemetry across models, tools, and environments. Built on Cribl's AI Platform for Telemetry, the app lets you collect once, normalize once, protect sensitive data, visualize AI usage, cost, and issues. It lets you dig deep and investigate AI prompts, completion paths, and AI model performance.
Sensitive data detection built for AI traces. It surfaces exactly where PII, credentials, or API keys show up inside a trace, broken down by category, user, model, and tool.
One data layer, no duplicate collection. The same telemetry supports SRE, security, FinOps, and AI engineering views without each team collecting and storing its own copy.
Key takeaways
Before you invest in tools, it's worth understanding why telemetry has to come first: here's what to take away from this guide.
Compliance APIs cannot see LLM traffic routed through Bedrock, Vertex AI, Azure OpenAI, or private deployments.
Combine client-side OpenTelemetry, cloud-native logs, gateway records, and vendor compliance data to close the visibility gap.
Measure model telemetry volume by bytes and content-capture settings rather than by span counts alone.
Cribl helps collect, govern, normalize, route, store, and investigate AI telemetry without locking you into a single model or backend.
The Cribl App for AI Observability gives teams one place to collect, detect sensitive data, investigate, and report on AI telemetry across models, tools, and environments.