
Introduction
Modern application architectures give your engineering teams a lot of agility. They also create a lot of complexity. Telemetry sprawl, blind spots, and constant noise can leave even experienced DevOps engineers and SREs chasing elusive bugs and spending hours on root-cause analysis. MTTR climbs as data hides across silos, and “just one more dashboard” never quite delivers the answers you need.
Cribl, the AI Platform for Telemetry, helps you turn that chaos into a workflow you can trust. We give you one foundation to collect, shape, protect, store, search, and analyze telemetry so both people and AI can work with it. Troubleshooting distributed systems is one of the clearest places to see that value. In this guide, you’ll see how DevOps, observability, SRE, and platform engineering teams use Cribl to reduce troubleshooting time, gain full-chain visibility across services, and resolve incidents faster with less stress and more confidence.
Why troubleshooting modern application environments is so hard
Cloud-native and service-oriented architectures promise scale, agility, and uptime. They also create their own troubleshooting nightmares:
Data fragmentation: Telemetry lives everywhere. It sits in container logs, node-level metrics, traces, and third-party SaaS tools, and rarely arrives in a unified format.
Too many monitoring tools: Teams juggle a cluttered landscape of dashboards, each tuned for one dimension: APM, logs, or network. None show the full story, and everyone has their own version of the truth.
Difficult root-cause isolation: Correlating events across services, clouds, or legacy and modern stacks is a puzzle, slowing root-cause analysis and stretching incident timelines.
Noisy alerting: High-cardinality data and duplicative signals make it hard to prioritize or pinpoint what matters.
Telemetry volume and cost: Data grows quickly, driving up storage, egress, and license costs across observability and security tools.
Cribl’s AI Platform for Telemetry cuts through these problems. Cribl Edge and Cribl Stream put the right telemetry in the right formats at your fingertips, while Cribl Guard, Cribl Search, Cribl Notebooks, and Cribl Lake help you protect sensitive data, investigate faster, and keep what you need for replay and learning.
How Cribl helps: a practical approach
Cribl gives you a troubleshooting pattern you can reuse across environments
Collect telemetry close to the source with Cribl Edge.
Shape, enrich, and route data in motion with Cribl Stream.
Protect sensitive data in real time with Cribl Guard.
Investigate issues faster with Cribl Search and Cribl Notebooks, including AI-assisted summaries.
Retain and replay data with Cribl Lake.
You can run this workflow in your own infrastructure or in Cribl.Cloud as a managed platform, so you spend more time fixing issues and less time wrangling pipelines and agents.
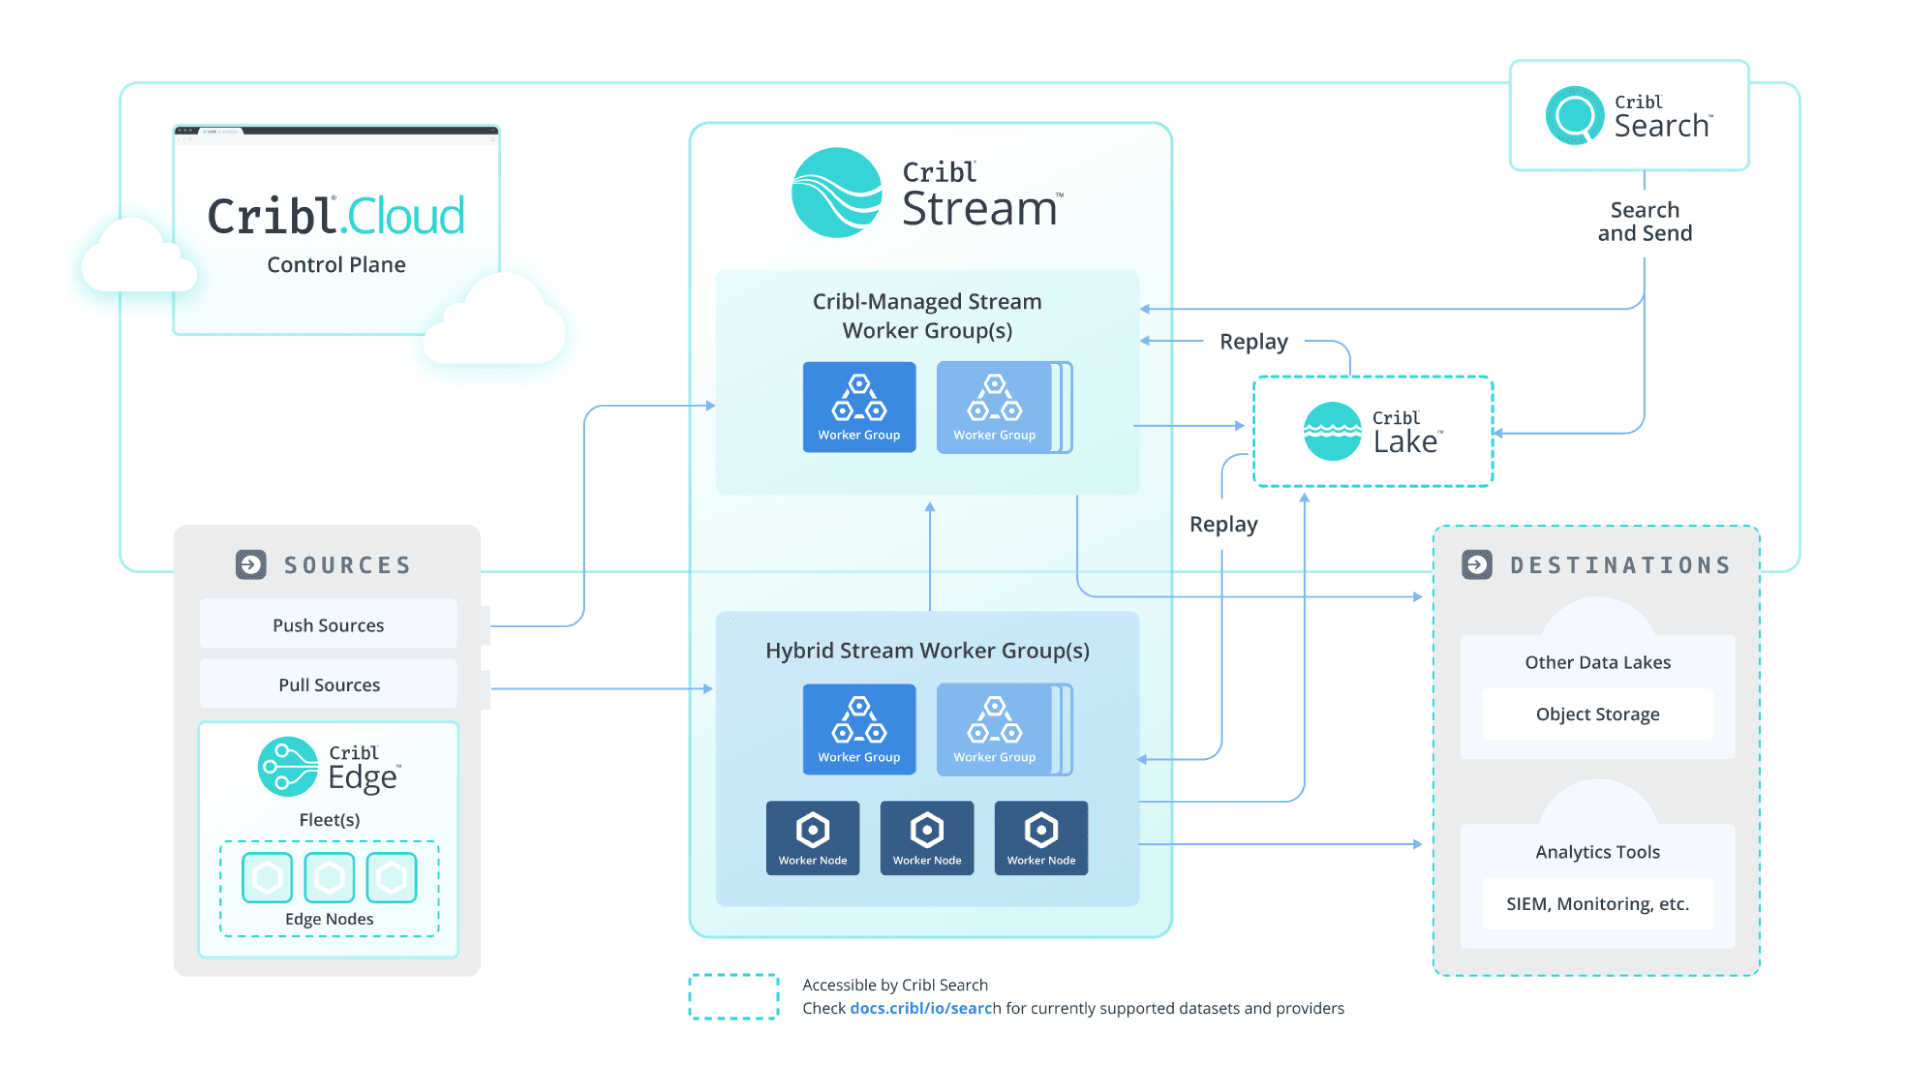
Full-suite reference architecture.
Use Cribl Stream to shape and route telemetry
In complex distributed environments, DevOps and platform teams deal with fragmented data, inconsistent formats, and rising costs from duplicated log ingestion. Cribl Stream is your telemetry engine for centralizing, standardizing, and enriching data flows before they reach downstream analytics or security tools.
Stream acts as a universal receiver, giving you control and flexibility over your telemetry so you can clean, shape, enrich, and route logs, metrics, and traces, regardless of source or destination.
Once Edge and Stream handle collection, normalization, and routing, investigations often move into Cribl Search, Cribl Notebooks, and Cribl Lake. You can use Search to zero in on outliers or anomalies, then pivot to Notebooks for collaborative analysis. You can track queries, add comments, and build a transparent investigation trail. For long-term retention or replay, route artifacts to Lake so your team can revisit, audit, or refine postmortem workflows without rebuilding pipelines.
Here’s how that looks in practice:
Ingest from anywhere
Start by ingesting data from any environment. That could be Kubernetes clusters, cloud platforms, legacy systems, or modern microservices.Reduce volume intelligently
Selectively aggregate, sample, or mask high-volume log streams. This reduces the noise for your analyzers and ensures only relevant, actionable data is processed further.Normalize and enrich telemetry
Using schema mapping and field-level augmentation, bring consistency and context to every log and metric. The AI-powered natural language editor in Cribl automates mappings and enrichments and leaves you with full control to tune results before deployment.Use dynamic routing
Send only critical or regulatory-required telemetry to high-cost analytics tools and push less critical data (for example, debug logs) to affordable long-term storage or data lakes.Drop low-value noise
Drop noisy, low-value events at the pipeline level, such as health checks or redundant debug lines, drastically reducing storage and analytics spend.Enable Replay
Use Replay workflows by storing raw data in neutral formats, allowing you to send it to new destinations at any point, supporting migrations or tool evaluations without any telemetry lock-in.
When an investigation is needed, time is of the essence. Cribl Notebooks gives your team one shared
space to gather, share data, and add context. Once the investigation is complete, Cribl AI helps you generate clear summaries for incident reports, postmortems, and handoffs so teams spend less time writing and more time learning from what happened.

Example
When you troubleshoot across multiple Kubernetes environments, Cribl Stream ingests all cluster logs, enriches events with cluster metadata, filters out non-actionable noise at the source, and routes only actionable or policy-relevant data to SIEM and analysis platforms. You reduce MTTR and data costs while keeping high fidelity and compliance-ready records.
Use Cribl Edge to collect data closer to the source
Distributed environments generate telemetry everywhere: at the node, in the pod, or deep inside your edge compute layer. Relying solely on centralized collection can mean crucial data is lost, delayed, or simply never surfaced in time to prevent outages. Cribl Edge puts lightweight, intelligent data processing as close to the source as possible, dramatically improving both visibility and responsiveness.
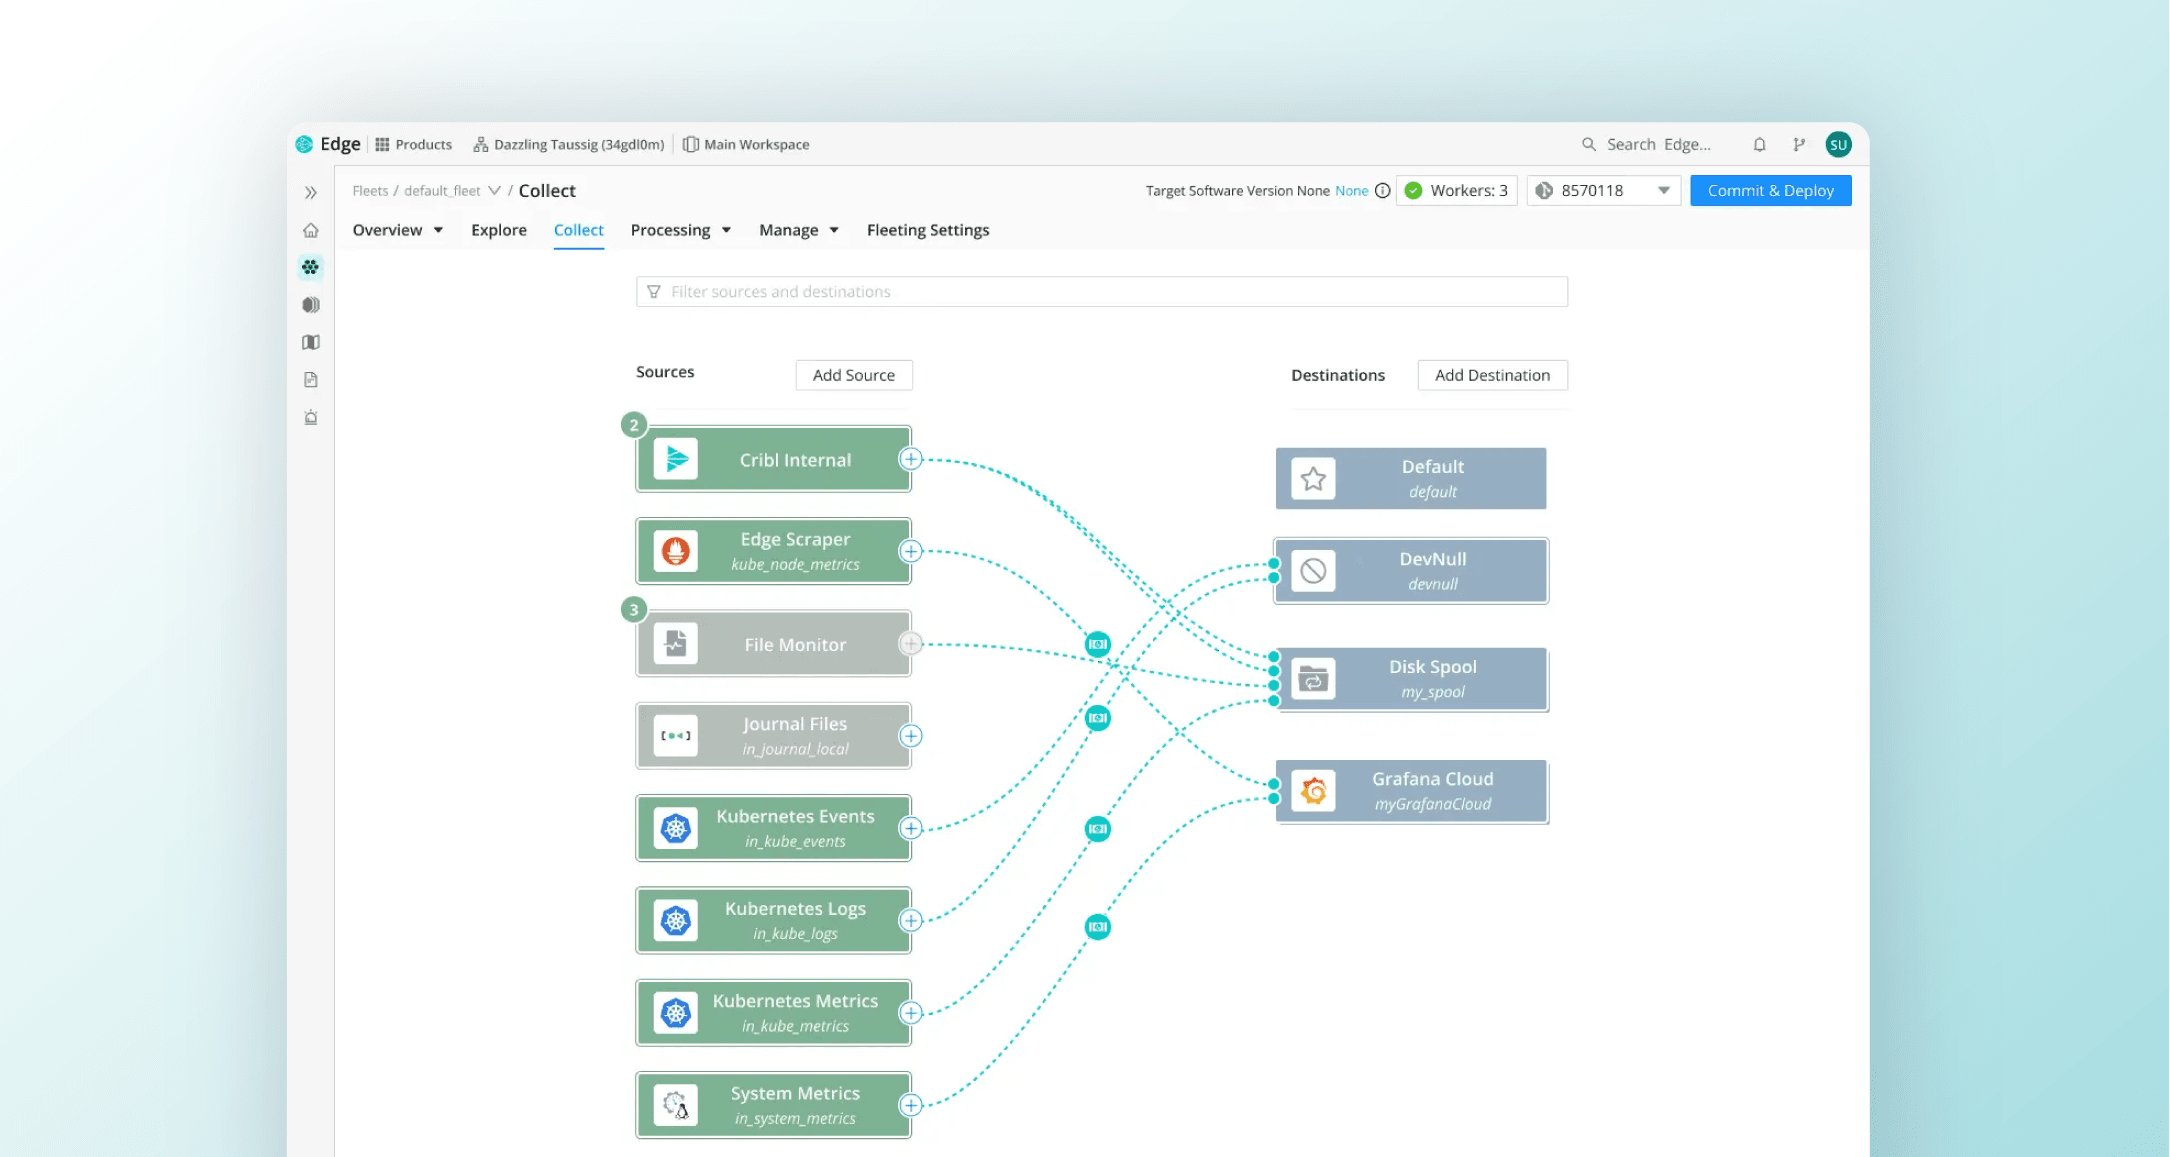
Edge also reduces agent management headaches. You can cut down on vendor-specific agents, simplify deployments across diverse environments, and use Cribl’s latest advances for faster, more reliable agent upgrades and monitoring. Your teams spend less time patching and debugging agents and more time fixing the systems those agents support.
With Edge, you can...
Deploy agents on hosts, containers, or endpoints to capture live telemetry wherever it appears.
Pre-process and enrich data at the point of generation, adding tags like location, service context, or security zone before data leaves the node.
Filter and transform data to suppress superfluous events and send only what matters (anomalies, security incidents, or SLA violations) to central pipelines.
Compress and securely forward relevant data to reduce egress costs and network strain, especially when troubleshooting remote or bandwidth-constrained environments.
Trigger ad-hoc or persistent data captures on specific nodes when incidents emerge, giving SREs immediate insight without waiting for redeployment or reconfiguration.

Example
When you see an intermittent latency spike in a microservice, Cribl Edge collects and streams real-time logs and metrics from the affected edge nodes. Edge tags and shapes that data with context, then routes it to central analysis. Your response team isolates and resolves the root cause with minimal delay and without extra agent wrangling — fewer vendor-specific agents to manage, one place to monitor health and updates, and lower risk from agent bloat or version drift.
Correlate data across layers
Telemetry is most useful when it tells the full story, from application to infrastructure to network.
Cribl helps you correlate data from application logs, infrastructure telemetry, and traces in one workflow so teams move from fragmented signals to unified, actionable context.
At the analysis stage, you use Cribl Search to stitch together events and run targeted queries across systems. You move complex cases into Cribl Notebooks, where you can iterate on hypotheses, annotate findings, and share a single view across teams. Notebooks make it easier to document each step, build shared context, and remove knowledge gaps when collaboration matters most.
Teams gain:
Unified view: Build composite events that span the request path, from the ingress load balancer to the database.
Faster root cause analysis: Stitch together failures across services and infrastructure layers. Cribl Stream’s enrichment and normalization capabilities make cross-source correlation part of your routine instead of a special project.
Lower MTTR: By putting everything you need on a single pane of glass, you move from “what happened?” to “why did it happen?” much faster.
Service-aware enrichment: Shape telemetry data to include service context so teams can prioritize incidents that affect business-critical services and handle less critical issues later.
Real-world scenario: investigating high latency in a microservice
Let’s say you’re responsible for a business-critical retail platform. And let’s also say that customers start reporting slow checkout times (a classic nightmare for teams managing distributed systems). The root cause could sit anywhere: frontend pods, the API tier, databases, network links, or third-party payment services. Your job is to resolve the issue quickly before it affects revenue and customer trust.
Here’s how that journey looks with Cribl’s AI Platform for Telemetry:
Capture data at the source with Cribl Edge
As latency appears, you deploy Edge agents, or use the ones already in place, on the important frontend pods, backend services, and database nodes that support key transaction flows like payments, logins, and onboarding. Edge starts collecting real-time logs, metrics, and traces at the point of activity so you don’t miss early signals, even in ephemeral containers.
You can use the AI-powered natural language editor in Cribl to create and test pipelines before final deployment. This AI support lets junior team members take on work that used to require your most experienced technicians, freeing senior leaders to focus on more complex challenges.Enrich and filter telemetry at the edge
Edge tags events with context like node role, cluster name, and customer region before forwarding them. It filters out routine, non-actionable noise so only relevant latency or error signals move on. You cut chatter and egress costs while keeping the data that matters for troubleshooting.
Aggregate, normalize, and route with Cribl Stream
All edge-collected telemetry converges in Cribl Stream. Stream applies schema mapping and enrichment to unify disparate log formats — for example, turning “user_id,” “customerId,” and “uid” into a single, consistent field. It correlates transactions using request IDs, lines up timestamps across systems, and ties together events across services and data sources.
Cribl Guard’s AI-enabled engine scans data in motion for PII and other sensitive information. Guard masks or deletes offending data so it never reaches long-term storage. Teams can use the natural language editor to define guardrails quickly and adapt them as requirements change.
With Cribl, you route data to observability and security tools, and you can also send “just in case” data to a data lake for future investigations. You keep choice and control without losing important signals.Correlate and analyze across layers
Stream feeds enriched, structured events into your analytics or SIEM platform. Instead of stitching together disconnected logs across tools, your observability stack receives cleaner telemetry with richer context. You get a clearer, end-to-end view of the customer journey in your analytics, APM, or SIEM tools.
Cribl products don’t replace those tools. They cut noise and enrich data so your existing stack works better and delivers deeper insight. With Cribl, you can search across tools and data lakes and build visualizations that highlight exactly when latency spikes. In this example, that might reveal a specific database query in the payment workflow that’s lagging.Validate the fix and close the loop
You tune or update the microservice or query causing the slowdown. As soon as the change goes live, telemetry from Edge and Stream shows, in near real time, that checkout speeds are back to baseline and no new errors have appeared.
You can replay raw data or search historical data with Cribl Search to run extra analysis, build a Notebook for similar future investigations, or export artifacts for post-incident review. Investigation shouldn’t stop at the fix. You use Notebooks to capture the troubleshooting story, highlight lessons learned, and preserve key data points in Lake for compliance, audits, and future learning.
By making each step traceable and reusable, you streamline onboarding for new team members and build a foundation for continuous improvement. Instead of scrambling between dashboards, scripts, and disconnected analytics, Cribl surfaces unified context and streamlines investigations, whether you modernize away from legacy tools or integrate Cribl across the tools you have today.
By aligning edge data collection with central enrichment and correlation, you find the source of latency in minutes instead of hours or days. You cut storage and licensing costs by filtering and routing only necessary data. Customer experience recovers, and your team closes the loop with high confidence and minimal disruption.
Best practices + pro tips

Data sampling
Use Cribl Stream to sample high-volume events (for example, load balancer logs) so you keep statistically relevant data without drowning in noise.

Log enrichment
Augment every event with helpful context (like customer ID, session token, and cloud region) right in the pipeline for faster root cause analysi

Conditional routing
Set logic rules to prioritize critical signals (like security or payment errors) to hot paths, while routing low-priority logs to long-term storage.

Human-in-the-loop AI
Lean on Cribl AI to suggest mappings and filter noisy events, but always review and tune for your unique stack and needs.
Conclusion
Distributed systems don’t have to feel like a mysterious black box. With Cribl, the AI Platform for Telemetry, your teams can work from a clear, repeatable pattern: Edge collects, Stream shapes and routes, Guard protects, Search investigates, Notebooks document and collaborate, and Lake cost-effectively retains. Each step helps you reduce friction, improve collaboration, and future-proof incident response.

Ready to see how Cribl can simplify troubleshooting for your team?
Try our sandboxes and take control of your telemetry today.