

As part of Cribl’s SRE team, we goatfood our own tools. We use Cribl’s suite of products: Stream, Edge, Search, Lake, which work together to deliver all the observability data we need for Cribl.Cloud.
Of course we need
Storage to store the observability data - like S3, Cribl Lake
Query engines - like Cribl Search
Humans (or, nowadays, AI) to build useful queries and dashboards
But if we keep unnecessary data in the above steps, we’d increase the costs of data transfer, storage, computation, human resources, or AI tokens for building queries and dashboards, because we’d have to check/exclude unnecessary data.
Key takeaways
Filter aggressively: Use Drop functions at the Edge to eliminate low-value noise before it hits storage.
Aggregate early: Roll up high-cardinality metrics into meaningful dimensions to save on storage and compute costs.
Sample strategically: Keep the shape of your logs without the full volume using smart sampling.
On-demand data: Disable non-critical jobs and only re-enable them when necessary.
The solution: Efficient data processing
At Cribl, we process the data beforehand. We use Edge to clean up data we don’t need at the moment and transform the data into a shape ready to be consumed downstream. With Stream, we enrich, clean up, aggregate, or transform the data to a final state before we send to any destination.
We can also easily get that data back when needed - minimizing storage, but retaining the flexibility we need for troubleshooting.
Below are the approaches that we use by leveraging Cribl Edge, Stream, and Lake.
Use the “Drop” function to remove unnecessary data
Not all data is created with equal value. We collect using Cribl Edge, and when the data generated are of less value, we drop them at the source. Especially some system logs (mostly debug logs) or redundant metrics, reducing the "data tax" on transferring and downstream pipelines and keeping your Search results clean. If you aren't looking at it during an incident, don't pay to store it.

And because we used Cribl Edge, if we ever find these logs are necessary, we can quickly disable this function and get those logs back right away.
Use the “Sampling” function to reduce the volume of logs
For high-volume logs like debug, trace, and silly logs, sampling them down to 1/1000 or 1/100 is usually enough to understand what is happening to the system, saving us a lot of storage, computation, and human/AI time when troubleshooting.
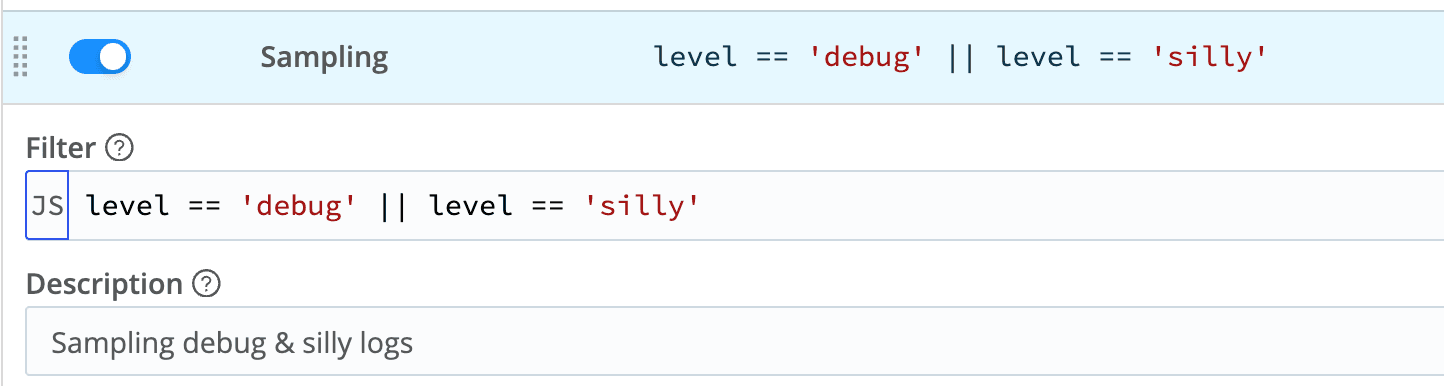
Of course there might be cases where some debug logs are generated rarely and with higher value, in such cases, we can either update the filter or disable this function when necessary.
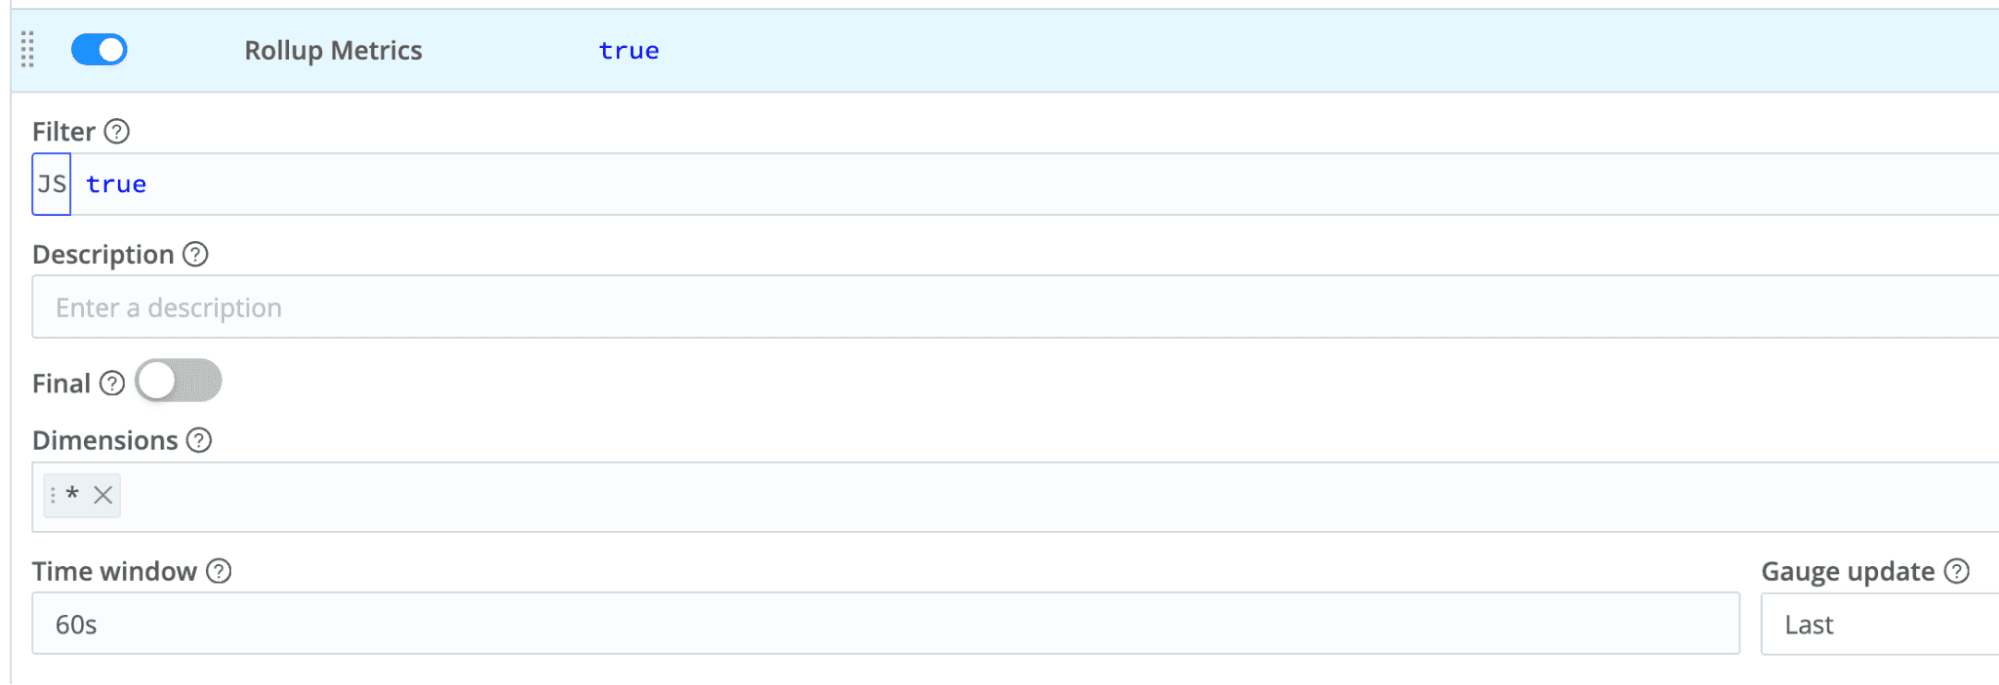
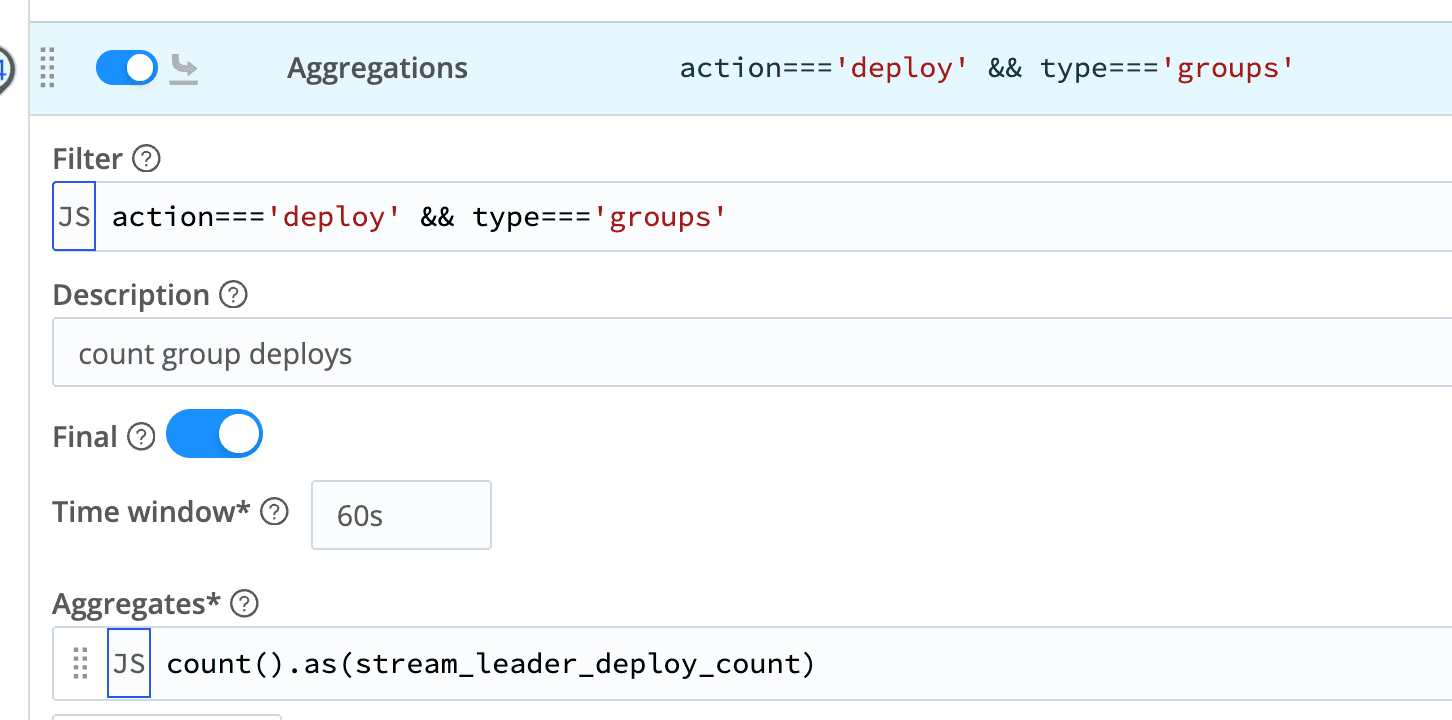
Use “Aggregations” or “Rollup Metrics” to reduce dimensions or frequency of metrics
High-resolution metrics are great, but we don’t need tens of dimensions or seconds of granularity. Use Cribl Edge or Stream to aggregate multiple dimensions into metrics or roll up existing metrics into coarser time buckets. This preserves visibility while significantly lowering the storage footprint as well as computation for queries.
Disable non-critical jobs and only re-enable when necessary
Automated collection is the default, but it shouldn't be the only mode. We intentionally disable collection jobs for specialized debug data. When an incident occurs, SREs can toggle these jobs on in Cribl Edge Stream, collect what they need, and turn them back off to save compute credits.

In the above screenshot, the job ListPendingCollectionJobs is disabled. It was created during an incident of collection jobs being stuck at ‘pending’, and with this we could understand how widespread the issue was. After the incident it was intentionally left disabled for future use if needed.
Conclusion
Optimizing your observability stack isn't just about saving money; it's about improving the signal-to-noise ratio for the human on-call. By leveraging Cribl Edge, Stream, and Lake together, you can build a sustainable, high-performance telemetry pipeline.
Ready to start? Audit your highest-volume sources today and try dropping one redundant field using a Cribl Stream pipeline.