


I have several conversations each week with businesses that have some level of desire to ‘do more’ with OTel. Logs and native OTel signals are relatively easy to pass around and land in an OTel enabled destination. Metrics collected in a format that isn’t already OTel can be a bit trickier.
TL;DR
I’m collecting Windows metrics using Cribl Edge in my home lab. It is collected in JSON, has some internal cribl_metrics fields for things like types and dimensions, and is not at all a Native OTel signal. This blog will share where I stubbed my toes trying to convert to OTel and send to Elastic and then what finally worked. And when I say it worked, I mean it felt like magic. It felt like being the Sorcerer’s Apprentice in Fantasia without the uncontrollable mess at the end.
As with all things Elastic, there is a lot of content and tooling that is usable out of the box so long as you map your data to the Elastic Common Schema…or ingest OTel compliant data! Choosing to format your data into true OTel is worth the effort because it gives you a lot of flexibility for any other tools you want to explore and utilize.
The goal: get Cribl Edge host metrics into Elastic as true OTel. I don’t want flattened logs, or ECS metricsets because I want the out-of-the-box Hosts page to read them natively.
Step by step
1. Collect host metrics on the Edge and send them into Stream
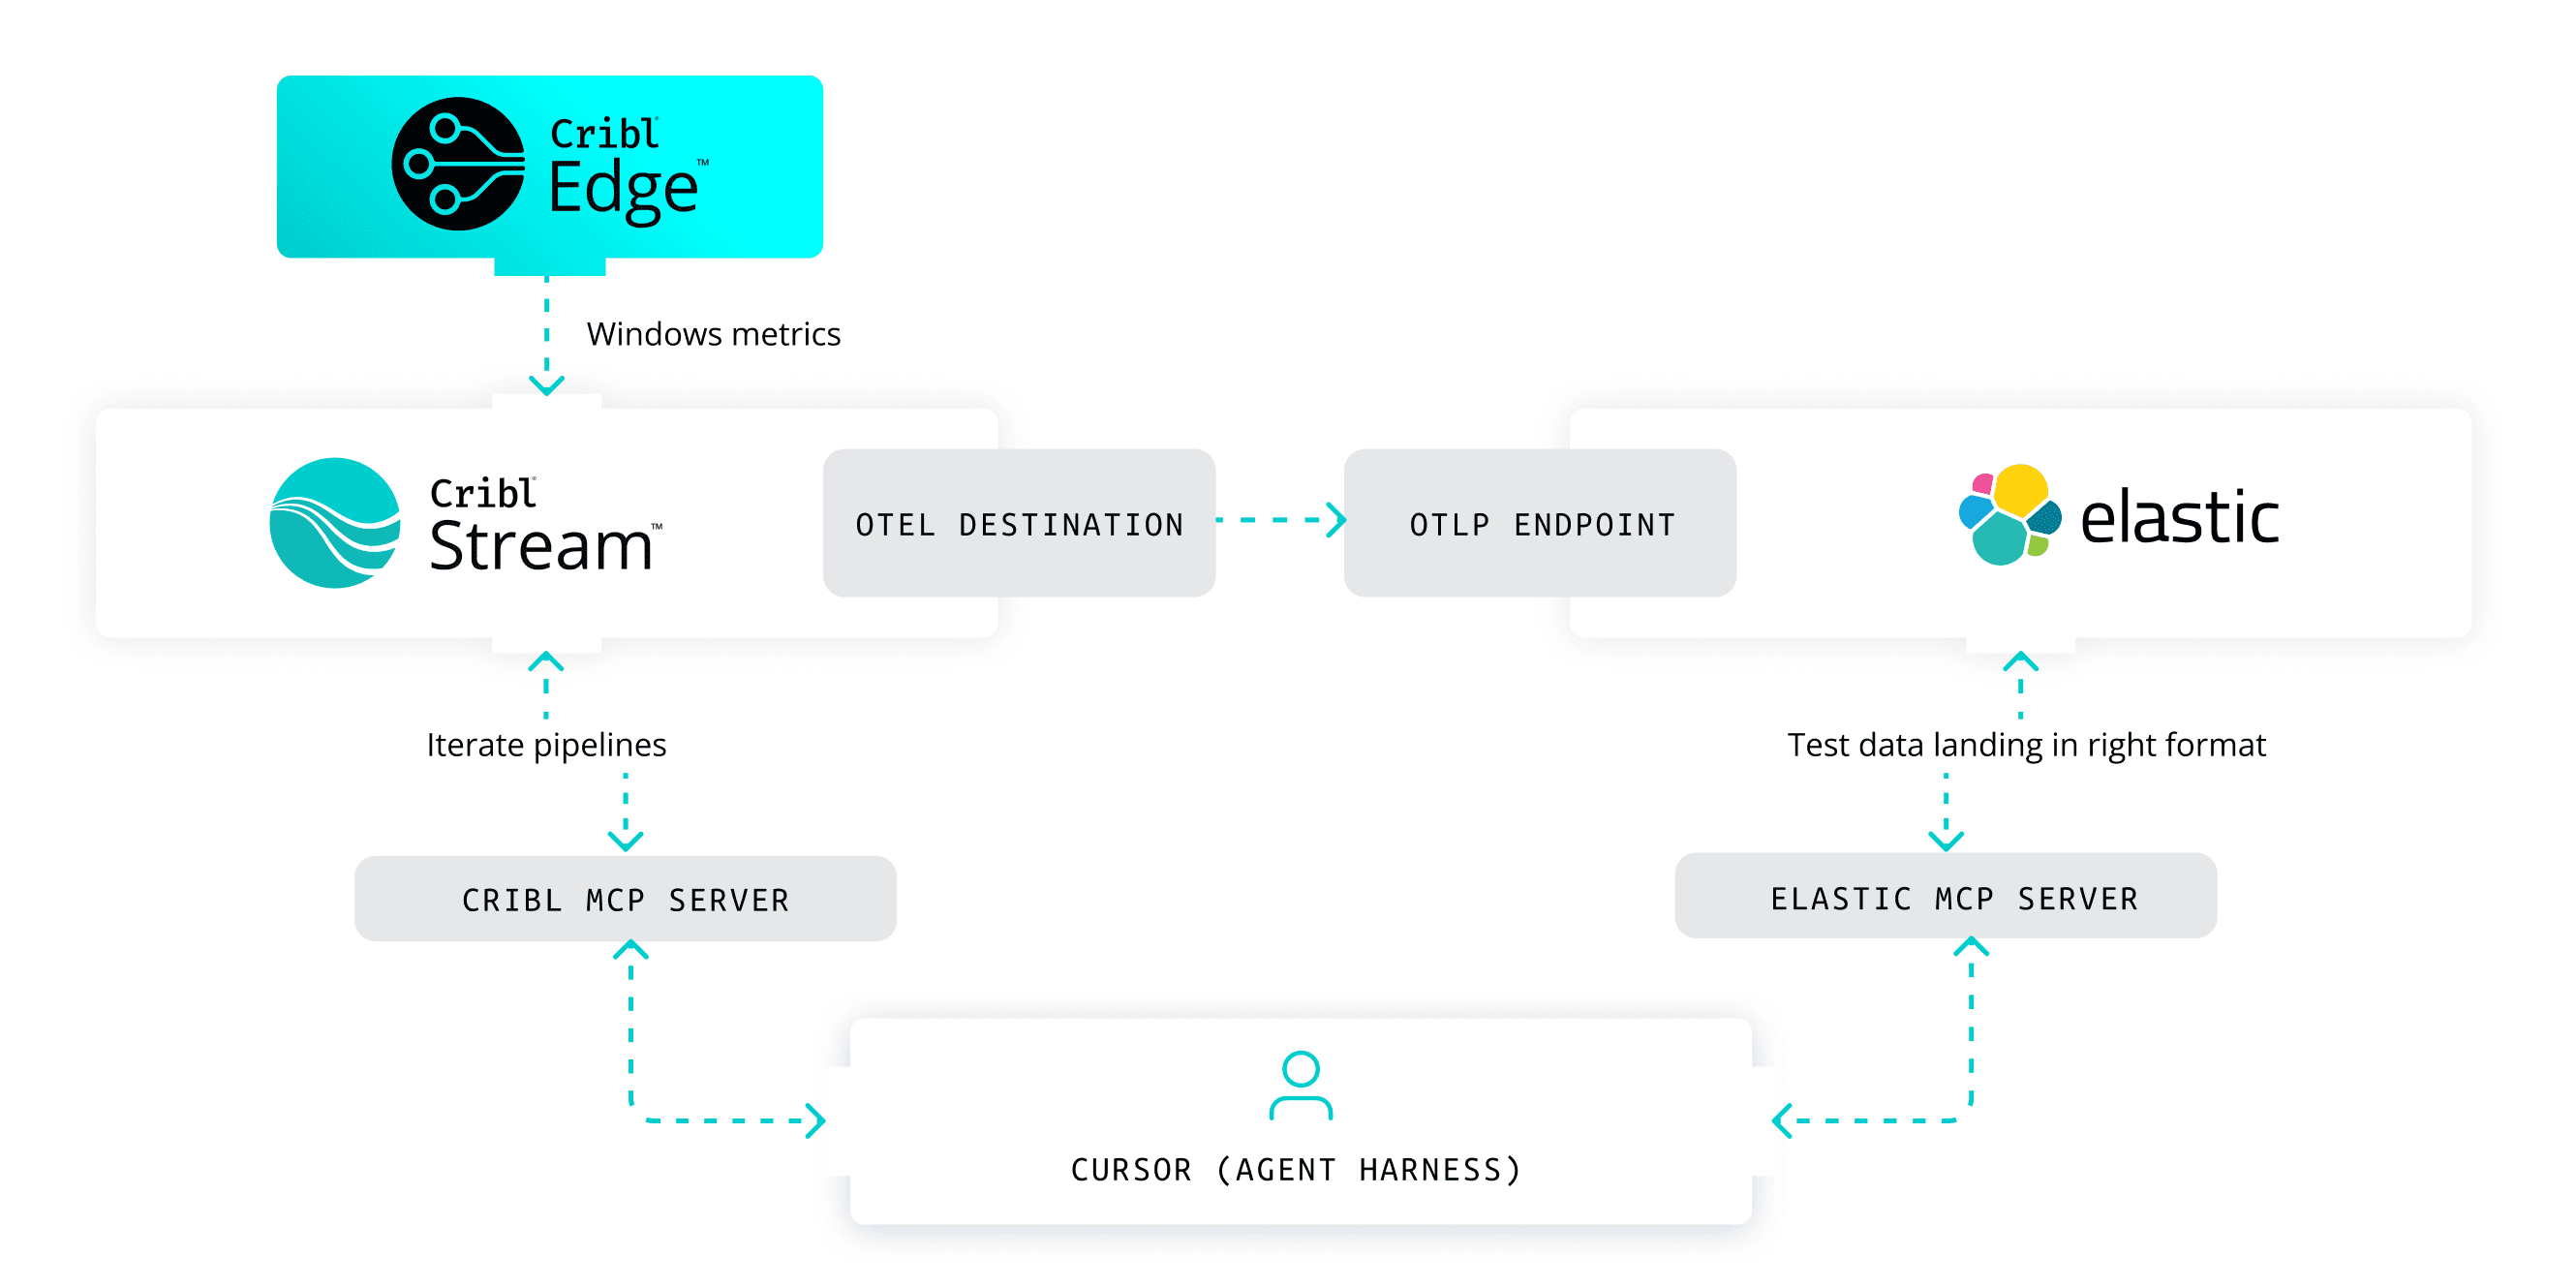
If it ain’t broke, don’t fix it: Cribl Edge collects the metrics, and the Cribl HTTP destination carries them into Cribl Stream (a special destination in Edge, a special source in Stream). On Windows I'm collecting the windows_* metrics (CPU, memory, logical disk, network). On Linux I'm collecting the Edge System Metrics source, which gives me node_* metrics (CPU by mode, memory, disk, network, and real load average).
2. Reformat the data for OTel
I was looking for an easy button and it ended up being…MCP servers to the rescue! Cool kids use Cribl, the coolest kids use their favorite AI agent harness and the Cribl MCP server to make magic happen. Elastic also has an MCP server. I tried my hand at a few simple pipelines to get my Windows metrics data converted to true OTel until I decided to wire up two MCP servers with my AI agent harness. This allowed me to push changes to Cribl from the same client that was probing Elastic to make sure data was landing in the correct format and lighting up the appropriate tiles and dashboards. This is the part that truly felt like magic. In the same window, I was asking my agent to update the Cribl pipeline, I kept the human (me) in the loop by manually committing any changes, and I could review and direct the attention of my agent to tiles or parameters that did not look correct when reviewing them in Elastic. I was able to multitask by directing my agent on a task while I caught up on other tasks that needed my attention as well.
2. Pick the right door into Elastic
This was one of the big "aha” moments. If you send OTel metrics through the APM Server, they get flattened into apm.app.* and the Hosts view never sees them. The Hosts view specifically looks for the hostmetricsreceiver.otel dataset with OTel native field mapping. The only thing that produces that today is the Elasticsearch OTLP endpoint (/_otlp/v1/metrics, GA since 9.2).
So skip the APM Server for host metrics and point the Cribl OpenTelemetry destination straight at https://<your-es>:9200/_otlp/v1/metrics.
(Basic auth works fine here — one less thing to configure than API keys.)
3. Map your metrics to the OTel hostmetrics semantic conventions
This is the heart of it. The Hosts view computes each tile from specific semconv metric names and attributes, so your field names have to match. A few of the important ones:
system.cpu.utilizationwith astateattribute (idle,user,system,wait,…)system.memory.utilizationandsystem.memory.usagewithstate(used,free)system.filesystem.utilizationsystem.disk.ioandsystem.disk.operationswithdirection(read,write)system.network.ioandsystem.network.packetswithdirectionsystem.cpu.load_average.1m/5m/15mandsystem.cpu.logical.count
I (the AI Agent) used a Code function to translate each raw counter into a datapoint, then the OTLP Metrics function to shape it into OTLP. The one non-obvious part: set your resource attributes host.name, host.id, os.type, and critically data_stream.dataset = hostmetricsreceiver and data_stream.namespace = default. That dataset is what routes your data into the Hosts view in Elastic.
A little AI pair-programming went a long way here. I let my assistant iterate the field mappings while I checked the results in Elastic. Same energy as using Copilot Editor, just for metrics.
4. Route it and check the Hosts view
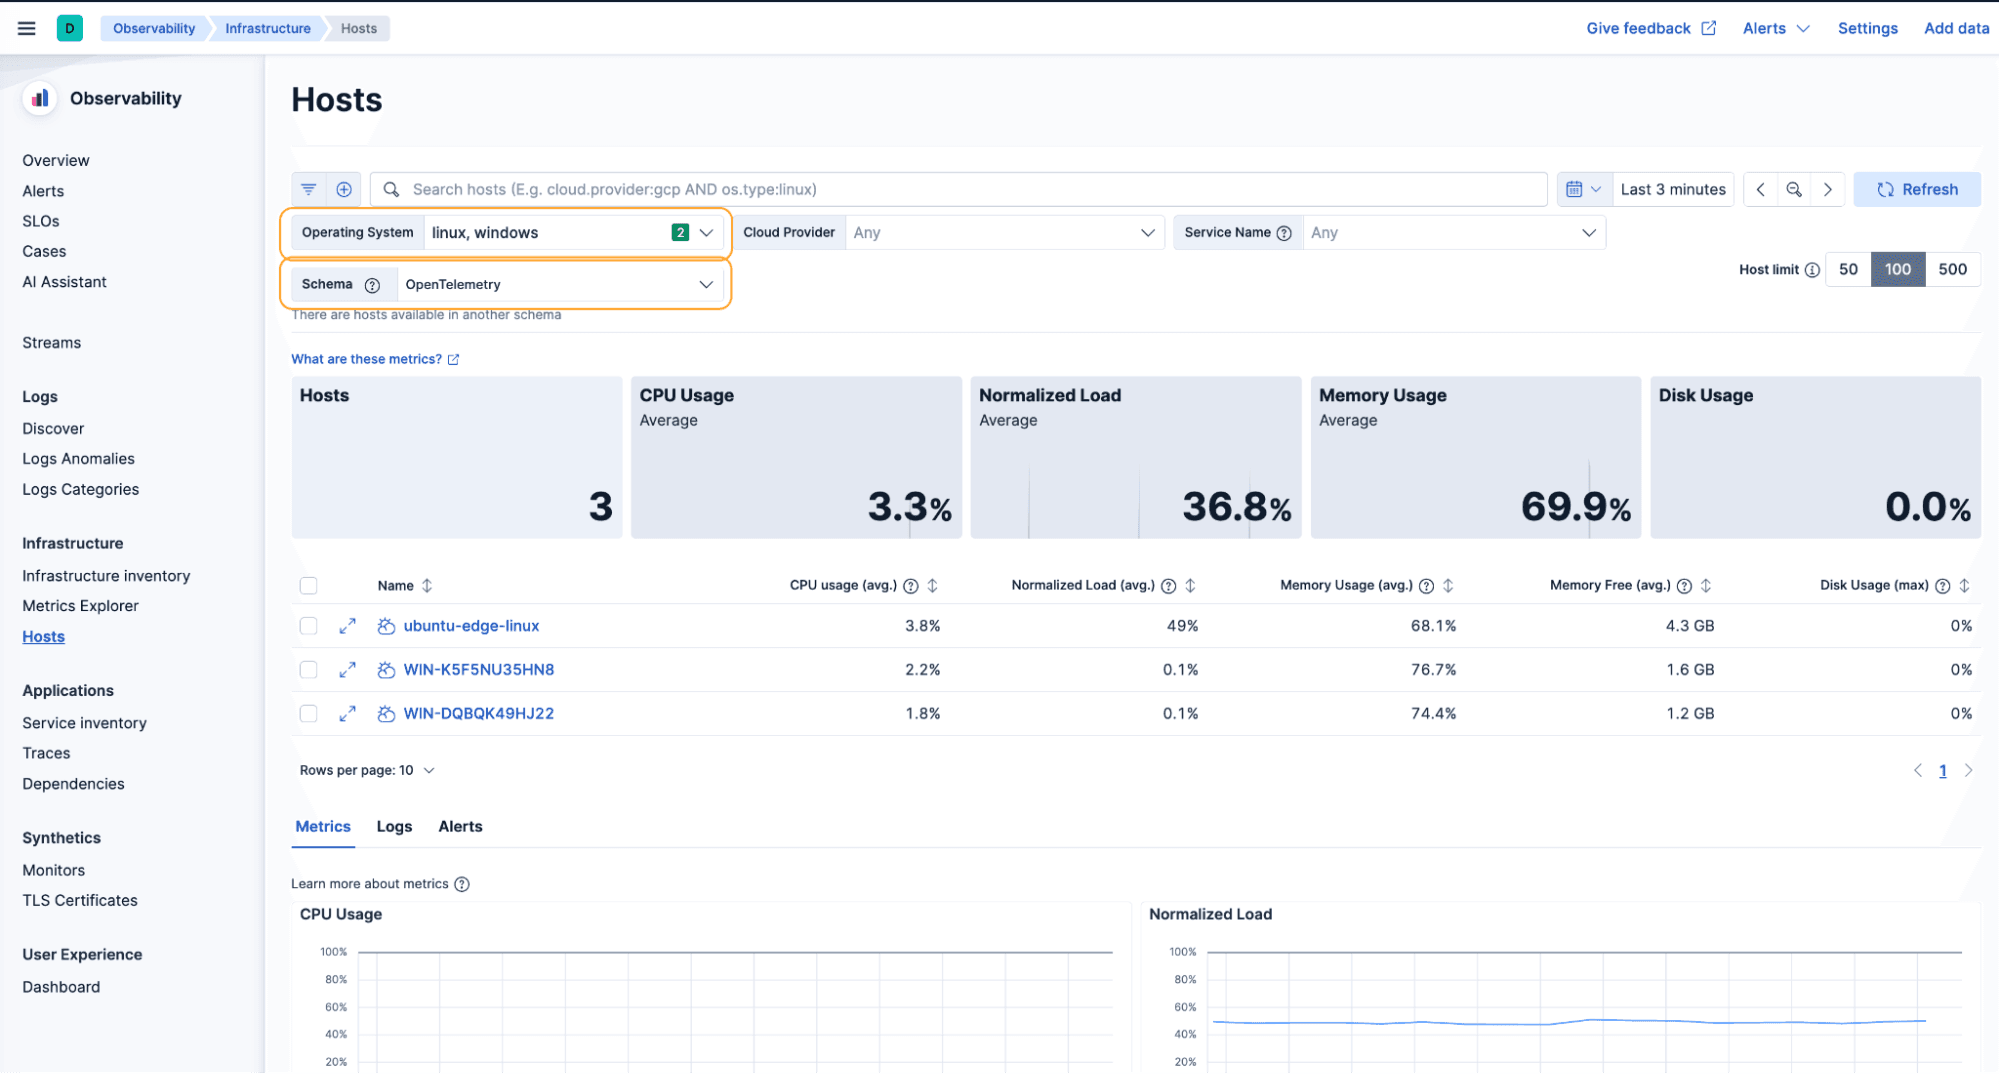
Route your metric events through the pipeline to the OpenTelemetry destination, then open Observability > Hosts. If Elastic sees both System integration data and OTel data, use the Schema selector and pick OpenTelemetry. Your hosts should appear with CPU, memory, and disk usage populated.
(Two Windows hosts and a Linux host, all reporting.)
Pro tips (a.k.a. the gotchas I hit so you don't have to)
Pro tip #1 - Don't emit exact zeros. Cribl's OTLP encoder follows proto3 and drops zero-valued fields, which the Elasticsearch OTLP endpoint reads as a "valueless" datapoint and rejects the whole batch with a 500. In my add() helper I simply skip any datapoint whose value is exactly 0. No more batch failures.
Pro tip #2 - Mind your Kibana version. My CPU Usage and Memory Usage cards showed N/A even though the data was perfect. Turns out the semconv formulas in Kibana 9.3.1 sum optional states that Windows never emits (cpu state:wait, memory state:buffered/slab_*), and if any term is empty the whole card goes N/A. It's a known bug (kibana#250562) fixed in 9.3.3 / 9.4.0 / 9.2.8. A patch upgrade lit them right up — no pipeline change needed. My agent found this and since I was running a docker Elastic deployment, my agent also patched my stack.
Pro tip #3 - Windows has no load average. "Normalized Load" is load_average.1m / logical.count, and Windows just doesn't have a Unix-style load average. The conventional proxy is windows_system_processor_queue_length (threads waiting in the ready queue), so I map that to system.cpu.load_average.1m. One catch: it's 0 on an idle box, and remember Pro tip #1, so I floor it to a tiny non-zero value (an idle Linux box hovers near zero too). Now the tile renders. On Linux you don't need any of this — node_load1/5/15 are the real thing. You can either decide not to populate the normalized load for a Windows host or jump through these hoops to avoid any ugly “NaN” tiles.
Pro tip #4 - Disk IOPS and throughput are their own metrics. system.filesystem.* is capacity, not I/O. To fill in Disk Read/Write IOPS and Throughput you need system.disk.io (bytes) and system.disk.operations (counts) as monotonic sums with a direction attribute — the Hosts view rates them with counter_rate().
Wrap-up
The flexibility of Cribl Stream means you can start here and keep going. You can drop dimensions you don't chart, fan out a full-fidelity copy to somewhere cheap like Cribl Lake, or enrich the metrics with cloud/host metadata before they land. But the core win is simple: map to the OTel hostmetrics semantic conventions, tag the hostmetricsreceiver.otel dataset, send to the Elasticsearch OTLP endpoint, and your Hosts view comes alive.
And if you get stuck, the Copilot Chatbot (or your AI assistant of choice) is a click away.