
Giving OT the visibility and response capability we've long expected from IT
For most of my career, security visibility has been a story of two environments. On the IT side we got pretty good. We instrument the endpoints, centralize identity and authentication, parse the firewall and proxy logs, land it all in a SIEM, and reconstruct an incident with reasonable fidelity. On the OT side we stayed perennially blind, and worse, powerless: unable to detect what was going wrong inside the environment that actually runs the business, and unable to respond when we suspected something was broken.
The business cost of that blindness is measured in time. Industry data (IBM Cost of a Data Breach, Verizon DBIR) puts the mean time to even identify an intrusion at roughly 194 days, with another 64 to contain it once you finally see it, and that math is worse in OT, where frequently you can't see the event at all and can't safely act on it once you do. Every day of that dwell is a day an adversary sits next to a process that can stop production, threaten safety, or both. The equation for a business owner is simple: prevention lowers the probability of an incident, but visibility and response are what lower its consequence, and OT has historically had neither.
I learned how expensive that gap is in a place that wasn't technically OT at all. When I ran security engineering and architecture for HBO Max and Warner Bros. Discovery, our hardest problem wasn't the corporate network or the streaming platform, it was the broadcast environment. The playout systems, the automation chain that assembles programming and pushes it out to air, and master control that kept CNN, TNT, and TBS on the air were the literal bread and butter of the business, and they were nearly opaque to us. Purpose-built, vendor-locked, real-time, and intolerant of anything that might add latency or instability. You do not casually drop an agent onto a system that is live to air. We had excellent telemetry on everything surrounding it and almost none on the thing that mattered most.
That is the exact shape of the OT problem, and in an industrial setting the consequence of getting it wrong moves from a broadcast outage to process safety. The encouraging part is that the gap was never really a sensor problem. It's an architecture problem and architecture problems have solutions.
Why OT stays dark
Walk the Purdue model from the bottom and the reasons reveal themselves. Levels 0 and 1 are field devices, sensors, PLCs (the ruggedized controllers that actually open valves, start pumps, and run the physical process), RTUs, these usually speak proprietary, binary, real-time protocols like Modbus and OPC-UA that were never designed to be observed, and most require protocol-specific middleware just to be read. You don't put a new agent on a PLC, and you don't introduce anything that could add jitter to a control loop. The first rule of OT telemetry is the first rule of OT operations: don't touch the thing running the plant.
Move up and it improves. Levels 2 and 3 are SCADA, HMIs, historians, MES, engineering workstations most of which run on standard operating systems with normalized OS, audit, and application logs, where lightweight collection is reasonable. Level 3.5, the industrial DMZ, is where the IT/OT boundary lives: firewalls, IDS and behavioral-anomaly sensors, jump servers, and log collectors, all working off data that is already normalized. Running through all of it is segmentation such as diodes, one-way flows, air gaps, all of that has to be respected rather than bypassed, in an environment that is increasingly software-defined and therefore only as trustworthy as your ability to verify it.
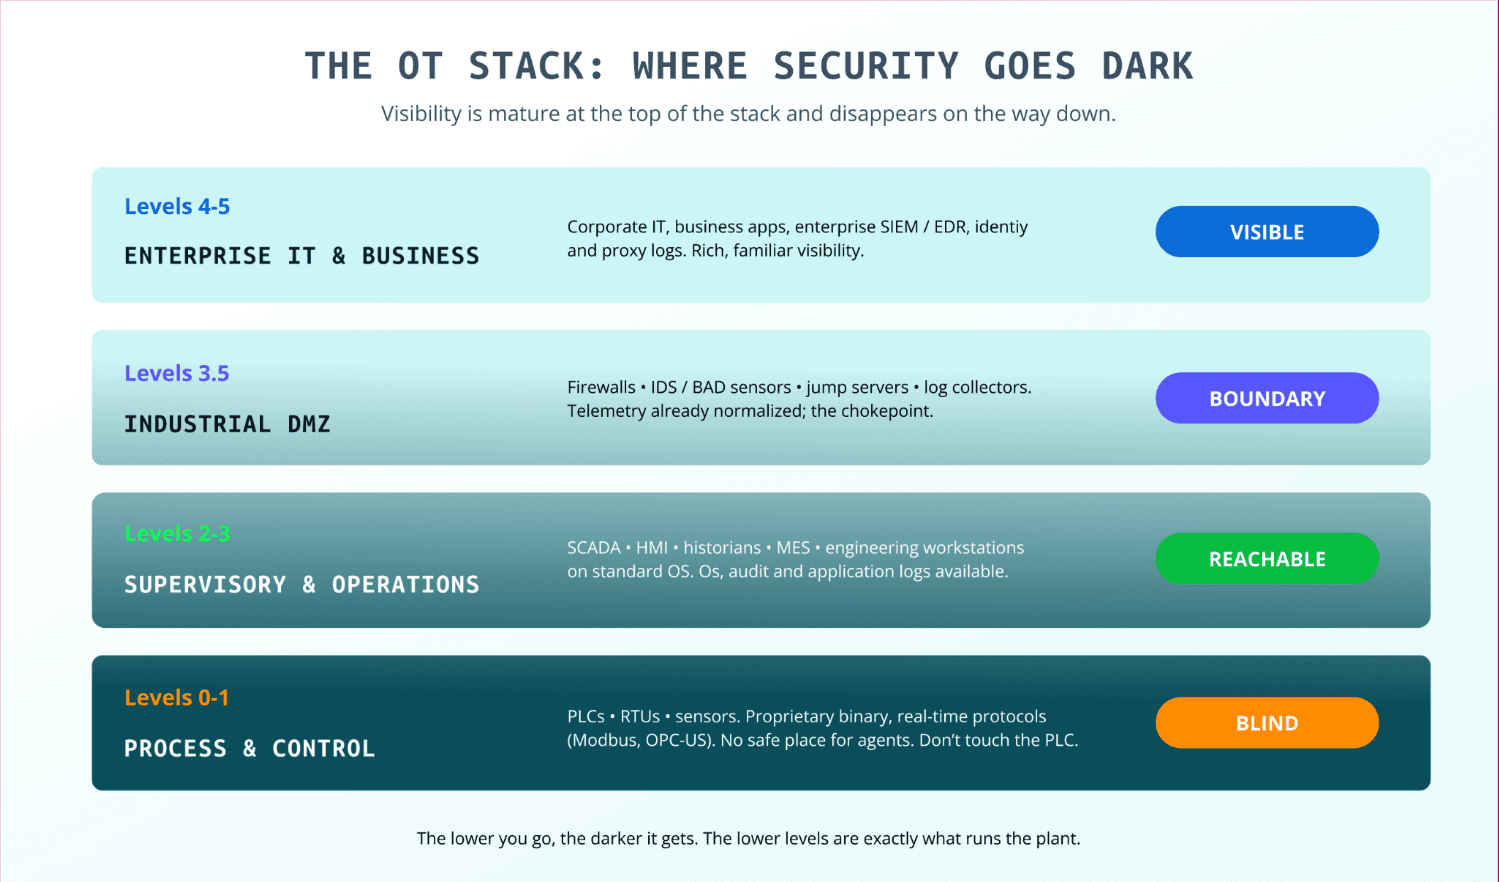
So the design question is not "how do we collect everything." It's "where do we stand to see the most while touching the least?"
Where the data engine belongs
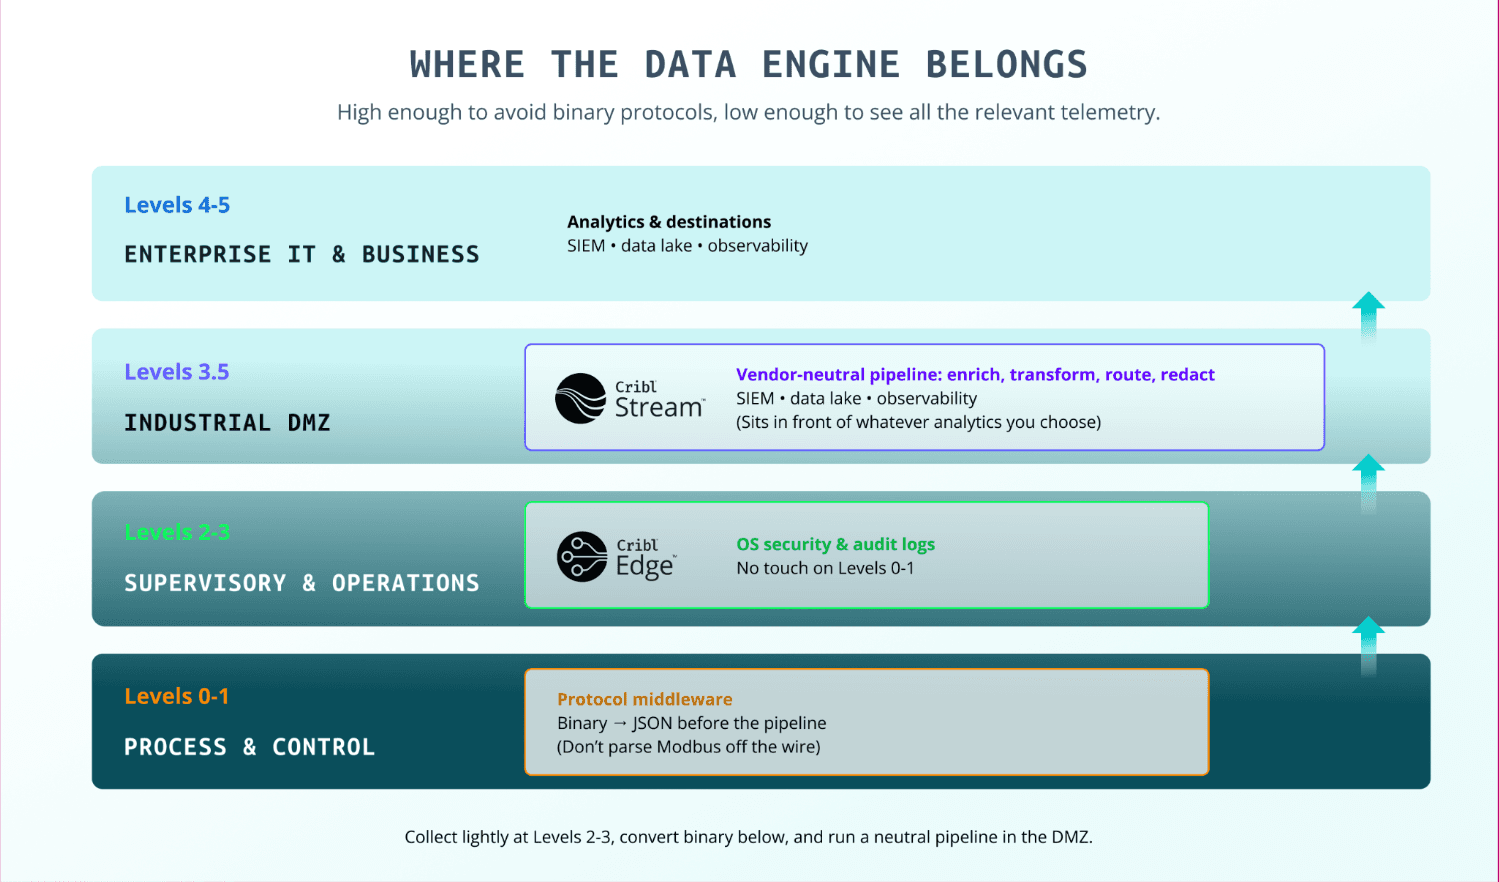
The principle I keep coming back to: place the telemetry layer high enough in the Purdue model to avoid proprietary binary protocols, but low enough to still see all the relevant OT telemetry. High enough to read it; low enough to see it.
In practice that means lightweight collection on Levels 2-3 with edge agents on the Windows and Linux hosts (SCADA and HMI servers, historians, engineering workstations) pulling OS security and audit telemetry, with no touch on Levels 0-1. Implement a vendor-neutral pipeline plane in the DMZ at Level 3.5, sitting in front of your analytics, close to the firewalls, IDS/BAD sensors, jump servers, and collectors where data is already legible. For the genuinely binary lower-level protocols, you convert to JSON over HTTP or TCP with middleware before anything reaches the pipeline; you don't ask the pipeline to parse Modbus off the wire. The placement respects the diodes and one-way flows, leaves the PLCs alone, and maps cleanly onto IEC-62443's concepts of restricted data flow and system integrity.
Moving telemetry without breaking segmentation
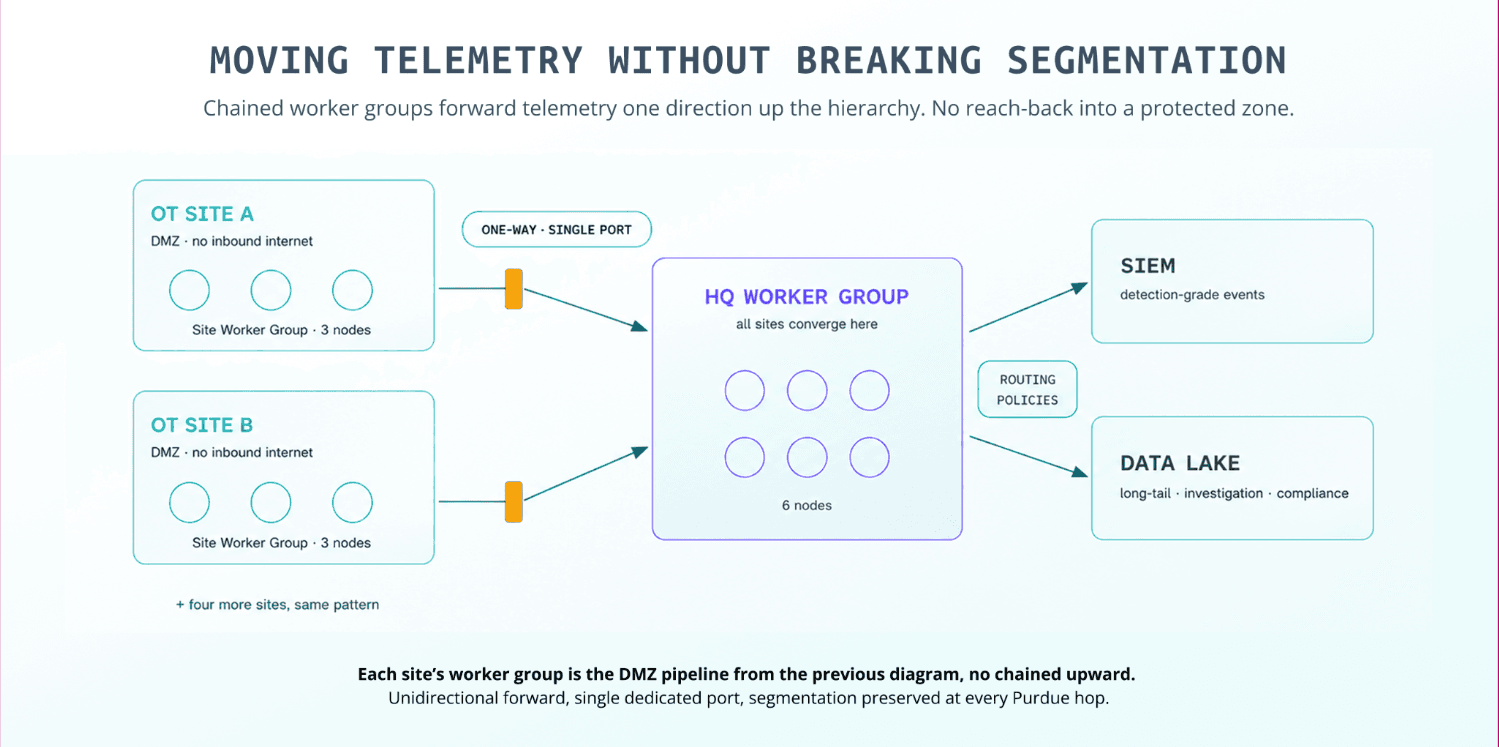
Placement gets you the collection of telemetry at each site but it doesn't get the data to the analysts. And the naive fix is opening bidirectional paths through every Purdue boundary so a central SIEM can reach in, this is exactly what the security model forbids.
The pattern that works is chained worker groups: pipeline nodes that forward telemetry one direction up the hierarchy. A small worker group sits in each site's DMZ with no inbound internet access and forwards, over a single dedicated port, to a central worker group at headquarters; from there, routing policies send detection-grade events to the SIEM and the long tail to a data lake for investigation and compliance. Every boundary is crossed by an outbound, unidirectional forward which never reaches back into the protected zone. The result is one continuous data plane that preserves segmentation at every hop instead of defeating it.
Three ways the telemetry still fails
Even with placement and transport solved, the data can fail you quietly, because none of these trips an alarm.
Blind spots: sources never onboarded i.e. a new historian, a contractor laptop, a freshly deployed MES. You can't alert on what you never collect.
Brownouts: collectors sampling, queues dropping, license caps silently clipping ingest while the dashboards stay green and the data thins exactly where it matters.
Blackouts: data retained but in the wrong tier, tool, or format. The investigation needs an answer in thirty minutes and the data takes six hours to thaw.
Beating all three takes intent: audited sampling reviews, deliberate tiering, and coverage measured by source category so you can always name what's on, off, or dropping.
The part that actually changes the job: enrichment
Here is where OT telemetry stops being a checkbox and starts being useful. OT logs are low-fidelity by nature. The control unit that emitted an event usually has no idea what it is, where it sits, or why it matters. It produces an IP, a hostname, and a code, and nothing a security analyst can reason about. Staring at that line, an analyst can't tell whether they're looking at a print server or the historian feeding a crude unit, so the event gets ignored or it triggers a call to the plant floor and the mean time to detect and remediate balloons.
Enrichment closes that gap, and the pipeline in the DMZ is exactly where it belongs. As events flow through, the pipeline runs in-flight lookups against your asset inventory, engineering register, or CMDB keyed on the IP or hostname the source already carries and adds the context the source could never supply. The raw event is never altered; the PLC is never touched; the context is grafted on at the one layer that can see the whole picture. Take a single privileged logon. What the control network emits is a successful remote logon from one internal address to another, which to a tier-1 analyst is noise:
EventID=4624 Account=svc_scada Host=WIN-HS3 Src=10.42.8.17 LogonType=10
What the pipeline emits, after enrichment, is a remote interactive logon to HIST-CRUDE-02, a process historian at Purdue Level 3 in Refinery North, serving Crude Unit 2, asset criticality Tier 1, safety-adjacent, owned by OT Engineering, occurring outside the maintenance window via a service account. Same event, entirely different decision.
Now it's an alert a tier-1 analyst can act on in minutes, correlate against the VPN session and the directory anomaly, kill the session, preserve forensics, without calling the plant to ask what WIN-HS3 even is. The event forwarded to the SIEM or data lake now has context and has been transformed from a simple key=value pair to a json event:
{
  "event_id": 4624,
  "action": "remote_interactive_logon",
  "outcome": "success",
  "logon_type": 10,
  "user": "svc_scada",
  "user_type": "service_account",
  "src_ip": "10.42.8.17",
  "host": "WIN-HS3",
  "asset": {
    "name": "HIST-CRUDE-02",
    "role": "Process Historian",
    "purdue_level": 3,
    "site": "Refinery North",
    "process_served": "Crude Unit 2",
    "criticality": "Tier 1",
    "safety_adjacent": true,
    "owner": "OT Engineering"
  },
  "change_window_active": false,
  "severity": "high",
  "tags": ["ot", "privileged-access", "out-of-window"]
}
That is also what finally lets an IT SOC carry out OT security: enriched, standardized telemetry is telemetry an IT analyst can read natively, so the translation tax gets paid once, in flight, rather than on every incident, and it compounds. The same legible, semantically consistent data is precisely what the agentic systems coming for triage will need to reason about an OT environment safely.
The standard to hold
The OT visibility gap was never a failure of will; it was a failure of placement, transport, and context. Put the pipeline where it can see without touching, move the data in one direction without breaching a single boundary, defeat the silent failures on purpose, and enrich aggressively so that a log from a device that doesn't know what it is arrives as an event a human (or an AI agent) can act on. Do that, and OT stops being the blind spot it has been for nearly the entire history of the discipline. The goal isn't exotic: hold the operational environment to the same standard of visibility and response we've expected from IT for twenty years and finally be able to detect, and answer, what happens inside it.
We invite you to explore this topic in more depth on Tuesday, August 25th with an 11:00 AM ET webinar “Bridging the IT/OT Gap: Modern Visibility for Critical Infrastructure,” RSVP today!