

What Are the 3 Pillars of Observability?
The 3 pillars of observability are the three primary signal types that engineering and operations teams use to understand system behavior. Often abbreviated as MELT when events are included, each pillar provides a distinct perspective on what a system is doing and why.
Pillar 1: Logs
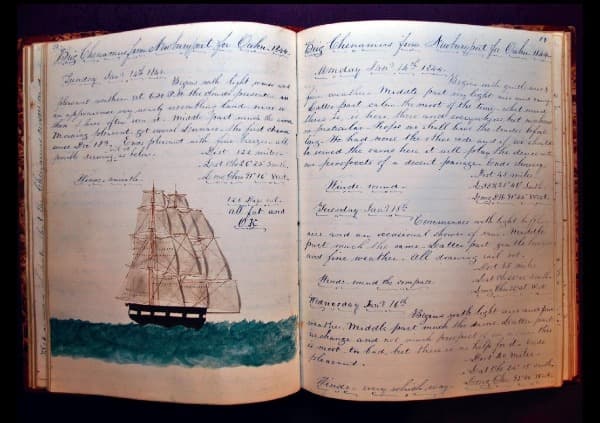
A log is a timestamped record of a discrete event produced by an operating system, application, or process. Think of a ship's captain recording heading, speed, and notable occurrences in a logbook several times a day. Digital logs work the same way: each log event captures a timestamp, system name, severity level, application name, and a message describing what happened.
Log messages appear in many formats: key=value pairs, JSON, CSV, or plain text. A common web server log entry, translated into plain English, might read: "Web server #32 was contacted by a client in Iceland requesting a page that does not exist. A 404 error was returned in 18ms."
Logs are used across teams for different purposes. Security analysts review firewall logs to track external connections. System administrators parse application logs to troubleshoot failures. Business teams may mine web server logs to measure campaign traffic. The audience determines which logs matter and how they should be routed.
In summary: A log is a collection of log events from similar sources, stored in log files on a server or forwarded to a centralized log management system.
Pillar 2: Metrics
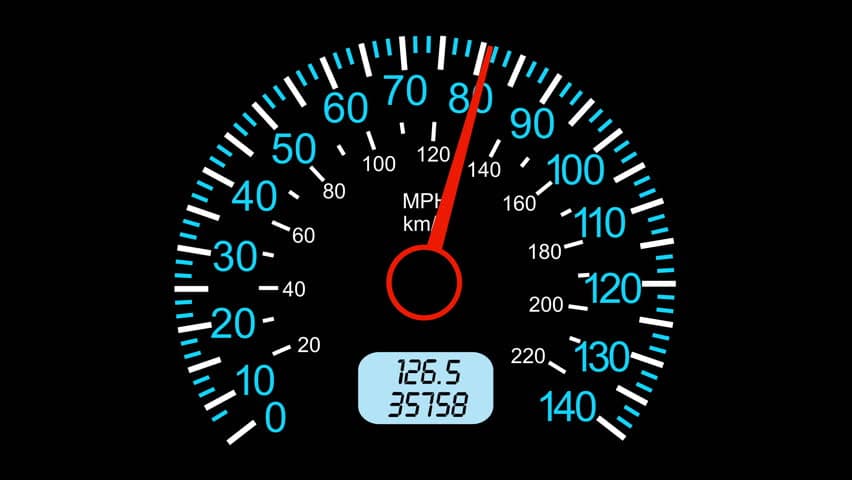
Metrics are numerical measurements captured over time. Every metric event includes a timestamp, one or more numeric values, and dimensions that provide context for filtering and grouping. A car's speedometer reading, a server's CPU utilization percentage, and a patient's blood pressure at a checkup are all metrics.
In IT environments, a metric event might include CPU utilization, memory usage, load average, and CPU temperature, paired with dimensions such as hostname, location, department, and business function. These values are stored as floating-point numbers, enabling fast mathematical analysis.
Logs and metrics often overlap: a web server log entry may contain numeric fields such as bytes transferred and response time. However, log events and metric events are processed differently. Metric events are inherently numerical and analyzed directly. Log events are stored as text and must be parsed before numeric analysis, which introduces a performance cost.
Analyzing metrics across time windows produces aggregations: average response time over five minutes, total bytes transferred per hour. In IT operations, metric aggregations are the primary signal for detecting whether systems are healthy or degraded.
Pillar 3: Traces
A trace is an after-the-fact record of everything an application transaction did, ordered from start to finish. Think of a Gantt chart created after a project completes, capturing how long each phase actually took. Traces provide that same view for software: they show which services were called, in what order, and how long each step took.
Traces are composed of spans. Each span represents a single operation within the transaction and carries a parent-child relationship to other spans in the trace. Spans are, in essence, structured and ordered records about the execution of individual functions within code. Traces are groups of linked, ordered spans with shared execution context.
Application developers use traces to identify the least performant calls in a codebase and to isolate dependencies behaving unexpectedly. APM tools are purpose-built for trace generation and analysis, though some log analysis tools can reconstruct trace-like views from log events.
How the 3 Pillars Work Together
Understanding each pillar in isolation is useful. Understanding how they interconnect is where observability becomes powerful.
Metrics tell you that something is wrong. A spike in API latency or a drop in request throughput triggers an alert. Logs tell you what happened: the specific error messages, the sequence of events, the affected components. Traces tell you where the breakdown occurred across a distributed system, mapping the exact path a request took and identifying which service introduced the delay.
No single pillar answers all three questions. Teams that rely exclusively on metrics can detect problems but struggle to explain them. Teams that rely exclusively on logs gain detail but lose the performance trend visibility that metrics provide. Teams that rely exclusively on traces gain deep application insight but miss the network and infrastructure signals that only emit logs and metrics.
Fueling a culture of observability means connecting the dots across all three signal types, gathering data from every corner of the stack, and using the right tools to turn raw telemetry into actionable insight.
Events and Alerts: Beyond the Three Pillars

Logs, metrics, and traces are the foundational three, but they do not cover every signal type teams encounter. Events is the broader category that encompasses all of them, and alerts are the most common additional event type.
An alert is any notification sent from one system to another. Alerts may be security-related or operational, may indicate a failure or a recovery, and may be delivered via SNMP trap, REST API, log event, email, or text message. Even the creation of a new file on a filesystem qualifies as an event: a state change that downstream systems may need to detect, read, and act on.
This is why some teams extend MELT (Metrics, Events, Logs, Traces) as the fuller picture of observability telemetry.
Beyond the 3 Pillars: The Layers Model
The "pillars" framing is useful for introducing observability concepts, but it carries a hidden risk: pillars imply silos. When developers declare traces superior, they ignore the network and infrastructure layers that emit only logs and metrics. When SREs dismiss logs because "metrics are easier to store and search," they lose the ability to answer why a problem occurred after metrics detect it.
Technology itself is built in layers, not pillars. The OSI and TCP/IP models are layered stacks. Hardware and software abstractions form compute layers. Applications have layered architectures. Observability should be understood the same way.
Overlaying team personas onto the layers of observability reveals that different roles consume different telemetry at different layers of the stack. ITOps teams work primarily with logs and metrics from infrastructure. Application developers work primarily with traces and application logs. SREs and Cloud Ops teams span multiple layers. None of these personas can afford to ignore the signals generated at layers outside their primary focus.
Here is a useful reframe: spans are structured logs about the execution of code; traces are ordered groups of spans with shared execution context; logs are the human-readable record of what a system did. Network flows are logs about network conversations. When viewed this way, the boundaries between signal types dissolve, and the question shifts from "which pillar is best?" to "which telemetry answers this specific question?"
Metrics vs. Logs vs. Traces: When to Use Each
Power Observability With Cribl
Is seamless observability across all telemetry types and tech stacks achievable? Can different roles and responsibilities share telemetry sources so every team has the right data at the right place and time? Absolutely. But it takes more than wishful thinking. It takes observability built on scalable, resilient, and powerful pipelines.
In the world of observability, choice and flexibility matter. Engineers responsible for collecting, enriching, routing, and storing massive volumes of logs, metrics, and traces carry a heavy load. Managing the flow of critical telemetry, ensuring operational resiliency, and guaranteeing compliance are all in a day's work for Cribl and its customers.
Whether the stack uses OpenTelemetry or OCSF, runs cloud or on-premises, spans applications or infrastructure, Cribl, the AI Platform for Telemetry, breaks down the barriers between pillars and layers, unifying observability strategy across every signal type. That is how teams build an authentic culture of observability.
3 Pillars of Observability FAQs
What are the 3 pillars of observability?
The 3 pillars of observability are metrics, logs, and traces. Metrics capture numeric measurements over time, logs record discrete timestamped events, and traces map the journey of a request across distributed services. Together, they enable engineering teams to detect, investigate, and resolve system issues.
What is the difference between monitoring and observability?
Monitoring tracks predefined metrics and alerts on known failure conditions. Observability goes further: it enables teams to ask arbitrary questions about system behavior and understand why a failure occurred, not just that it occurred. Observability requires all three pillars working together.
Is there a 4th pillar of observability?
Some frameworks add events to create MELT: Metrics, Events, Logs, and Traces. Events is the broader category that encompasses alerts, state changes, and other signals not captured by the core three. Cribl's data processing engine handles all four signal types.
Why are logs, metrics, and traces called pillars?
The term "pillars" reflects the idea that each signal type independently supports observability. However, the framing can imply silos. Leading teams treat these signals as interconnected layers rather than independent columns, correlating across all three to answer complete questions about system health.
How does Cribl help with the 3 pillars of observability?
Cribl's solutions route, parse, filter, enrich, and reduce logs, metrics, and traces from any source to any destination in real time. Cribl gives teams control over telemetry volume, format, and routing without lock-in, enabling cost-effective observability across every pillar and every layer of the stack.