
It is very common for Security teams to require bash history to be logged so its SIEM can detect a wider array of internal and external threats. Getting comprehensive bash history sounds easy, but it’s often far more complicated than most realize. Some of the approaches I’ve seen over the years include:
Hack bash source code. This is a truly bad idea since it is not portable and will create dependency issues.
Use the bash built-in trap command. This sounds reasonable until you try it and create a race condition that locks up a server.
Using script method – Don’t even go there. Data capture is unreliable at best.
Auditd (can really work, but are you ready to maintain the complex auditd ruleset?)
Near real-time bash history is harder than it should be for two big reasons. First, bash logging support is limited even for the newest Linux distros. Instead, Bash writes to a file after the user has logged out which is too late to detect an issue and the logging is too easy to either stop or clear before it writes to its log. Tracking user-level behavior is a serious blind spot for user security monitoring.
My preferred solution is using Cribl AppScope to capture bash data flow at the kernel level to get complete visibility without having to interact directly with bash. No complexity, no hacks, no nonsense. Also, this method survives updates and different Linux distributions since AppScope is watching data at the kernel level. In addition, you get other information about the system, including DNS request and response, metrics for processes, and network performance including HTTP payloads.
AppScope is an open-source project that instruments any Linux binary like Nginx. Remember that random C binary written by the guy who left the company five years ago? The one you can’t find the source code for? AppScope can instrument that, too. It gives visibility into the unknown corners of your software with no language-specific agents or bindings required. AppScope attaches to a process, sees everything, and can emit consumable metrics and events into your existing log analytics tools. Think strace/ltrace with data you can actually read. AppScope can provide a significant lift to your observability strategy.
My Stack and Setup Instructions
AppScope running on Centos 7
AppScope is logging to Cribl Stream 3.1 in order to control data flow
Stream is logging the data I want to Splunk 8.2
AppScope is set up to run from /opt/scope
Set your environment variable to use AppScope. I’m using profile.d to add global variables, but this can also work in other ways as long as you load variables correctly.
[root@centos-linux-data-source ~]# cat /etc/profile.d/appscope.sh
SCOPE_HOME=/opt/scope
LD_PRELOAD=/opt/scope/libscope.so
PATH=$PATH:/opt/scope
SCOPE_CRIBL_NO_BREAKER=true

export SCOPE_HOME LD_PRELOAD PATH SCOPE_CRIBL_NO_BREAKER
This makes sure that AppScope knows where its binaries live and that it is using the right config file. Finally, configure /opt/scope/scope.yml to forward data to Stream Cloud for easy setup.
Example
cribl:
  enable: true
  transport:
    type: tcp
    host: logstream.strange-cannon.cribl.cloud (your Stream Cloud URL from the workspaces tab)
    port: 10090
    tls:
      enable: true
      validateserver: true          # false is like curl's -k option
      cacertpath: ''
Configure AppScope to capture commands and command output and DNS
 - type: console
      name: (stdout)|(stderr)
      value: .*
 - type: dns
      name: .*                      #
      field: .*                     # whitelist regex describing field names
      value: .*
To attach AppScope to bash run:
[root@centos-linux-data-source ~]# ldscope bash
To verify you are attached run:
[root@centos-linux-data-source ~]# scope ps
ID      PID     USER    COMMAND
1       21559   root    bash
Look for the name of your process in the output to confirm you have attached scope to the right process.
Using Cribl Stream with AppScope has a number of key benefits. AppScope can see everything and can generate significant data. Stream can be configured to manage the data flow and only log your key data. Stream can also mask potential PII data that could be captured as well. The AppScope/Stream combo is a powerful combination of detailed data and the ability to manage that data to meet your requirements.
The Important Part: What Does the Data Look Like?
User space command and result
[ebailey@centos-linux-data-source ~]$ dig www.cnn.com +short
turner-tls.map.fastly.net.
199.232.33.67
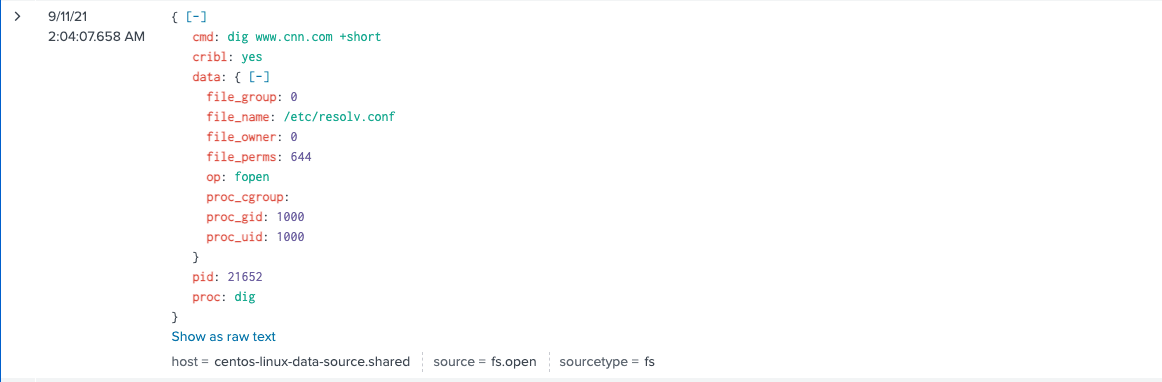
What This Command Looks Like in Splunk
The Command
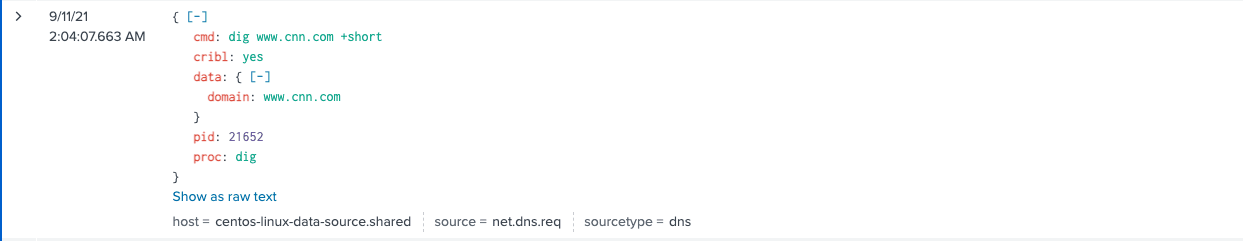
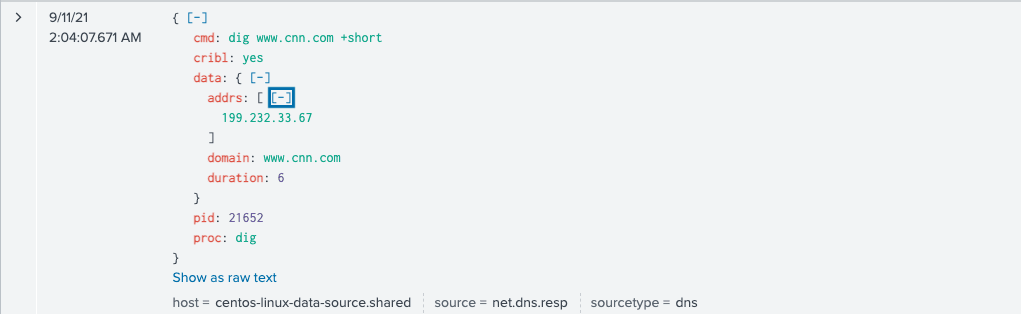
The DNS request and response. This can have a ton of value to detect DNS data exfiltration.
DNS Request
DNS Response
Command Output
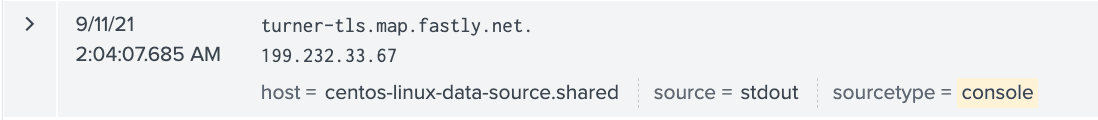
Using AppScope for bash logging, you can clearly see the command, the command output and see other data like DNS query and response. The ability to capture DNS query and response has particular power, since it can be an indicator of an issue. And you can do all of this without having to interact with the bash shell and without generating any overhead in the OS. Your SOC will get valuable data it has a hard time getting otherwise. Your open systems admins will be happy they don’t have to hack bash and create risk and dependencies.
Bottom Line on Bash History Logging with AppScope
Bash history logging is one small example of the power of AppScope. It provides rich, detailed data to help solve security data requirements, application troubleshooting, and container performance monitoring. AppScope has nearly unlimited power to capture events and metrics to power your observability strategy.
Cribl AppScope is just one example of how we’re rapidly evolving to meet the needs of its users. AppScope is just that easy and powerful. Try Cribl’s free, hosted 30-minute AppScope Sandbox. I’d love to hear your feedback; after you run through the sandbox, connect with me on LinkedIn, or join our community Slack and let’s talk about your experience!
The fastest way to get started with Cribl Stream is to sign-up at Cribl.Cloud. You can process up to 1 TB of throughput per day at no cost. Sign-up and start using Stream within a few minutes.