Telemetry involves the automatic gathering, processing, and transmission of data from distant or inaccessible points to a central location for analysis and monitoring.
A nurse in a hospital is far too busy to watch every patient every minute. She relies on telemetry to monitor their vital signs, such as their blood pressure, and alert her if their condition worsens.
Telemetry systems automatically collect data from sensors, whether they are attached to a patient, a jet engine or an application server. It then sends that information to a central site for performance monitoring and to identify problems.
Telemetry was developed to automatically measure industrial, scientific and military data from remote locations. These included tracking how a missile performed in flight or the temperatures in a blast furnace.
In the world of IT and security, telemetry data monitors metrics such as application downtime, database errors, or network connections. This data is the raw material for observability – understanding how well applications and services are working, and how users interact with them.
How Does Telemetry Work?
When telemetry monitors physical objects, it relies on sensors that measure characteristics such as temperature, pressure or vibration. When telemetry is used to monitor IT systems, software agents gather digital data about performance, uptime and security. They send that data to collectors that process the data and transmit it for storage or analysis.
Telemetry data can be produced in multiple forms by different types of agents. It must thus be “normalized” or made to fit a standard structure for use by any analytic tool. Historically, normalization was done through a schema-on-write process, which required knowing the required format in advance and enforcing that schema before the data was logged. That process is no longer viable given the volume, variety and velocity of data produced by IT infrastructures. A more popular current approach is schema-on-read. This converts data into the required format before it is stored and analyzed.
Types of Telemetry data
The information produced by IT telemetry data depends on the system being tracked and how the data is used.
For servers, the data might include how close processors and memory are to being overloaded.
For networks, it might be latency and bandwidth.
For applications and databases, it might be uptime and response time.
Telemetry designed to detect attacks may include tracking the number of incoming requests to a server, changes to the configuration of an application or a server, or the number or type of files being created or accessed.
Telemetry data comes in three forms
Metrics
Numeric data such as the amount of time it takes to process a request, the number of incoming requests to a server or the number of failed requests.
Logs
Numeric data such as the amount of time it takes to process a request, the number of incoming requests to a server or the number of failed requests.
Traces
Shows the path taken by a transaction across infrastructure components (such as applications, databases and networks) and services (such as search engines or authentication mechanisms).
Check out our detailed blog post on the Pillars of Observability to learn more about them.
How Telemetry is Used?
The data gathered by telemetry can provide a real-time view of application performance, so teams can perform root cause analysis on problems, prevent bottlenecks, and identify security threats. For security monitoring, unusual network traffic patterns might indicate a denial of service attack. Unusual requests for data from an unknown application or repeated unsuccessful attempts to log into a user account may also signal an attempted hack.
Telemetry data can also be used to track how users are interacting with applications and systems. Such user behavior testing can help improve user interfaces and compare whether tweaks to applications and websites can increase user engagement or sales. Telemetry data can also help cut costs. By identifying and eliminating underused assets, such as cloud servers that are no longer needed, or helping plan and budget for infrastructure needs by identifying usage trends.
Telemetry from devices on the Internet of Things can do everything from tracking shipments to preventive equipment maintenance. This data can also enable new business models in which a company sells performance, maintenance or production data from equipment in the field.
Ways Telemetry is Used
Telemetry plays a crucial role in modern technology by providing real-time insights into system performance, security, and user behavior. Here are some key ways telemetry is used:
Track Real-Time Application Performance
Telemetry data helps organizations monitor the health and performance of their applications in real time. It enables teams to track key metrics such as response times, CPU usage, memory consumption, and throughput. By continuously collecting and analyzing this data, organizations can quickly detect performance bottlenecks or issues, allowing for rapid troubleshooting and optimization. This proactive monitoring helps ensure a seamless user experience and minimizes costly downtime.
Prevent Security Attacks
Telemetry is a critical tool for identifying potential security threats. By collecting data on network traffic, user behavior, and system logs, security teams can detect anomalies that may indicate malicious activity. With telemetry, organizations can set up alerts for suspicious behavior, such as unauthorized access attempts or unusual data transfers. This enables faster detection and response to security incidents, helping prevent attacks before they escalate. Telemetry can also support forensic investigations by providing detailed logs of events leading up to and during an attack.
Optimize Resource Utilization
Another powerful use of telemetry is optimizing resource allocation across IT infrastructure. By continuously gathering data on resource usage—such as server capacity, bandwidth, or storage—telemetry helps organizations make informed decisions about scaling their infrastructure. It enables teams to identify underutilized resources or anticipate capacity constraints, ensuring that resources are efficiently distributed and costs are minimized.
Enhance User Experience
Telemetry can provide valuable insights into how users interact with an application or system. By tracking user behavior patterns, organizations can identify areas where users may face difficulties or inefficiencies. This data can inform improvements in user interface design, feature development, and overall user experience, ensuring that the product aligns with customer needs and expectations.
Improve System Reliability
Telemetry helps improve the reliability of applications and infrastructure by identifying and addressing issues before they impact users. Continuous monitoring allows teams to track error rates, system crashes, or hardware failures in real time, enabling faster responses to potential failures. By leveraging telemetry, organizations can improve the overall stability of their systems, reducing downtime and maintaining higher availability.
Drawbacks and Challenges of Telemetry
Modern IT infrastructures generate very large data streams in a variety of formats. Not all of this data is critical or even important. It’s easy for system administrators and other IT staff to be overwhelmed by this data, and for storage costs to rise to unacceptable levels.
System administrators and software developers must thus decide what data is most important and how to transmit, format and analyze it. Each data transmission method has its pluses and minuses. One option is sending telemetry data directly from the application being monitored. This eliminates the need to run additional software and manage ports or processes. But if the sending application is complex and generates lots of data, sending that data could bog down the application or network being monitored.
System administrators and software developers must also find ways to minimize the cost of storing telemetry data. One option is to store all the data in a data lake, retrieving only what is needed for analysis when it is needed. Another challenge is how to gather and analyze information from older devices and applications that may not support telemetry. One example is networks that provide performance and health data using the Simple Network Management Protocol.
Another challenge is finding, acquiring, and deploying analytical tools, including those using artificial intelligence and machine learning, that can sift through Tbytes of data to uncover the incidents and trends that require further attention.
Telemetry Tools
Telemetry often relies on software agents running on the source systems to gather the data. In other cases, the source would be an application programming interface (API) to an application or monitoring tool. Connectors then manage the flow of data to multiple destinations and convert it to the protocols and data formats used by various analytical tools. Telemetry data also requires a storage site. This might be a data lake, a time-series database, or a security information and event management (SIEM) system.
Given the wide variety of sources of telemetry data, it can be useful to look for tools that comply with the OpenTelemetry Protocol, which describes the encoding, transport, and delivery mechanism of telemetry data between telemetry sources and destinations.
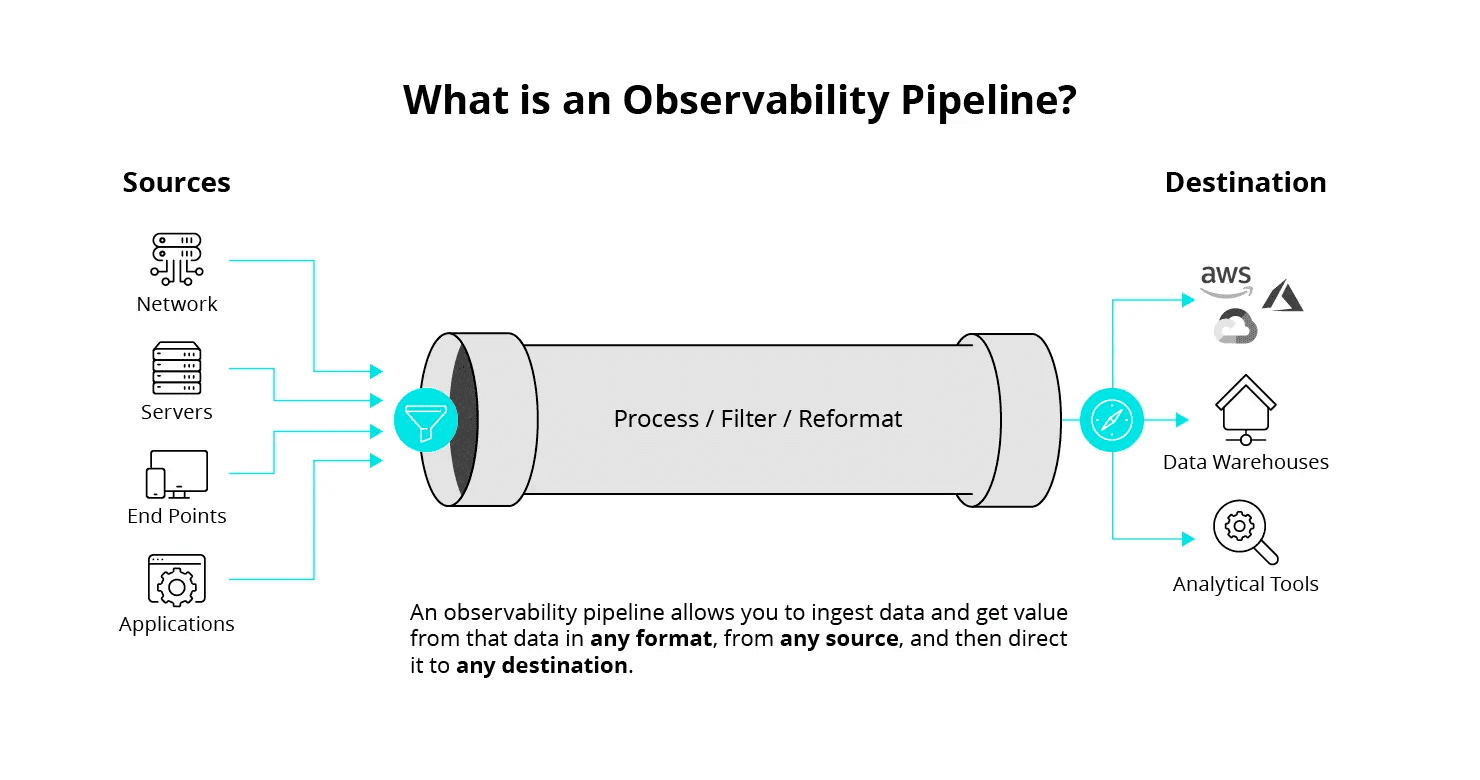
The Cribl Stream Observability Pipeline
One such tool is Cribl Stream – a vendor-agnostic observability pipeline. It provides out-of-the-box integrations between more than 80 pairs of data sources and integration tools, as well as data stores. It also allows organizations to convert data from one format to another on the fly. That means the data is ready for real-time analytics when it arrives at its destination.
Organizations can easily add new data sources such as data lakes and new destinations such as AI analytics tools using a drag-and-drop interface. Cribl Stream can cope with even the heaviest data loads, having been tested with volumes of more than 20Pbytes per day. Monitoring tools make it easy to ensure the right data is reaching the right destination.
These features, and more, make it easier to convert the raw material of telemetry data into insights that help keep the business running.
A Real-Time View Into Distributed Environments
The move to the cloud, mobile-first computing, and pandemic-driven remote working have made IT infrastructure more critical. But it has also made it complex and distributed. When manual troubleshooting is no longer enough, telemetry is the first step towards the observability required to proactively assure quality service to customers, employees, and business partners.
Frequently Asked Questions about Telemetry
What is the difference between telemetry and monitoring?
While both telemetry and monitoring involve observing system performance, telemetry focuses on collecting and analyzing data from remote sources. Monitoring often involves setting up alerts and thresholds to detect anomalies, while telemetry provides a deeper understanding of the underlying system behavior.
How can telemetry help improve application performance?
Telemetry data can be used to identify performance bottlenecks, optimize resource allocation, and pinpoint the root causes of issues. By understanding how applications are behaving in real-time, organizations can take proactive steps to improve performance and user experience.
What are the challenges associated with implementing telemetry?
One of the main challenges is managing the large volumes of data generated by telemetry systems. Organizations must carefully consider data storage, processing, and analysis to extract valuable insights while minimizing costs. Additionally, integrating telemetry with existing systems and tools can be complex, requiring technical expertise.
How can telemetry be used to enhance security?
Telemetry can help detect security threats by monitoring network traffic, user behavior, and system logs for anomalies. By identifying unusual patterns or suspicious activities, organizations can proactively address security vulnerabilities and prevent breaches.