It’s quite common for data from a Search to contain references to information that is, well, unintuitive. Error or Message Codes, Port Numbers, Reference IDs, and Customer Numbers are all useful pieces of information, but far from being human-readable. That information is often available in a collateral location, often a spreadsheet or database, where it can be looked up with a “key” field. So a Customer or Product may have a unique identifier that consists of an arbitrary alphanumeric string which is not intuitive for human inspection. However, when joined with information in the lookup table, the original data regains meaning and becomes more useful and intuitive for analysts.
In Cribl Search, lookups are top-level objects that can be created, edited, and destroyed by users. There are three ways of interacting with a lookup:
Using the Lookup within a Search pipeline to enrich those Search Results
Creating the Lookup by importing a CSV file
Creating a Lookup as the results from a Search
This Blog will discuss all three methods of interacting with a Lookup. We will use the default dataset that is included within Cribl Search – “cribl_search_sample”. The examples in this Blog require Cribl Search 4.2.2 or later.
Using an Existing Lookup to Enrich Your Search
If we run a search on the built-in “cribl_search_sample” dataset, and choose dataSource to be “vpcflowlogs”, we’ll see example data stored in Amazon S3. This dataset is built-in to every Cribl Search instance and contains automatically-generated artificial data in the format of AWS VPC Flow Logs. This data is parsed using the built-in AWS Datatype, specifically the rule called “aws_vpcflow”, so the unstructured data has structure applied at read time. Notice existing fields like srcaddr, dstaddr, and dstport are automatically parsed as named fields.
dataset="cribl_search_sample" dataSource="vpcflowlogs"
| limit 1000 
The destination port is a Layer-4 construct in the OSI stack and generally specifies the service type. Common destination ports are 22 for SSH, 23 for Telnet, 80 for HTTP, and 443 for HTTPS. The full port list can be found here.
However, a truncated version of that list is automatically provided as a default in your Cribl Search instance. It can be found in the Data menu under Lookups, and is called “service_names_port_numbers”.

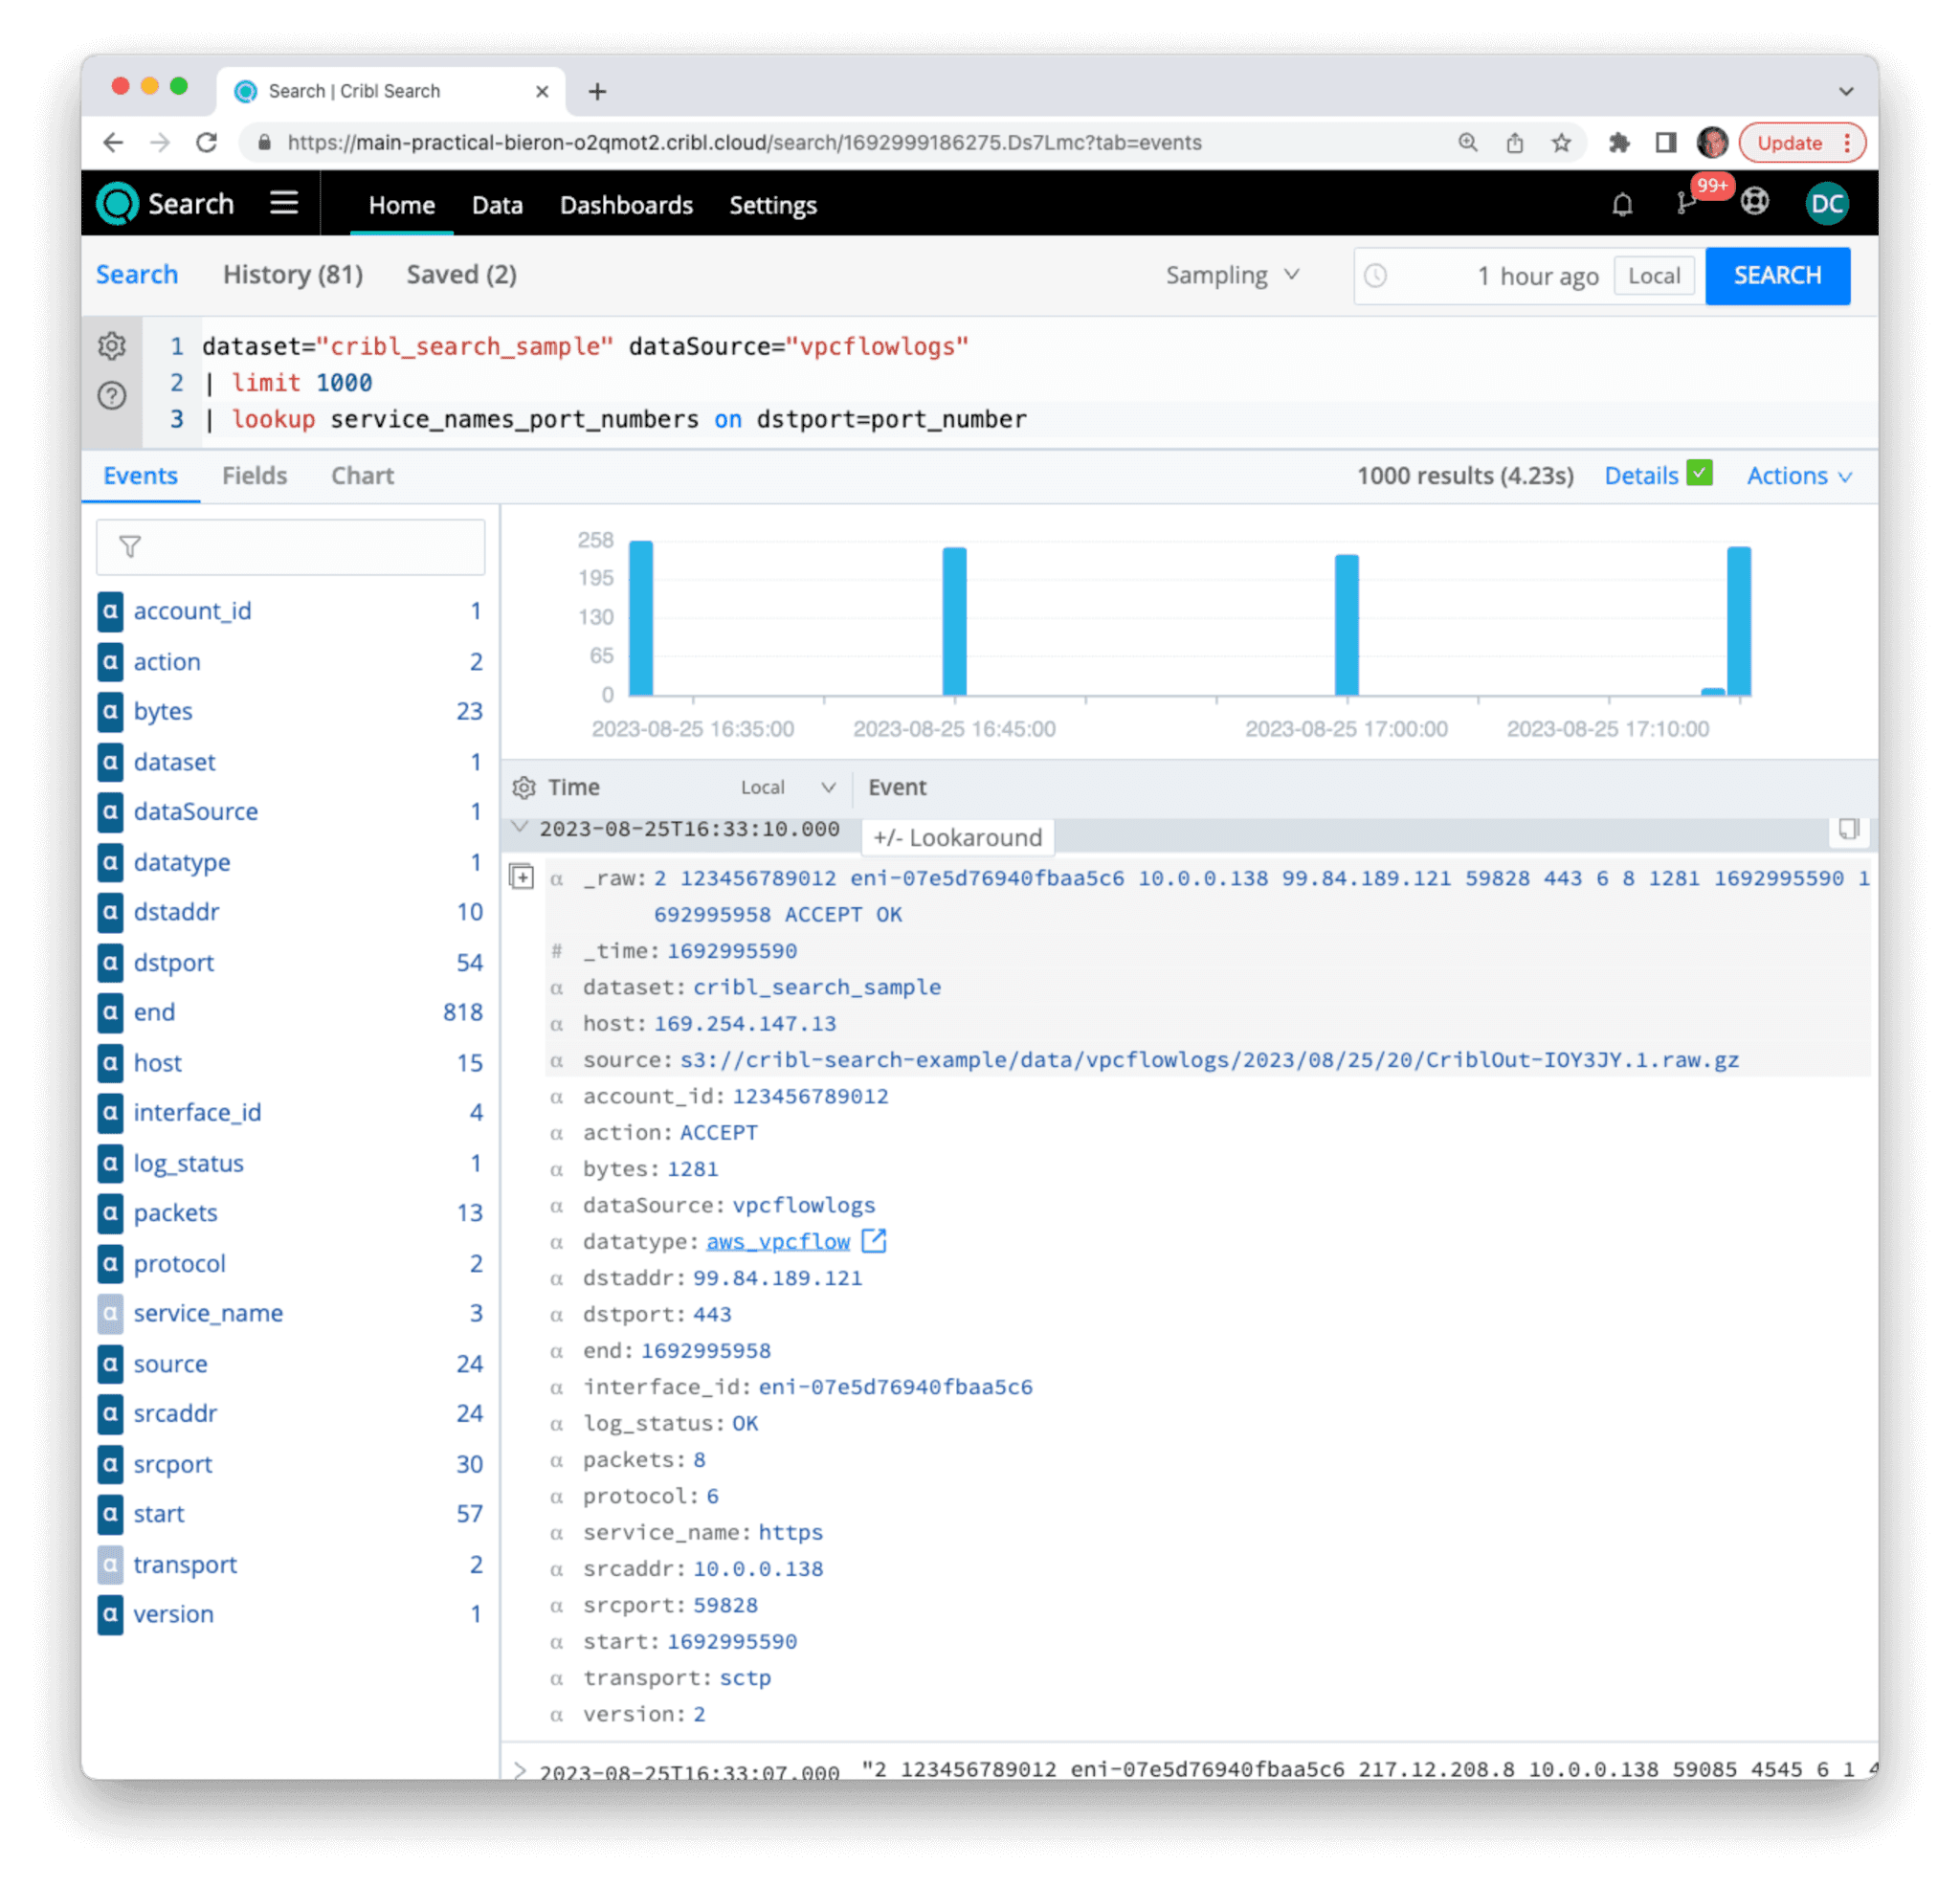
You can perform a lookup on the dstport field in your data using the lookup operator. Using the lookup operator is straightforward: add a lookup to your pipeline and specify the field in your search and the field in the table that should be looked up. If a field in your pipeline matches any row in that field in the lookup table, the rest of the fields are added to the search event. If not, nothing is added to that event (but all existing fields do remain). This is equivalent to a “left outer join” in relational terminology.
dataset="cribl_search_sample" dataSource="vpcflowlogs"
| limit 1000
| lookup service_names_port_numbers on dstport=port_number 
Here we see that for the displayed event, the destination port (dstport) is equal to 443, matching a port_number entry in the service_names_port_numbers.csv lookup table. As a result, all other fields in that table (transport and service_name) are added to this particular event. If an event does not contain a matching value for port_number, it remains unchanged.
Once you have added these additional fields to your event set, you can operate on them as you would any other field. In this example, we can now summarize by service_name. Note that there are many events where the dstport field does not match an entry in the lookup table (since it’s a truncated version of the full IANA list, and the data is artificially generated), so we can add a test to see if the field exists (is not null) before summarization.
dataset="cribl_search_sample" dataSource="vpcflowlogs"
| lookup service_names_port_numbers on dstport=port_number
| where isnotnull(service_name)
| summarize count() by service_name 
We can then set the visualization type to “pie” and that will display this useful chart showing the percentage of known Service Names in your data. Note that we can get rid of the limit 1000 clause since no matter how large the dataset is, the cardinality of our result set is bounded by the total number of possible Service Names. In this case, our lookup table has only about 1000 rows, so that’s the largest number of values we could have in our pie chart.
Creating a Lookup by Uploading a File
The easiest way to create a lookup table is to upload a CSV file from your local workstation. In the Data -> Lookups tab, you can click on the “Add Lookup File” button in the upper-right-hand corner of the window. This gives you two options: Upload a new File or Create with Text Editor.
Select Upload a New File, and then choose an appropriate CSV file from your local host. Cribl Search will upload the file and return you to the Lookup tab.
Alternatively, you can create a new file in the local text editor.
As a reminder, since you’re going to use the field names as a reference, the CSV file should have a first row being a header row, with the names of each field. The field names should also not contain spaces or other special characters (underscores are ok) to make them easier to reference without escape characters. If you need to tweak the names of the fields, you can do that in the text editor after the file is loaded, or on your host before you upload it.
This is a good example of a text file that contains the full Service Names file from the IANA. If you use this one, remember to rename it on your local system so it doesn’t collide with the built-in service_names_port_numbers.csv file. Our recommendation is service_names_full.csv.
Creating a Lookup as a Search Result
One additional way of creating a lookup table is to use the result of a Search in conjunction with the export operator. This can be used as a way to capture the results from one search and use them to enrich the results of a second search. Commonly, one would use this to find a set of significant data using one Dataset Provider and then join that with the events of a second Provider.
Here, we create a somewhat naive scenario, as follows:
Since VPC Flow Logs represent a time-series of connections into your VPC, they are representative of hosts attempting to access resources provided by hosts inside that VPC. Your VPC policy controls which hosts and services are allowed and which are rejected. The “action” field within each Flowlog specifies what action was taken as per your policy. So we can presumptively assume (again, somewhat naively) that any “rejected” flow attempt must have originated from a host that is not authorized to use the resources inside our VPC, so we could consider that host, in some sense, “suspicious”.
The following search collects the source address from any flow log marked as “rejected”.
 dataset="cribl_search_sample" dataSource="vpcflowlogs" action="REJECT"
| summarize count() by srcaddr
| extend hoststatus="suspicious", lastseen=now()
Now we have a table of suspicious hosts with a label as the host status and an epoch time when we last saw that host.

Once we’ve done that, we simply add the export operator to save the results directly into a lookup.
dataset="cribl_search_sample" dataSource="vpcflowlogs" action="REJECT"
| summarize count() by srcaddr
| extend hoststatus="suspicious", lastseen=now()
| project-away count_
| export to lookup watchlist
This search now creates a lookup called “watchlist” that can now be used on other VPC Flowlogs, or any events that contain IP addresses to check for behavior to or from those “suspicious” hosts. The search could be even saved as a scheduled search and re-executed at some desired interval.

Wrap up
There are many ways to use lookups to enrich your data. Lookups are a powerful tool to add human readability and data fusion to primary data sets to make them more intuitive. Lookups are added to a search using the lookup operator. You can create lookups from flat files, by entering them manually, and as the results of a search using the export operator. We hope this discussion has given you some ideas of how lookups can enhance and improve the value of your Cribl Search experience! Ready to get started? Sign up for a free Cribl.Cloud account to gain instant access to Cribl Search.


