Tl;Dr – in v1.7 we introduced two very significant improvements that help you as a customer prove Cribl capabilities fast and efficiently. Read on for details!
Proof of Concepts (PoCs) are awesome! Our enterprise customers love them, they’re invaluable. The most effective PoCs are self-run as they naturally surface LogStream’s capabilities and concretely demonstrate our value props. Effective PoCs are well-defined and to the point. Nearly all customers setup and follow a simple process to keep them in check and improve chances of a successful outcome. High level, the process looks like this:
PoC Planning (Define objectives and success criteria)
PoC Engagement (The actual technical PoC)
PoC Evaluation (Discussion with key stakeholders and closing)
One of the core value props of Crib LogStream is that we make working with machine data super easy and a short PoC should highlight and reflect that. Of all the steps above the one with the most pitfalls is number 2. Getting the PoC environment ready, deploying instances, identifying data sources, opening firewalls rules, sending data sources to Cribl LogStream etc. can all lead to unnecessary delays and conspire against your success.
In the last few months we’ve added a variety of features to make it easier for our customers run PoCs on their own – ranging from UX improvements, to more functions, more sources and more destinations. In the latest version of LogStream we’ve added two more.
Cribl LogStream v1.7 to the rescue!
LogStream 1.7 ships with two very notable improvements that help PoCs move even faster – especially in Splunk environments. Let’s take a look:
Native Binary: There is no longer a Node dependency and everything that Cribl LogStream need to run is now included in a single package. This is fantastic as it removes an obstacle that lengthened the PoC process (and production deployments, too) – our customers would need change requests to install the correct version for the correct platform etc.
Cribl App for Splunk: The Splunk app package for Cribl LogStream now ships on Search-Head Mode by default and contains a custom command called
|criblstream. This is an incredibly powerful command that allows users to take the output of any search, including real-time searches, and send it over to LogStream via TCPJSON. It is now ridiculously easy to take events from a Splunk index and send them to Cribl making this the most powerful lever that we’ve shipped to our customers for rapid PoCs.
Why is LogStream in SH mode such a big deal?
Getting access to data by inserting LogStream in the ingestion pipeline is by far the most time consuming aspect of a PoC. It’s not a hard task by any measure but in enterprise environments this step requires coordination amongst many teams; data producers, network, security, ops etc. and that takes a long time.
LogStream in SH mode solves this problem by offering a non-intrusive alternative. It is perfect for PoCs as it shortens the time to access this data significantly. In many cases, you have all the data you need to prove LogStream already sitting in Splunk. All you need now, for the purposes of the PoC, is a way to replay it. And that’s where |criblstream custom command comes in.
To be clear, being in the ingestion pipeline during the PoC is ideal, but the point of the PoC is not necessarily proving connectivity i.e. that LogStream can receive or send data. In the vast majority of the cases the objectives are: remove noise from high-volume data sources, secure sensitive information in real-time, and arbitrarily transform and route events to different systems. For all these, being on the SH is oftentimes sufficient. In fact, I’d argue that it is desirable as by replaying data at rest you get the on-demand repeatability and predictability of your data flow.
Get Started by Installing On A Splunk SH
Installing LogStream on a Splunk SH is as simple as installing a regular app. You can download the Cribl App for Splunk package from our site and then install either from the UI or directly from the filesystem. After the install, there will be a full-featured running Cribl LogStream instance on the SH awaiting PoC data.
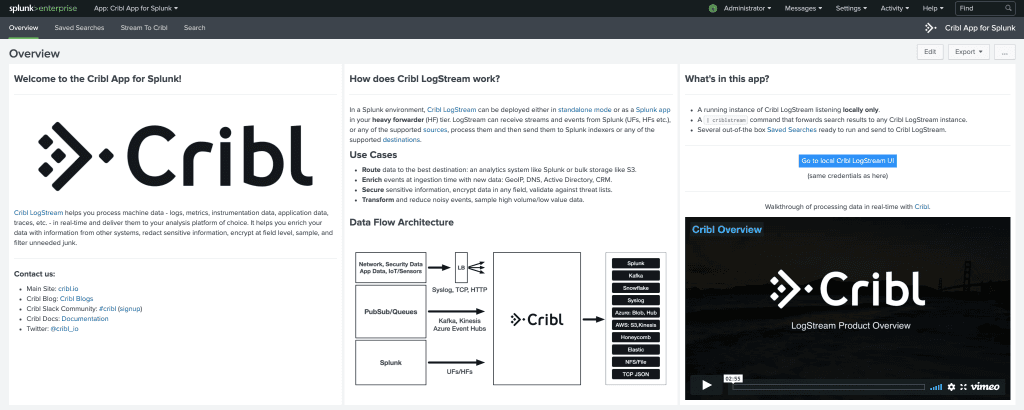
The |criblstream streaming command, mentioned above, has the following syntax:
<search> | criblstream <dest-option>? <token-option>?By default, it sends its output localhost:10420 where the local LogStream instance is listening. Destination and token are optional but can be used as below if trying to send to a different receiver.
<search> | criblstream dest=localhost:11111 token=tcpJsonToken123E.g., sending 1000 events to LogStream:
index=_internal | head 1000 | fields _raw | criblstreamWhat else is in the Cribl App for Splunk?
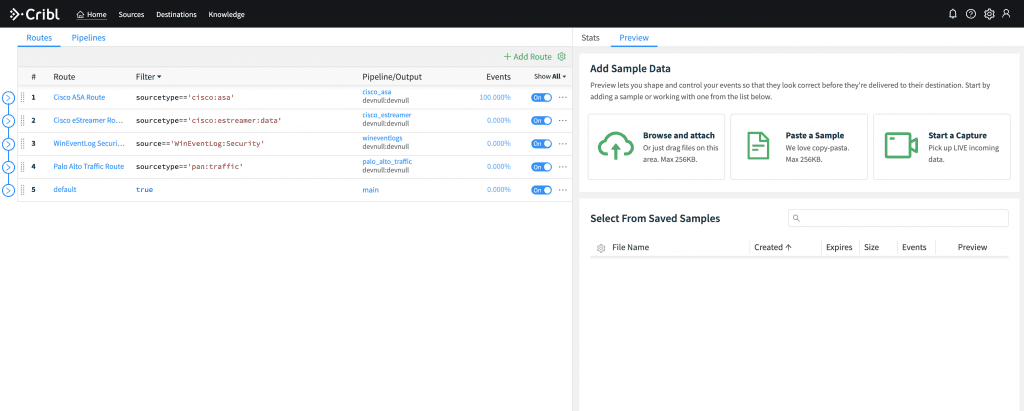
In addition to the command above the app has a list of Saved Searches that can be used to easily get started with a PoC. Each of the searches is built in such a way that matches one of the pre-configured LogStream pipelines.

Searches target each of the following data sources: Cisco ASA, Cisco EStreamer, Palo Alto Traffic and WinEvent Log Security. They can be run manually, for quick tests, or on a schedule if regular streams of data are needed. By default, this LogStream instance is configured to route all data it receives to devnull, but can be easily configured to send to a Splunk deployment or any other supported destinations.
Example Use-Case: Masking Data
Let’s run through a data masking use case. Let’s assume that you were required to obfuscate usernames in audittrail events.
Configure a Splunk indexer destination in Cribl LogStream.
Create a pipeline called
maskingPipelinewith:
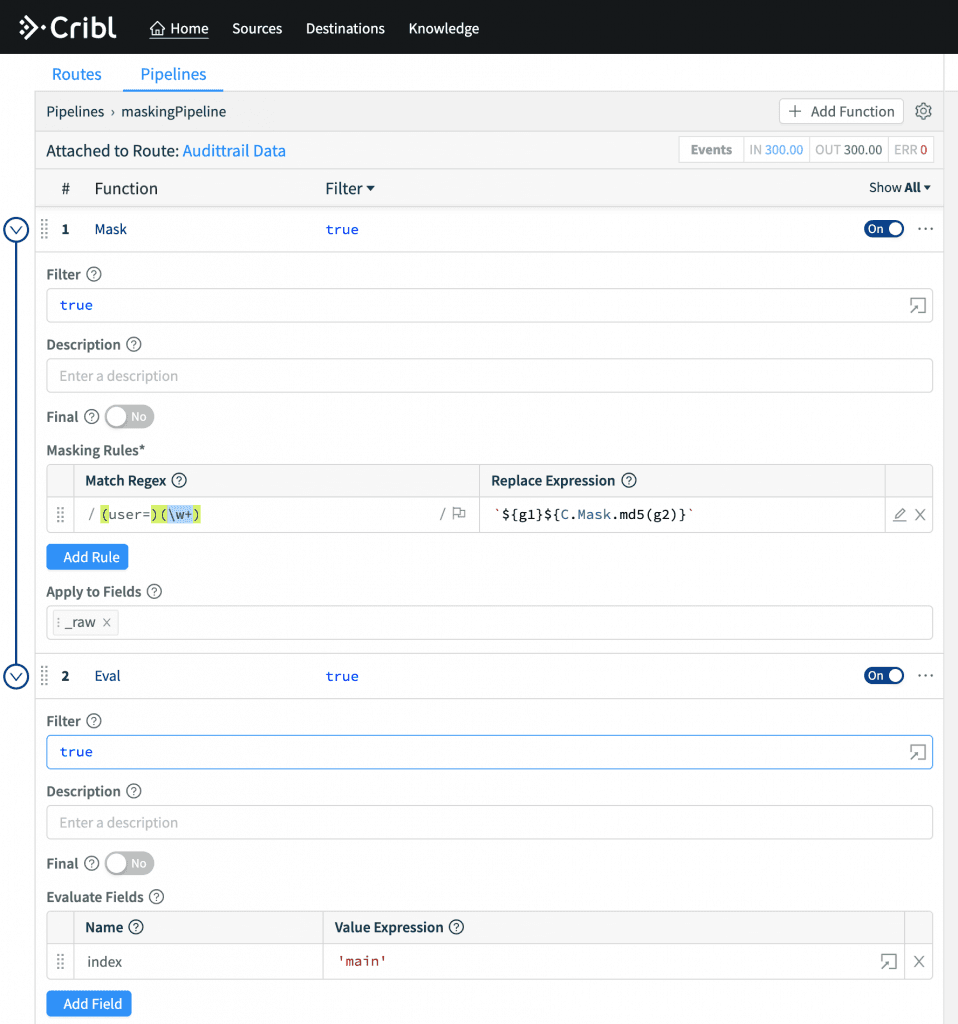
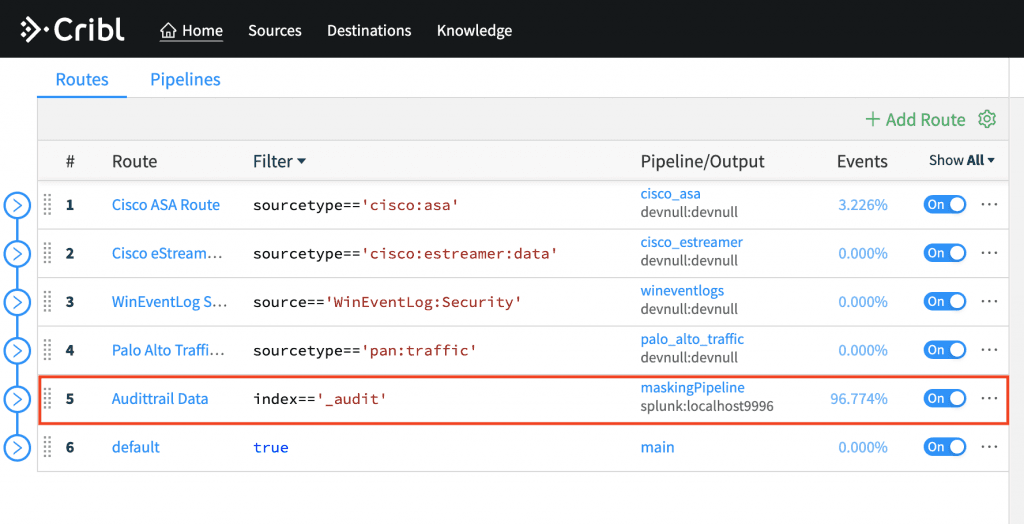
Attach pipeline to a Route that sends modified events to the Splunk destination (top step).
Set Filter to
index=='_audit'
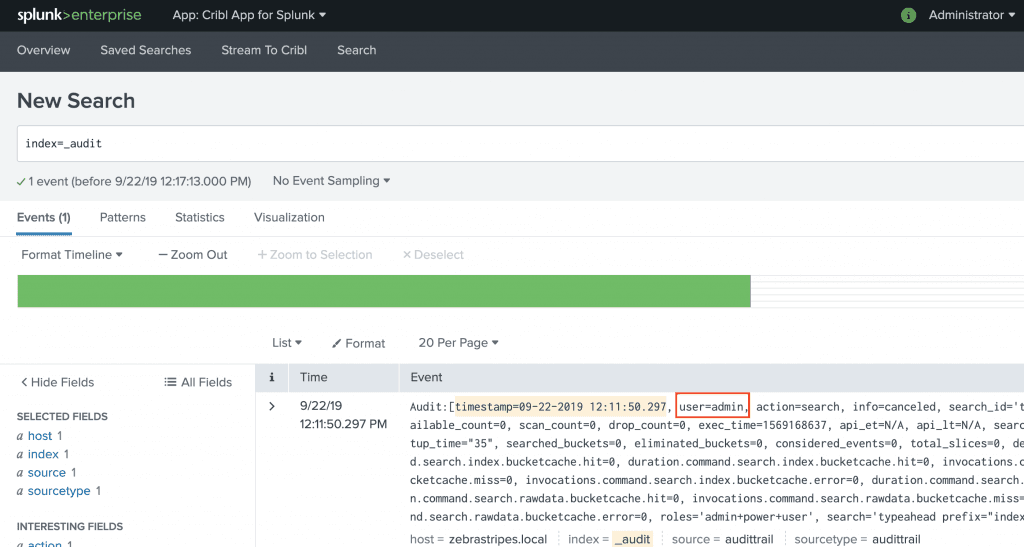
Run this search in Splunk to send data to CriblStream:
index=_audit user=* | head 100 | fields _raw index | criblstream
Run this search in Splunk to confirm that values of field
userhave been masked.index=main cribl_pipe::maskingPipeline
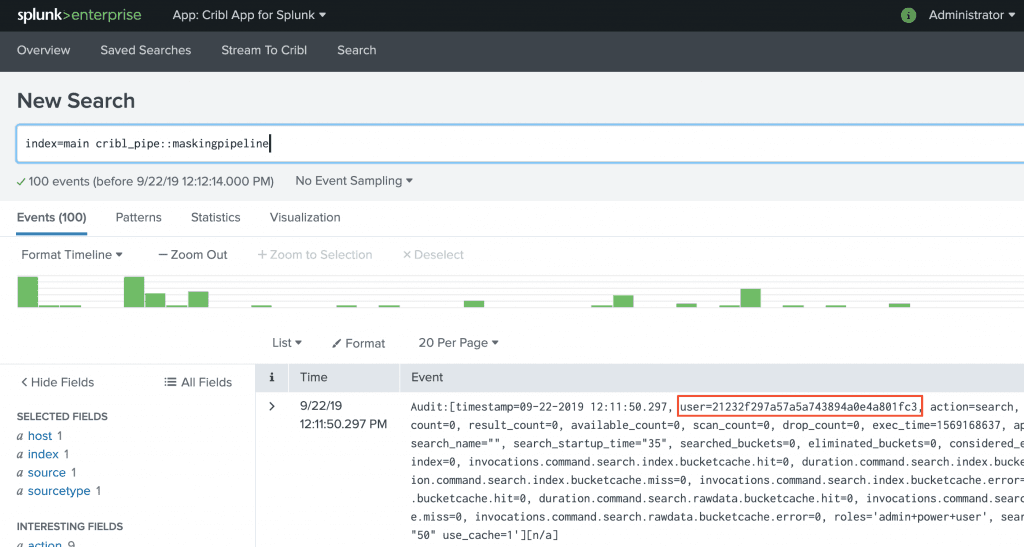
Notice the md5 hashed user value in this screenshot. That simple!
Example Use-Case: Noise Reduction with Build-in Pipelines
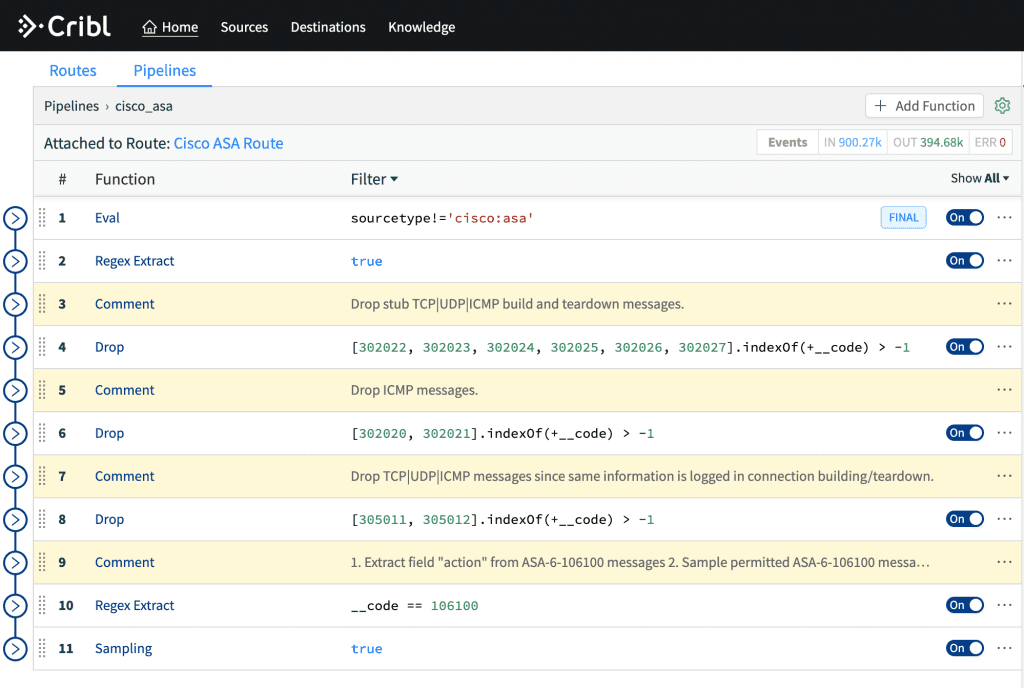
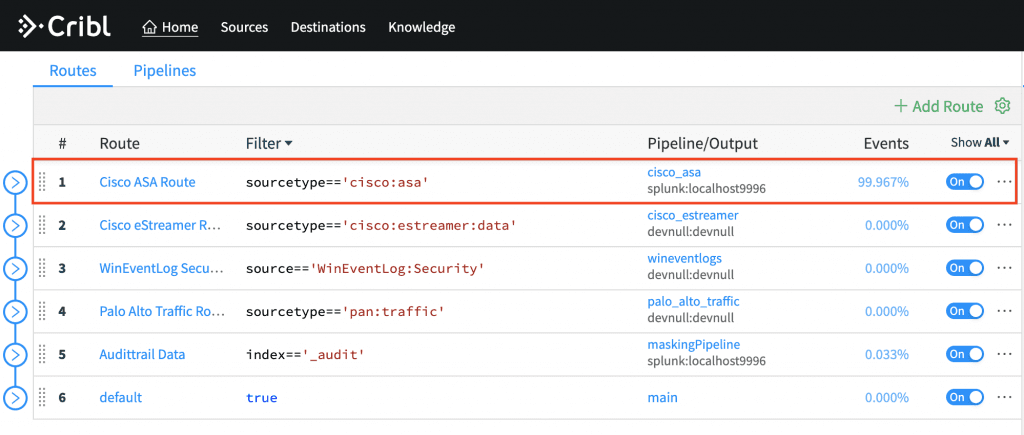
Let’s run another search but now one that targets a well-known data source; sourcetype="cisco:asa". For this source, Cribl LogStream ships with a pre-built pipeline called cisco_asa which contains a number of functions that remove unnecessary stub teardown messages, drop certain superfluous ASA-codes as well samples at 10:1 all permitted flows.
Change the Route destination from
devnullto Splunk
In Splunk run a search targeting the ASA logs:
index=* sourcetype="cisco:asa" | criblstream
In Splunk run a search to see pre- and post-Cribl percent difference:
index=* sourcetype="cisco:asa" | stats count(eval(isnull(cribl_pipe))) as pre_cribl count(eval(isnotnull(cribl_pipe))) as post_cribl | eval reduction_pct=round(100*(pre_cribl-post_cribl)/pre_cribl, 2)

That’s it – it takes literally minutes to prove a noise reduction use-case!
Check out our docs for even more use cases; real-time data lookups/enrichment, high-volume, low value sampling, masking & obfuscation, encryption with RBAC decryption, etc.
Wrapping Up
To re-iterate one of the points above – the faster the process to prove the value, the higher the chances of a successful outcome. One of our core value props is to make working with machine data super easy and delightful. Saving our customers time and resources is a priority and PoCs must highlight and reflect that. With v1.7 we feel we’ve gotten closer to that ideal state!
If you’ve enjoyed reading this far and are looking to join a fast-paced, innovative team drop us a line at hello@cribl.io or join our community Slack!– we’re hiring!
