As a wise man once said, never ask a goat to install software, they’ll just end up eating the instructions. It may appear that the pesky goats have eaten some of those instructions or eaten too many sticker bushes to keep up with recent Microsoft Sentinel changes if you’ve tried configuring the CEF and Azure Connected Machine Agents. This guide is for you whether you have spent considerable time trying to get these agents to work or just dabbling in the Sentinel waters!
TL;DR: Bleat the Shenanigans, and Use Cribl Instead
If you want to avoid this headache, just use Cribl Stream. We have a much simpler way, and we’ll give you up to 1 TB/day for free through Cribl.Cloud! Sentinel is particularly relevant since the agent collection process can be confusing to configure and install. Here are some of the advantages of using Cribl over native Sentinel agents:
- Reduce data collection overhead and complexity – Simply deploy a Cribl Syslog and/or Windows Event listener and point your data sources at it. No need to spend hours configuring, deploying and scaling Rsyslog, AMA agents, and Azure Arc.
- CEF Syslog Conversion – In order to take advantage of the rich security features of the CommonSecurityLog Sentinel table, the data must be sent in a CEF-based format. Most vendors support this log format, but it often requires configuration changes which can cause unnecessary downtime and uncertainty. Cribl can convert native Syslog formats from vendors such as Palo Alto Networks, Extrahop, Fortinet, and Cisco into CEF for you before it goes to Sentinel enabling you to get up and running quickly. Simply point your applications and devices at the Cribl listeners (Syslog/Windows Event), and you are good to go!
- Optimize your data – Enhance your data with DNS lookups, obfuscate PII, and/or archive your data into an Azure Blob storage bucket for storage that is pennies on the dollar cheaper than storing in Sentinel! Easily replay that archived data if required. The possibilities are endless!
The goats here at Cribl have also helped dozens of clients integrate Sentinel data from many vendors including Palo Alto Networks, ExtraHop, Fortinet, and Cisco.
In addition, Cribl has also added the native Sentinel Destination. With a product that helps easily get data into Microsoft Sentinel and the expertise that Cribl brings to help you on your Sentinel journey, what do you have to lose? Reach out to one of our sales folks for a customized demo if you’re ready to take the next step! We also have cloud-hosted sandboxes if you want to put your hands on the product right now.
Goats’ Hilarious Attempt at Sales Pitch Goes Baa-dly Wrong – Guide for Configuring the Azure Connected Machine and CEF Connectors in Microsoft Sentinel
OK fine! You didn’t fall for my shameless sales pitch. That’s OK. I’m not getting paid by the hour and I’m more of an engineer type so my sales pitches tend to fall flat. At Cribl, we want to demystify the process of installing and configuring Microsoft Sentinel AMA and CEF collectors so you can get started quickly.. And I get to pad my fragile ego with a technical blog.
To get familiar with common Sentinel terms, check out the glossary at the end of this blog.
Components
Here’s a high-level overview of the components and configurations for the Arc agent.
- Arc registration – The first step is to register our server with Azure Arc so that Azure can manage and install things on it.
- Data Collection Rule – It will tell the Arc server what data to collect, where to send log analytics data, and automatically install the AMA agent.
- AMA agent – Comes in two flavors. Will be automatically installed when configured with the DCR.
- Rysyslog or Syslog-ng (Linux only) – If you are installing the arc agent on Linux, you need to install and configure Rsyslog and/or Syslog-ng if you prefer. This guide only covers Rsyslog.
Prerequisites
Some prerequisites before you begin:
Linux Azure Connected Machine Agent
OK! We are finally ready to install the Azure Linux Monitor agent!
Step 1: Configure Rsyslog
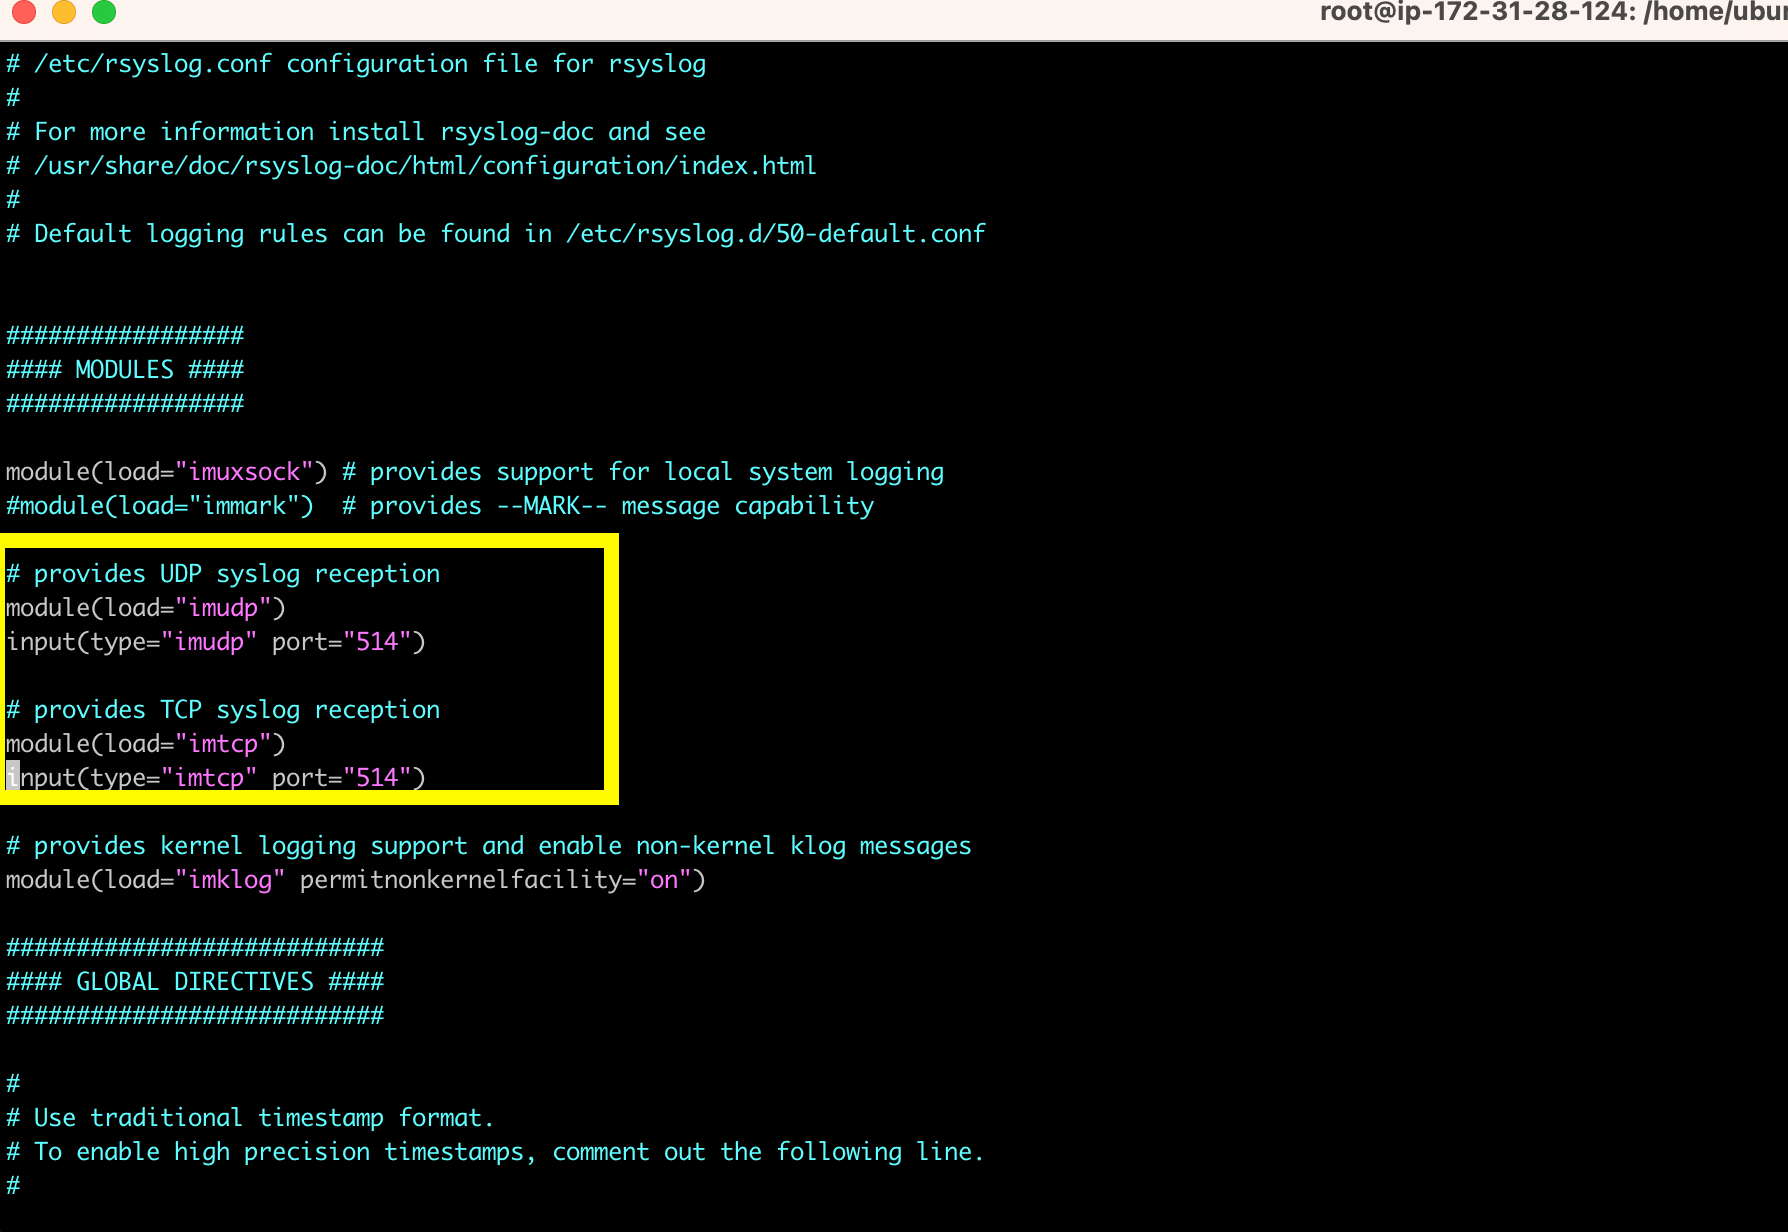
In order for the Azure-connected machine to work on Linux, we need to set up a syslog listener on port 514. You can use either Rsyslog and/or Syslog-ng. In my case, I’ll be using Rsyslog and the config file should be under: /etc/rsyslog.conf. If you do not see it and/or Rsyslog is not installed, you can install it via instructions here: https://www.rsyslog.com/ubuntu-repository/.
My Ubuntu 22.04 host came with Rsyslog already installed. I will check the config at /etc/rsyslog.conf and make sure that UDP and TCP syslog are listening. In my case, I had to uncomment the module and inputs for UDP and TCP.

Next, enable Rsyslog so it starts every time the host is started.
systemctl enable rsyslog
Start it.
systemctl start rsyslog
Confirm Rsyslog is listening on the correct by running:
netstat -tulpn
You should see Rsyslog listeners on both ports UDP/TCP 514.

Step 2: Connect your Linux Host to Azure Arc
Now that Rsyslog is running, it’s time to connect our Linux host to Azure Arc.
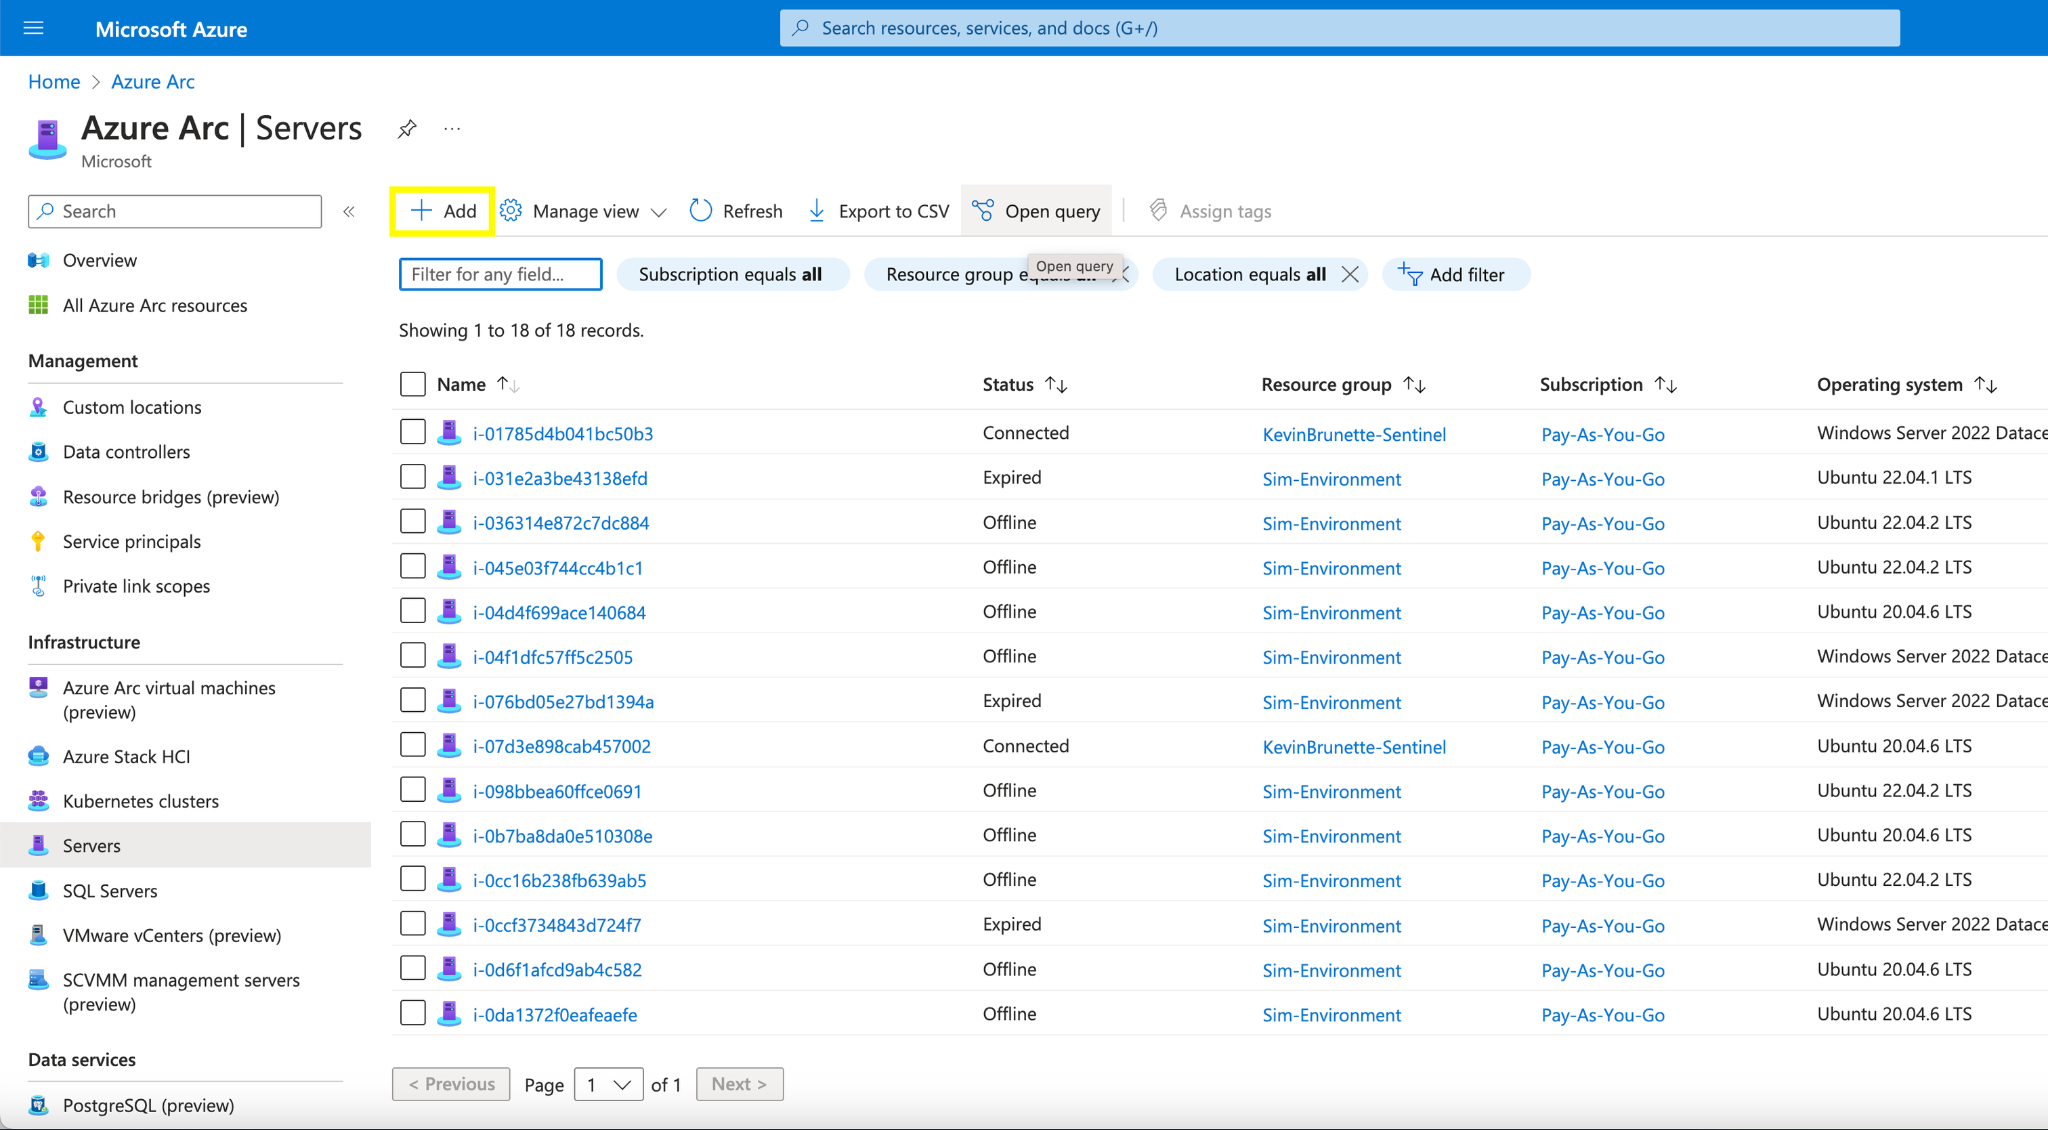
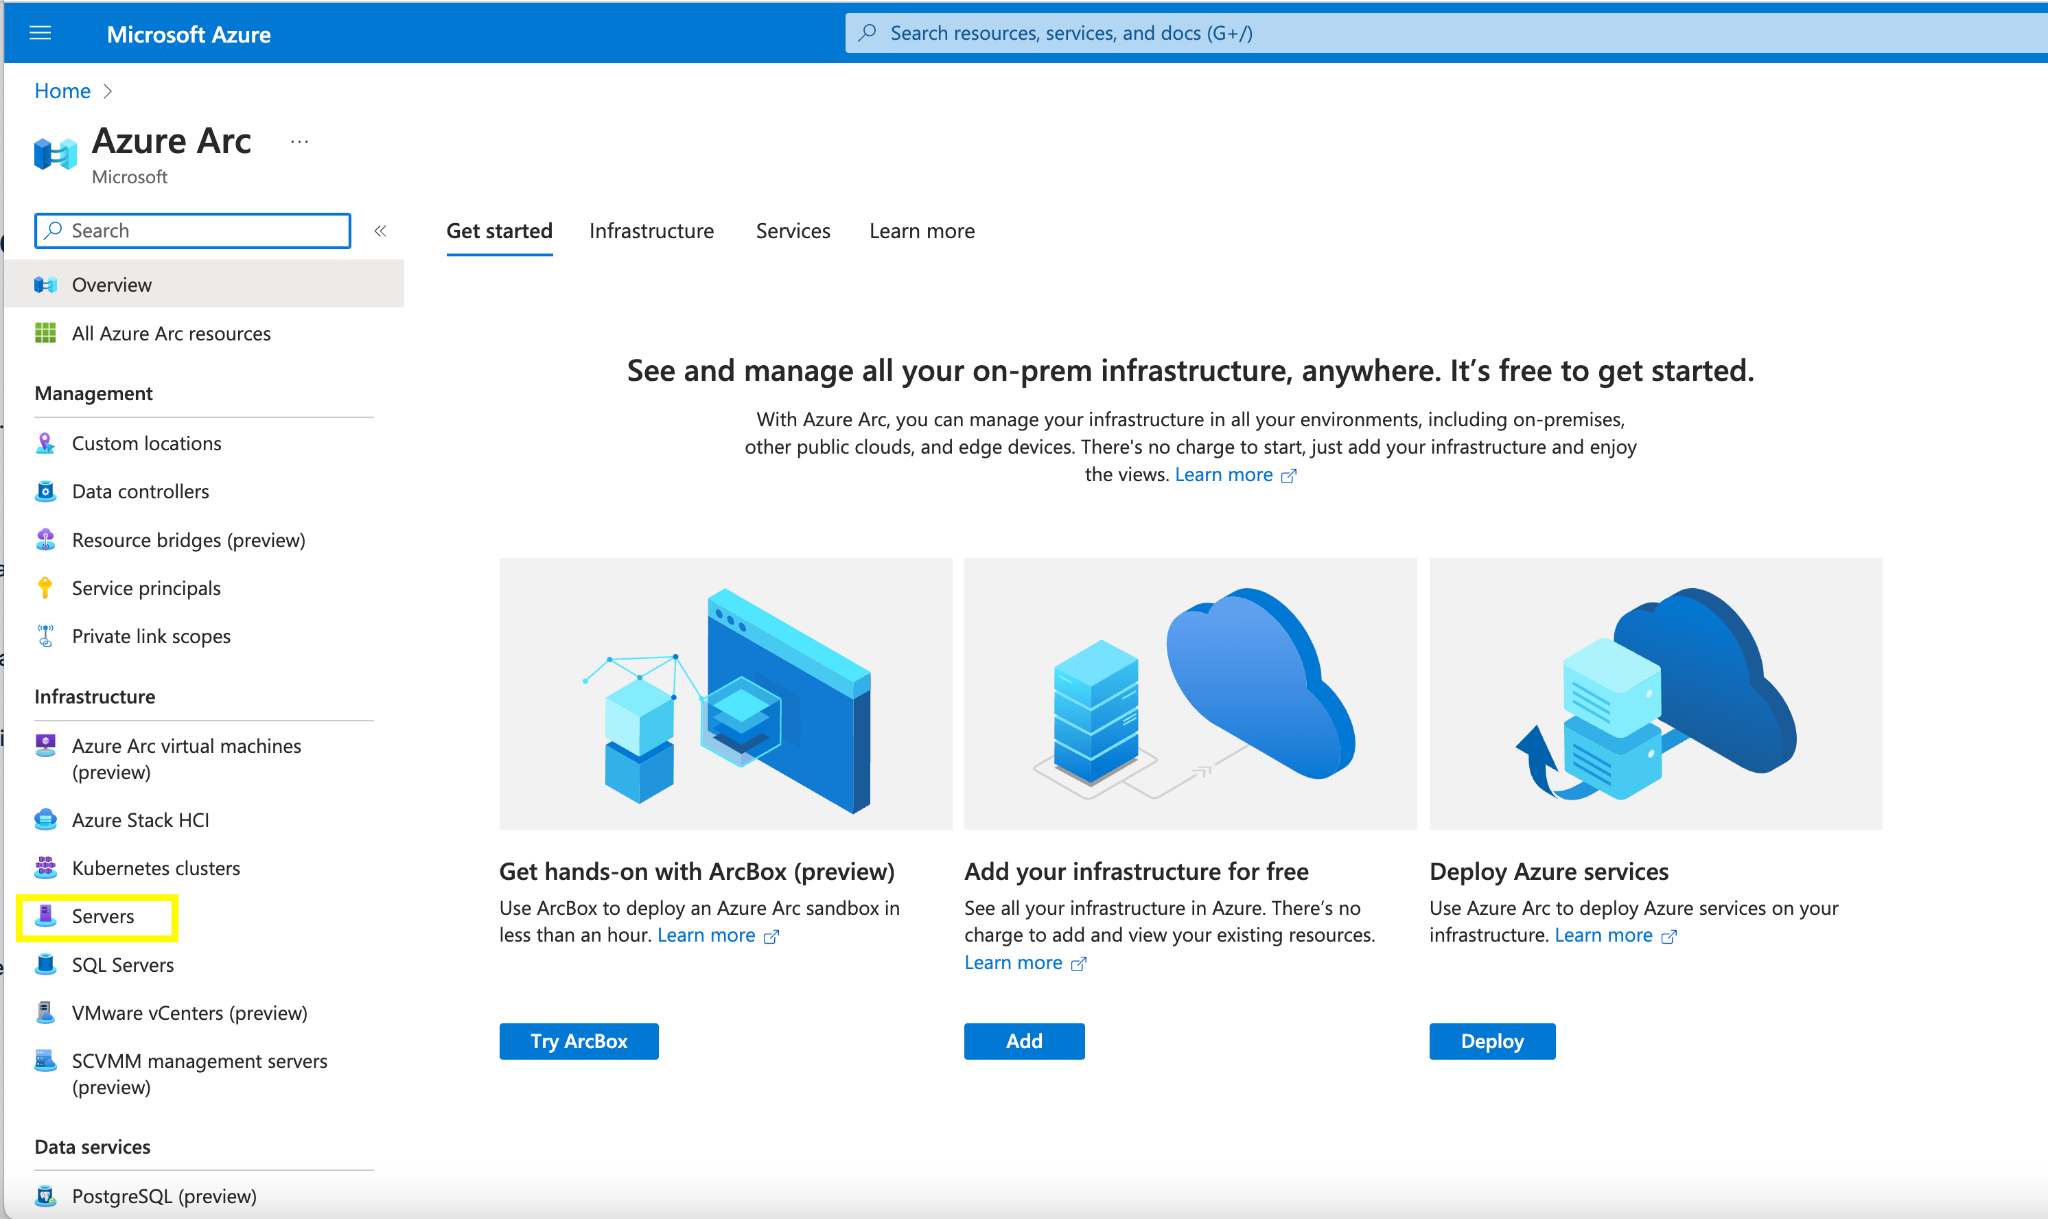
In Azure search for “Azure Arc” and within the “Azure Arc” pane, select “Servers” on the left rail.

Click the “+ Add” button on the top rail.

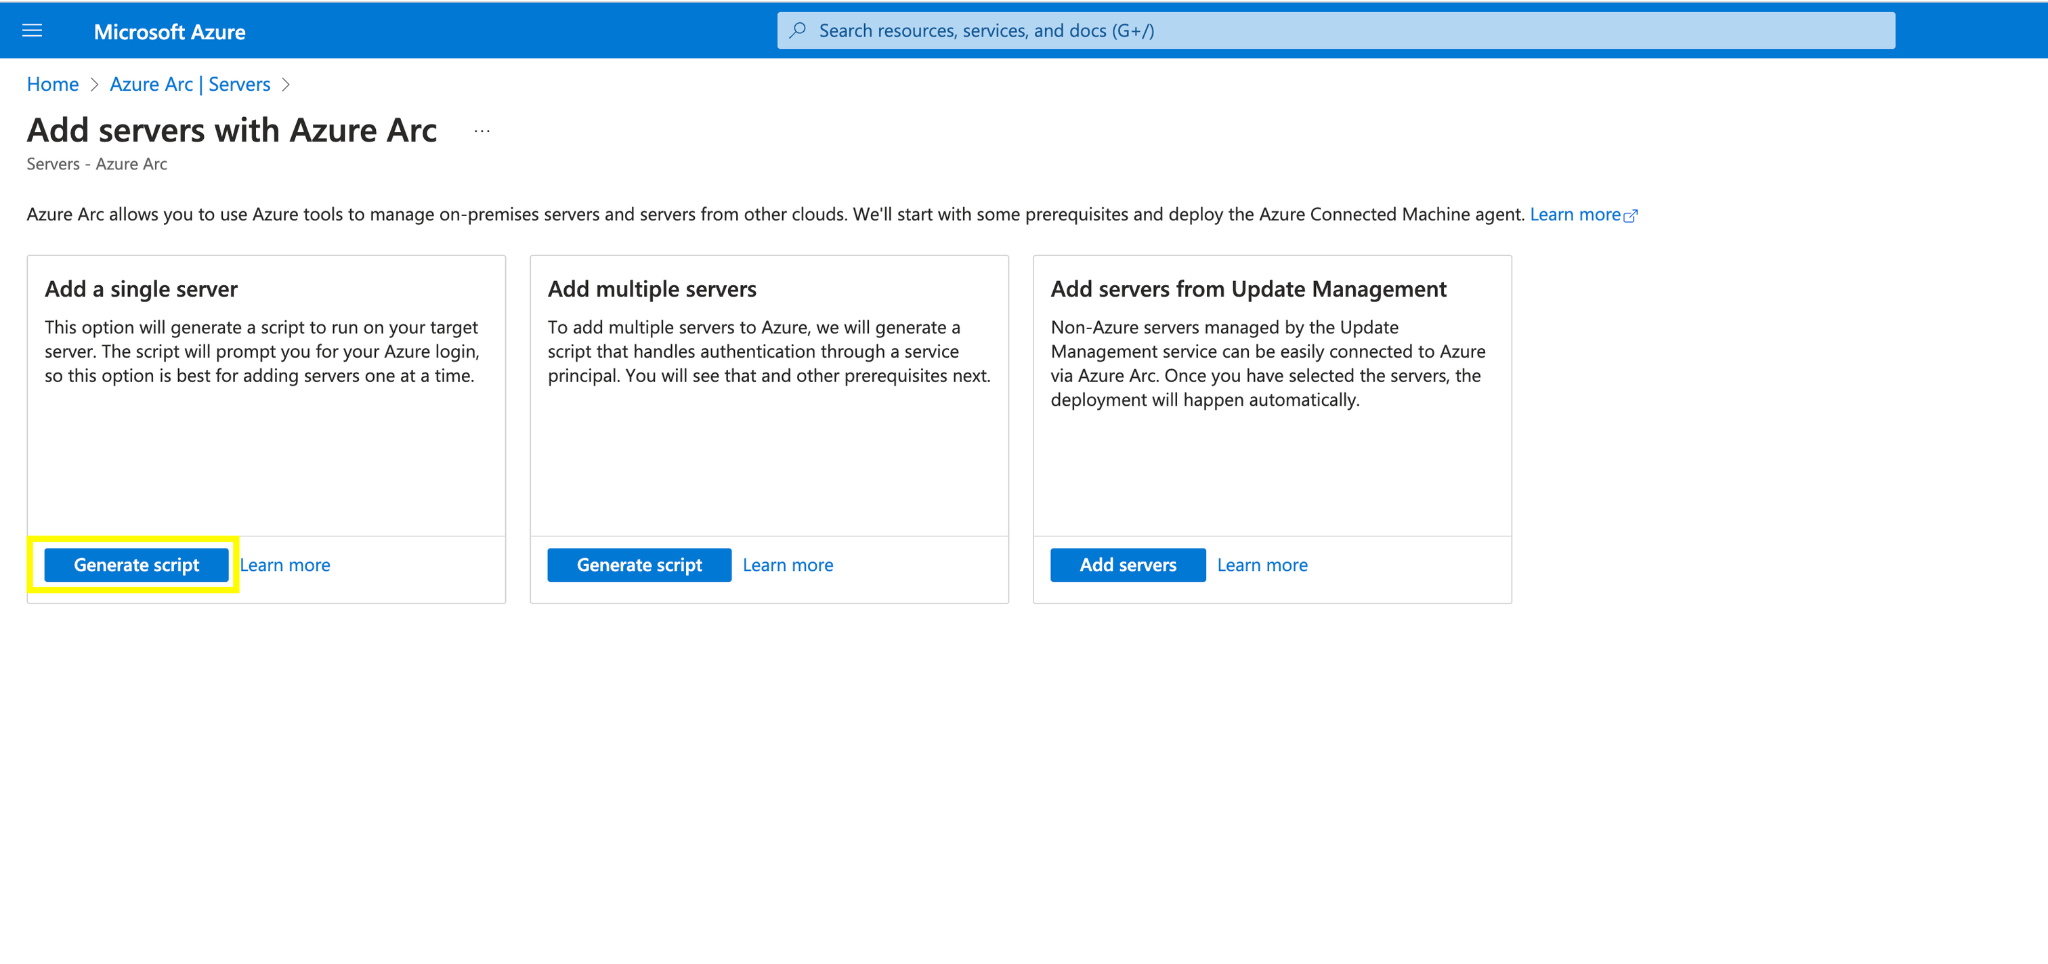
We’ll perform a single server installation. Other options are available for multiple deployment types but in our guide, we will just do a simple install of the script on a single host.
Under “Add a single server” click “Generate Script”.

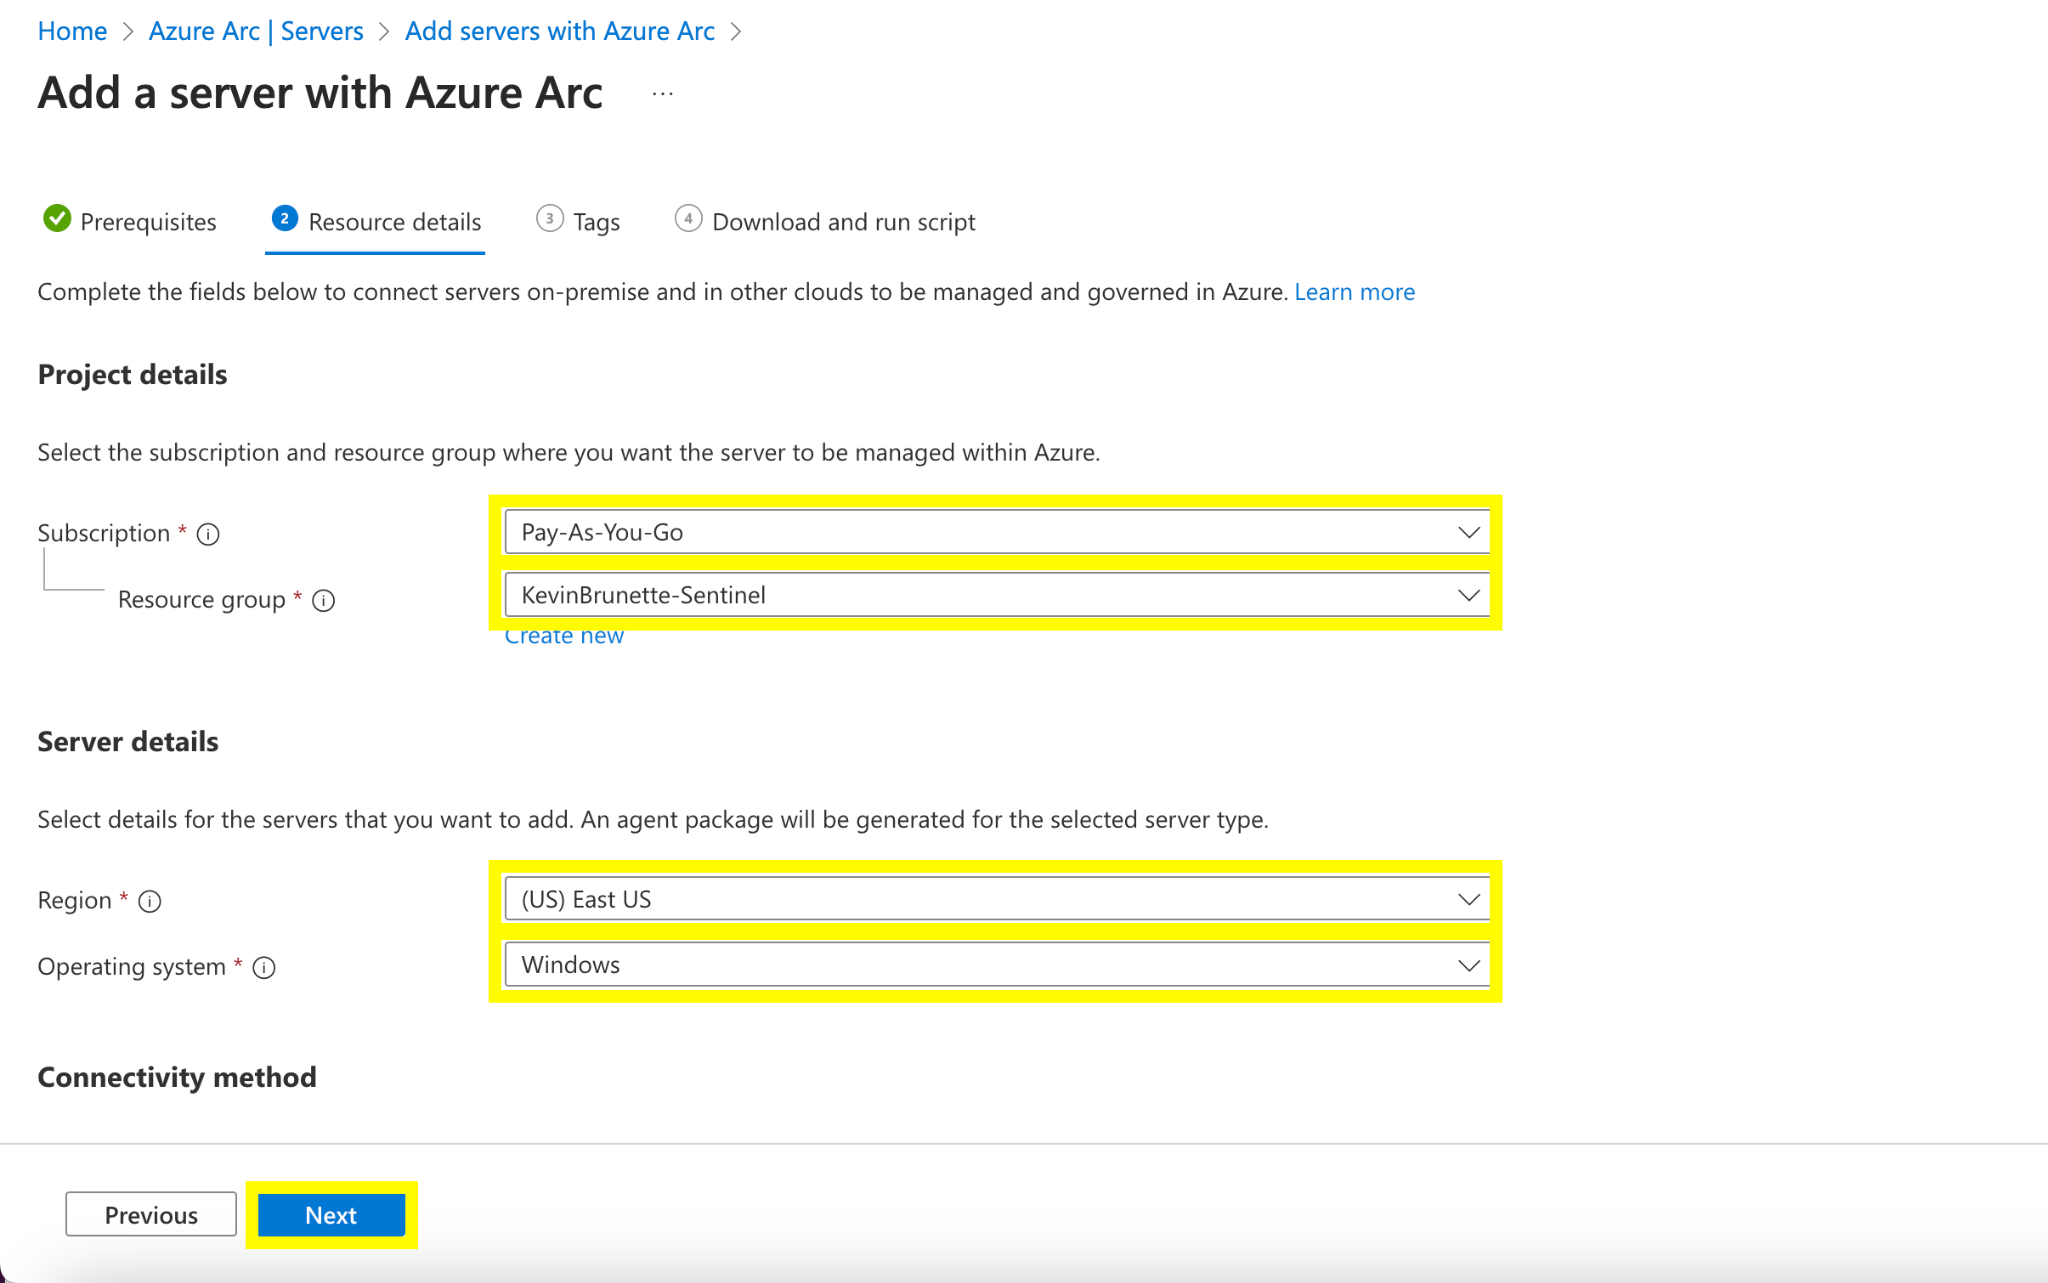
Fill in the appropriate resource details, location, and VM type. In this case, select “Windows” instead of “Linux”.

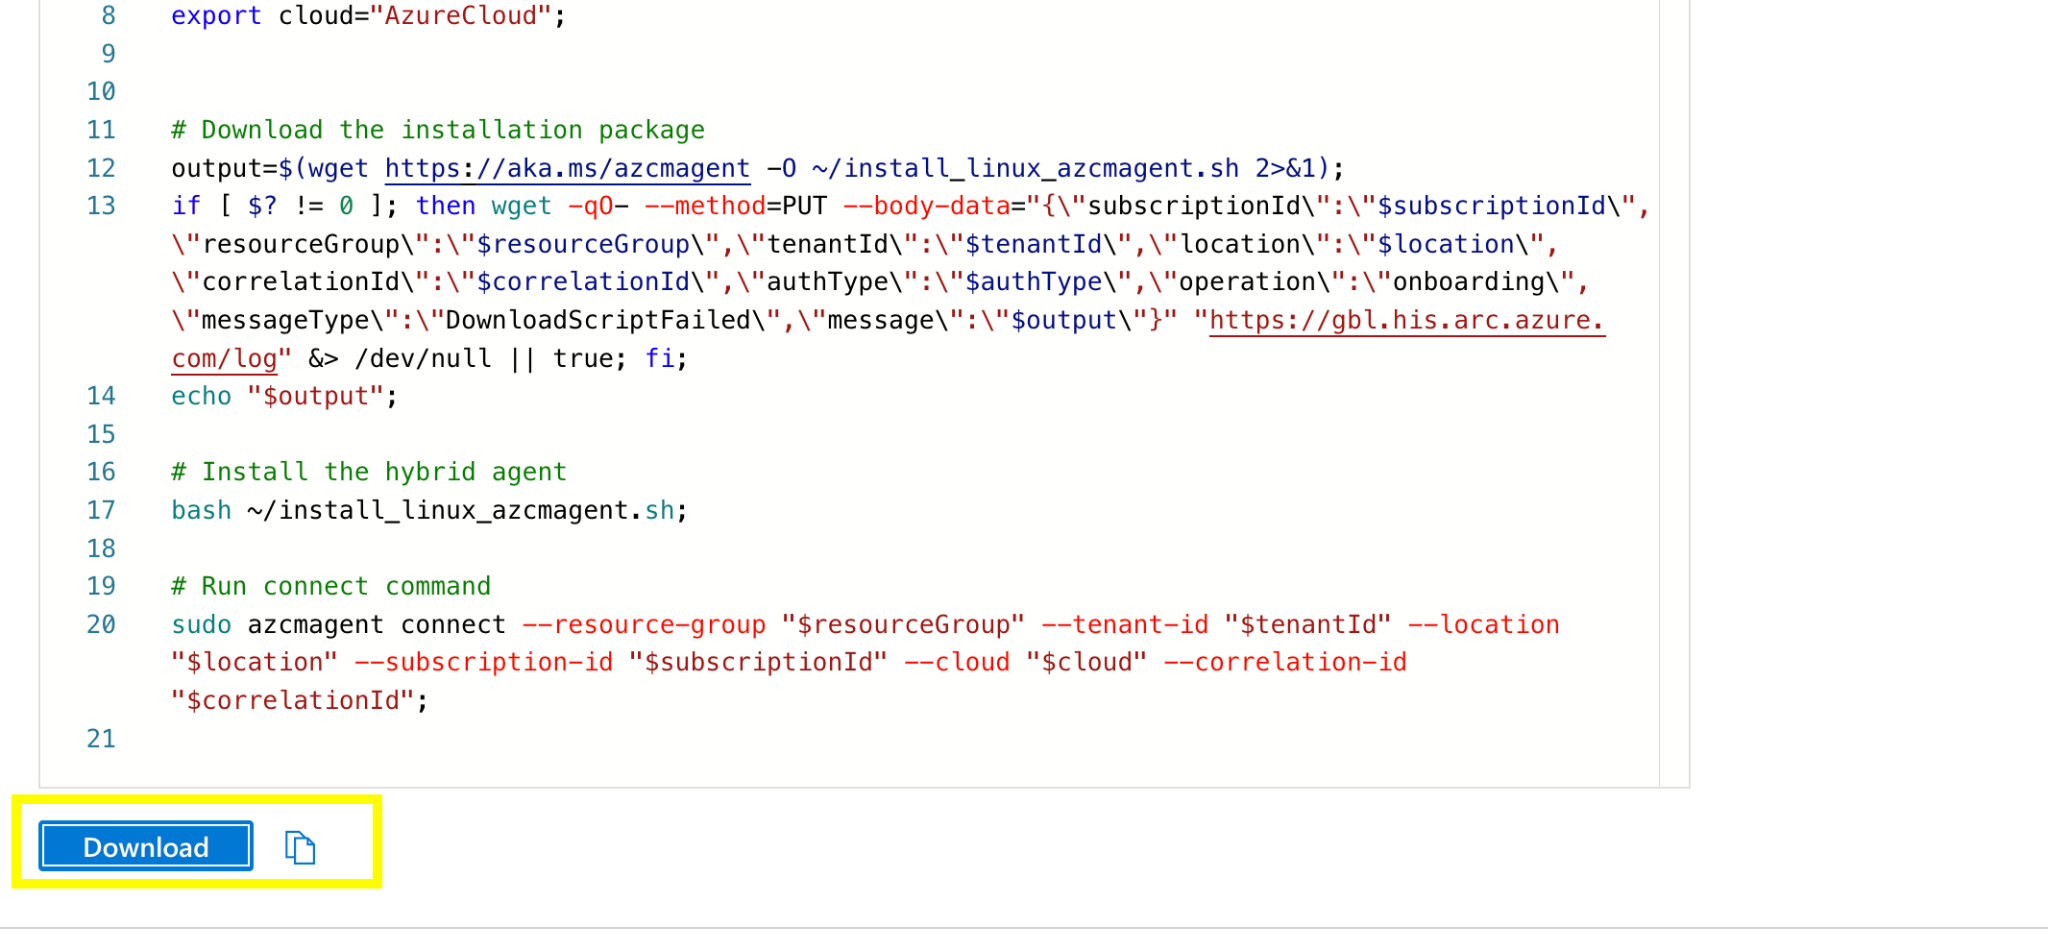
Then click “Next” so that you can add any tags (if necessary), then copy and/or download the bash script.

SSH into your Linux host and upload the install script and run it:
sh install_arc.sh
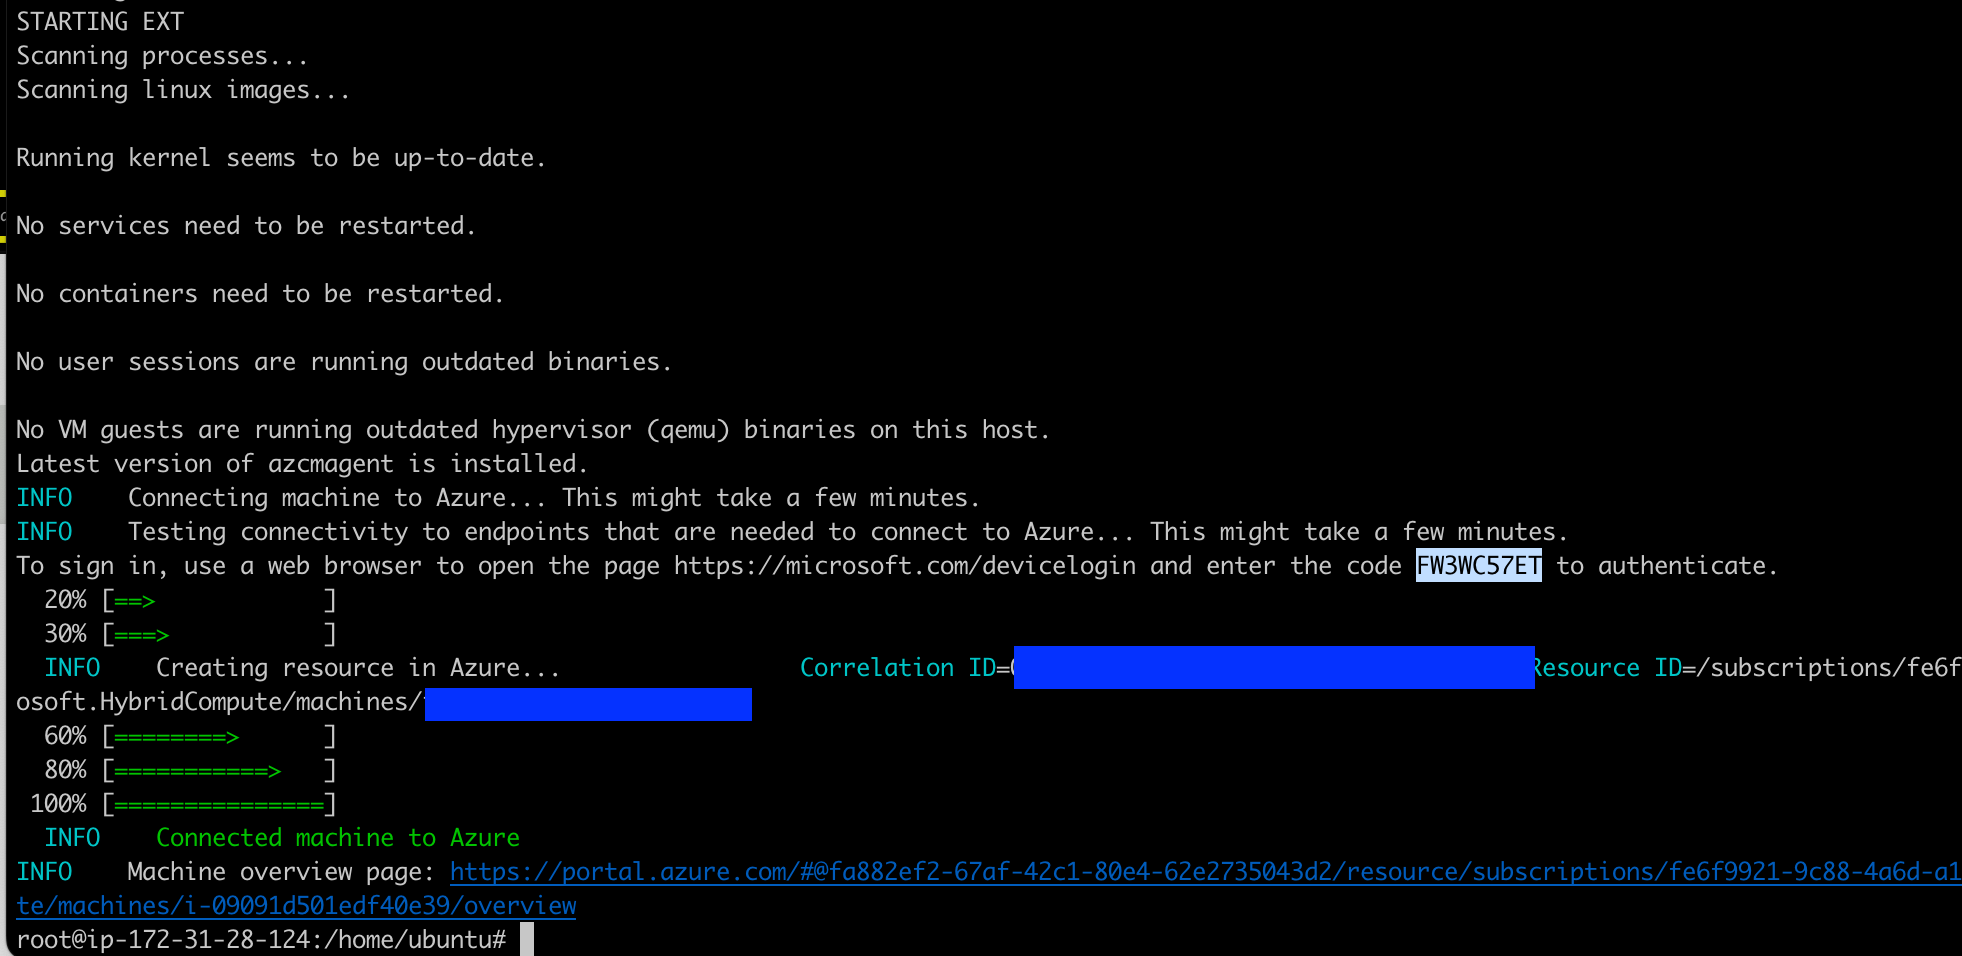
You must authenticate with a browser once the script is run and enter a code for Azure Arc to connect to the VM.
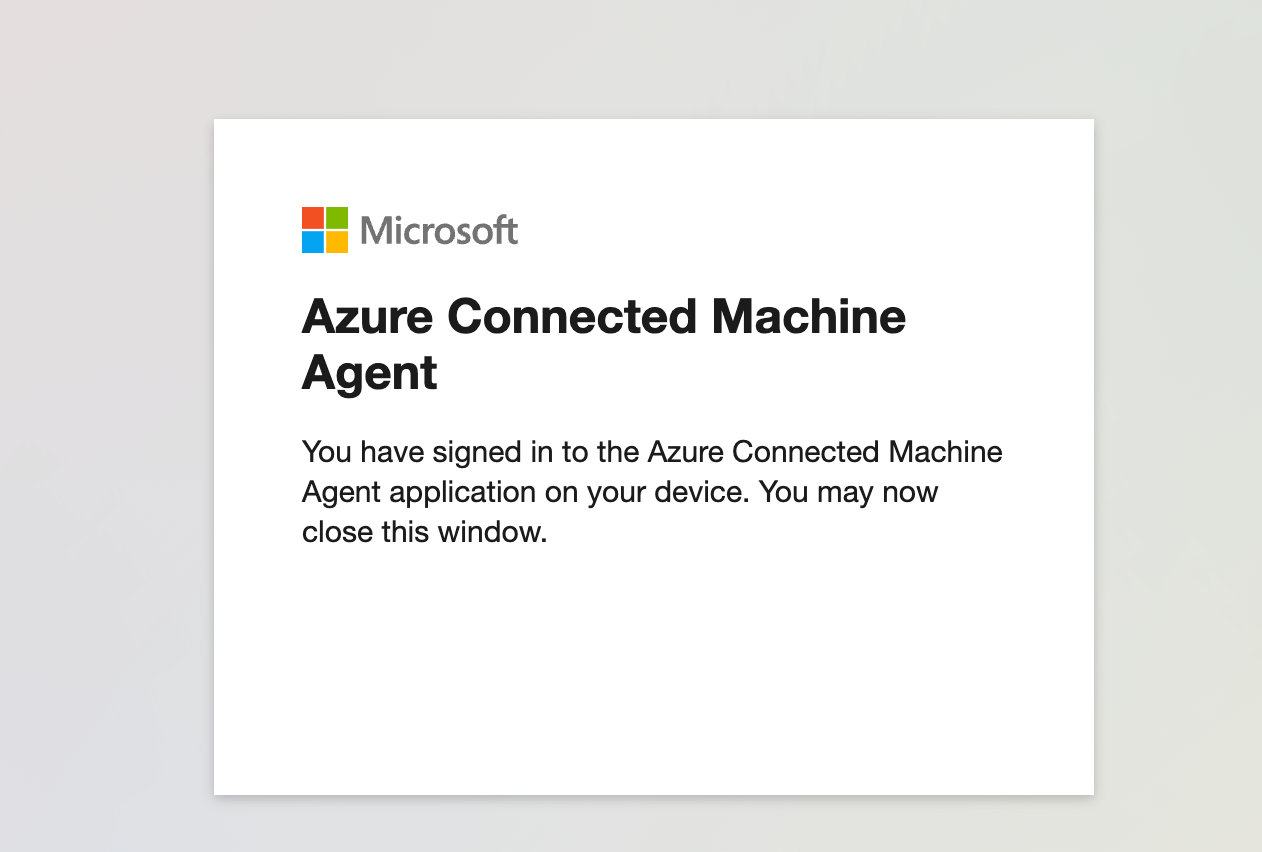
After logging into Azure and entering the auth code at https://microsoft.com/device, you should see this message that the server is successfully authenticated.

The installation can also be verified within your terminal.

In the Azure Portal UI, go back to the “Servers Arc” page and you should now see your VM is connected!

Step 3: Create a Data Collection Rule (DCR) to collect Syslog data
Now that the Azure Arc agent is connected and configured, we can create a Data collection rule (DCR) to collect Syslog data and route it to the CommonSecurityLog table in Sentinel. This will auto-deploy the Azure Monitor Linux agent extension. You can configure a basic DCR to collect basic Syslog data but we’ll deploy the CEF connector to collect CEF based data via Syslog.
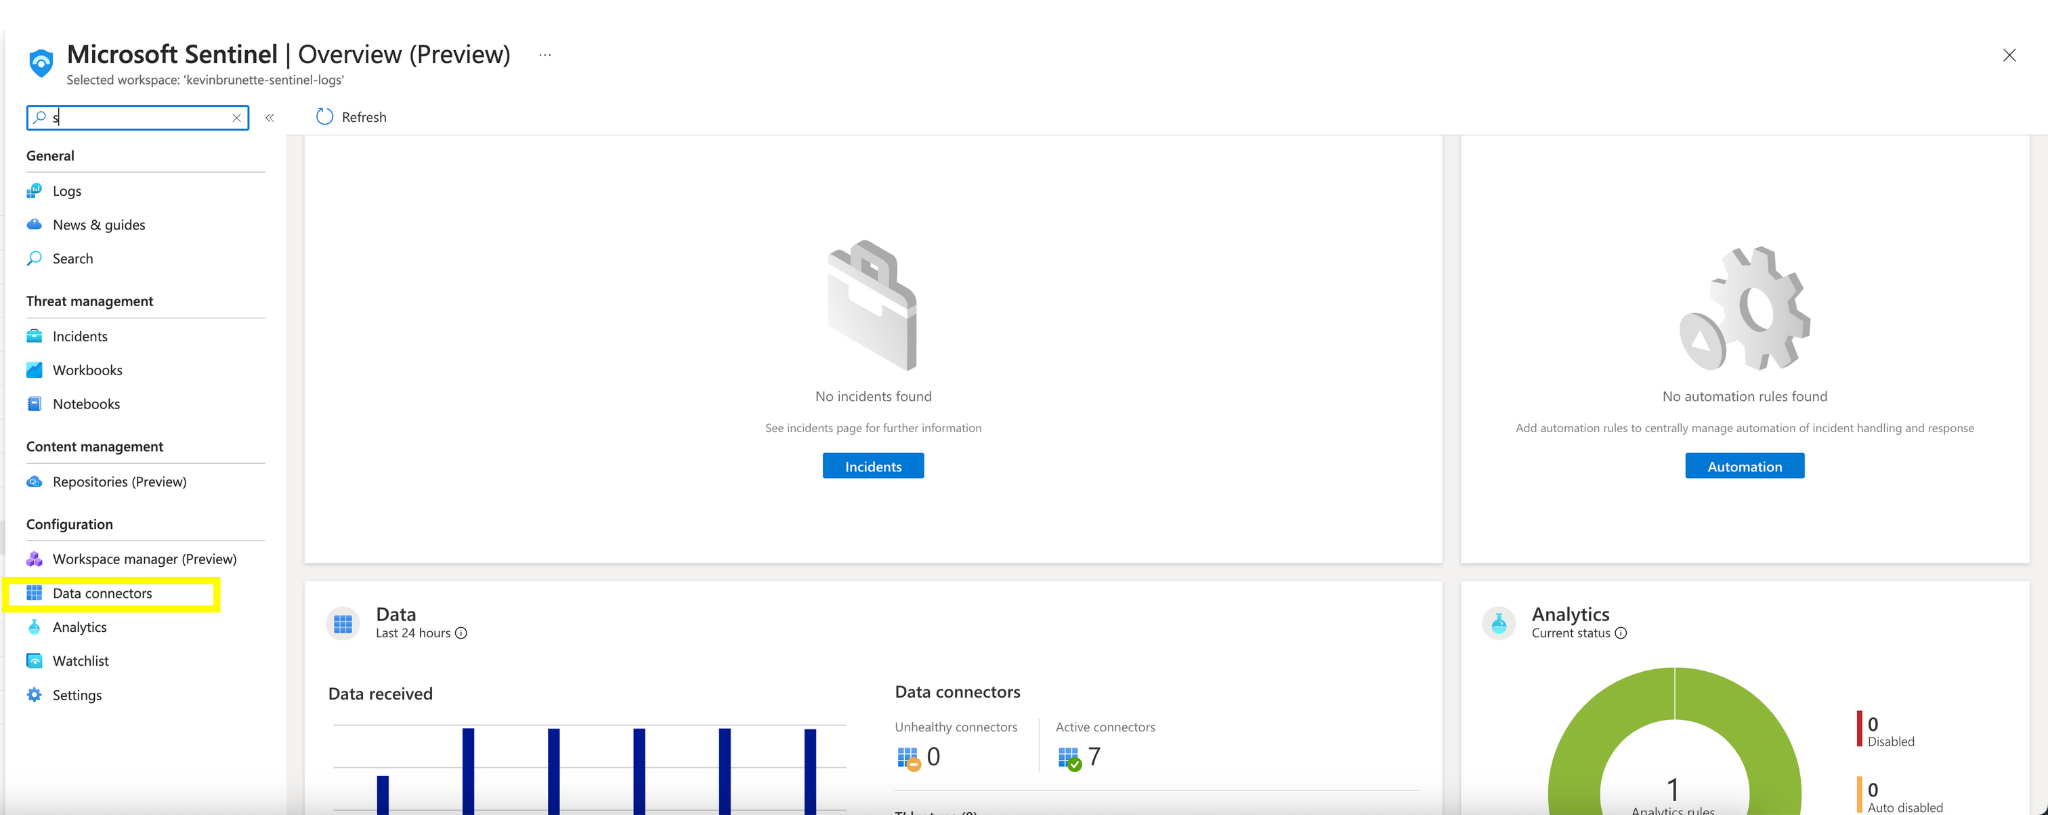
In the search bar, search for “Microsoft Sentinel” and click on your Sentinel workspace name. Next, click on “Data Connectors”.

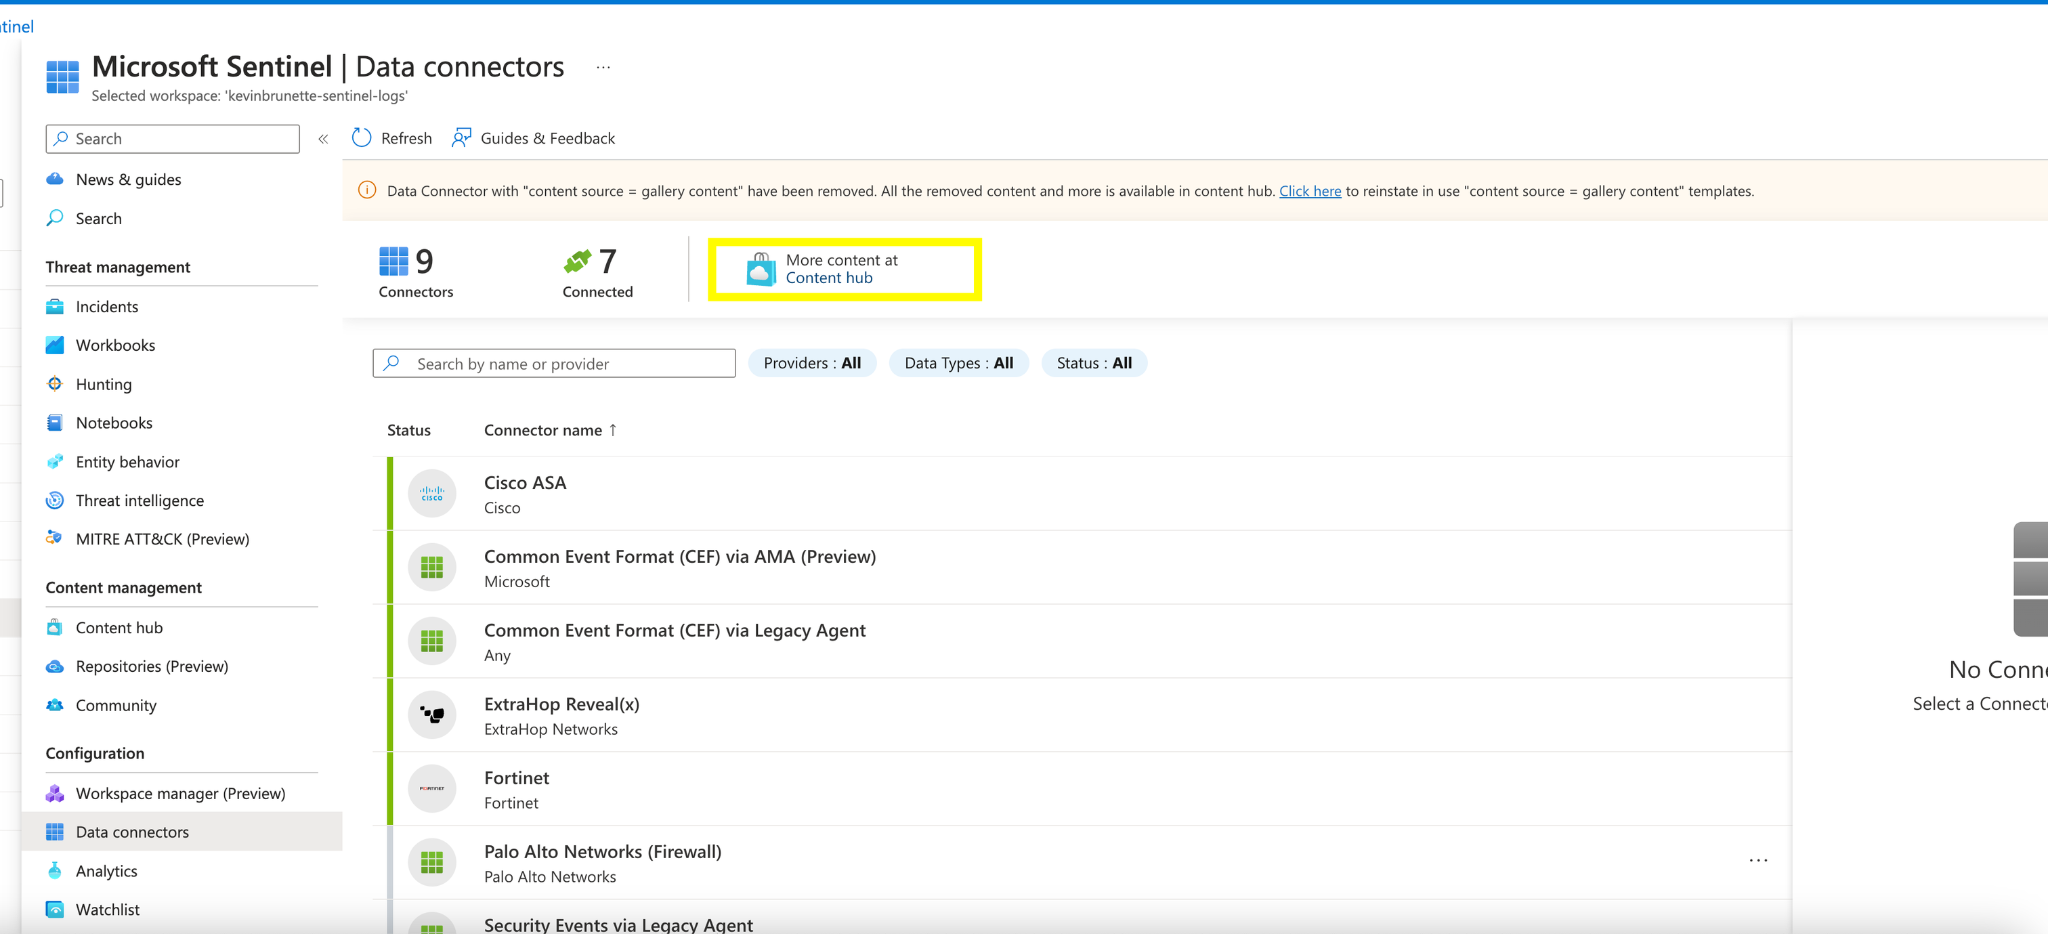
Click on the “Content Hub” link under: “More content at”.

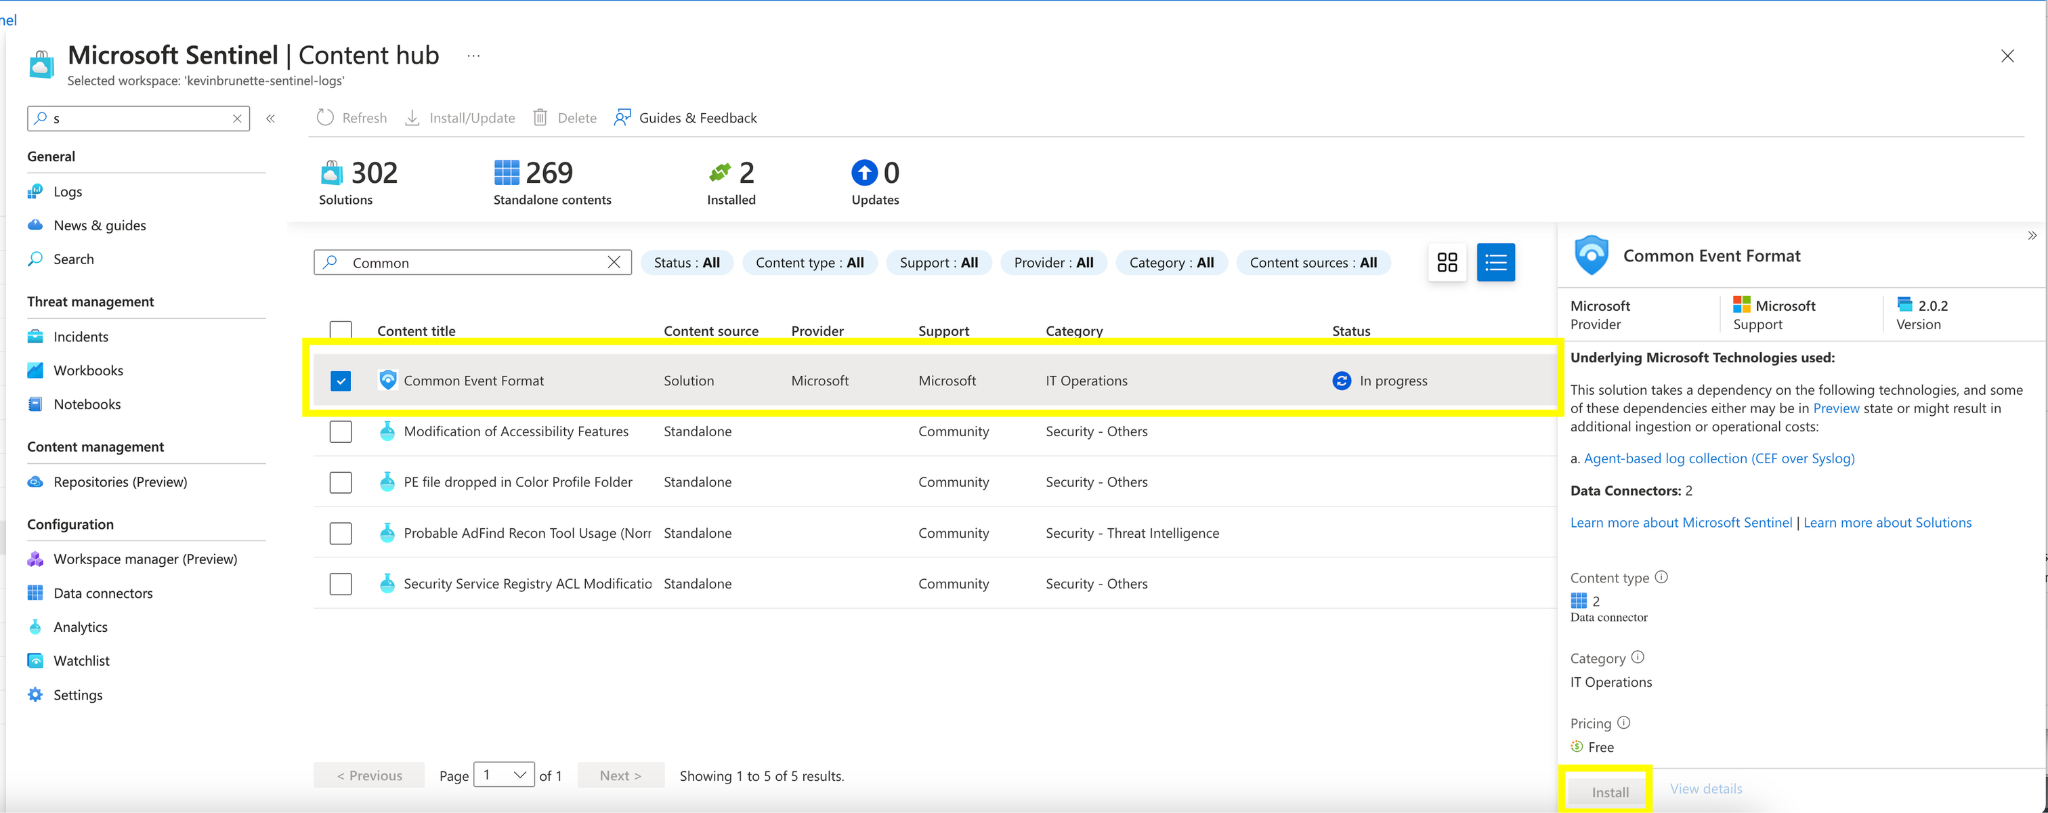
Search for “Common Event Format” in the search box, select “Common Event Format” and then click on “Install” in the bottom right.

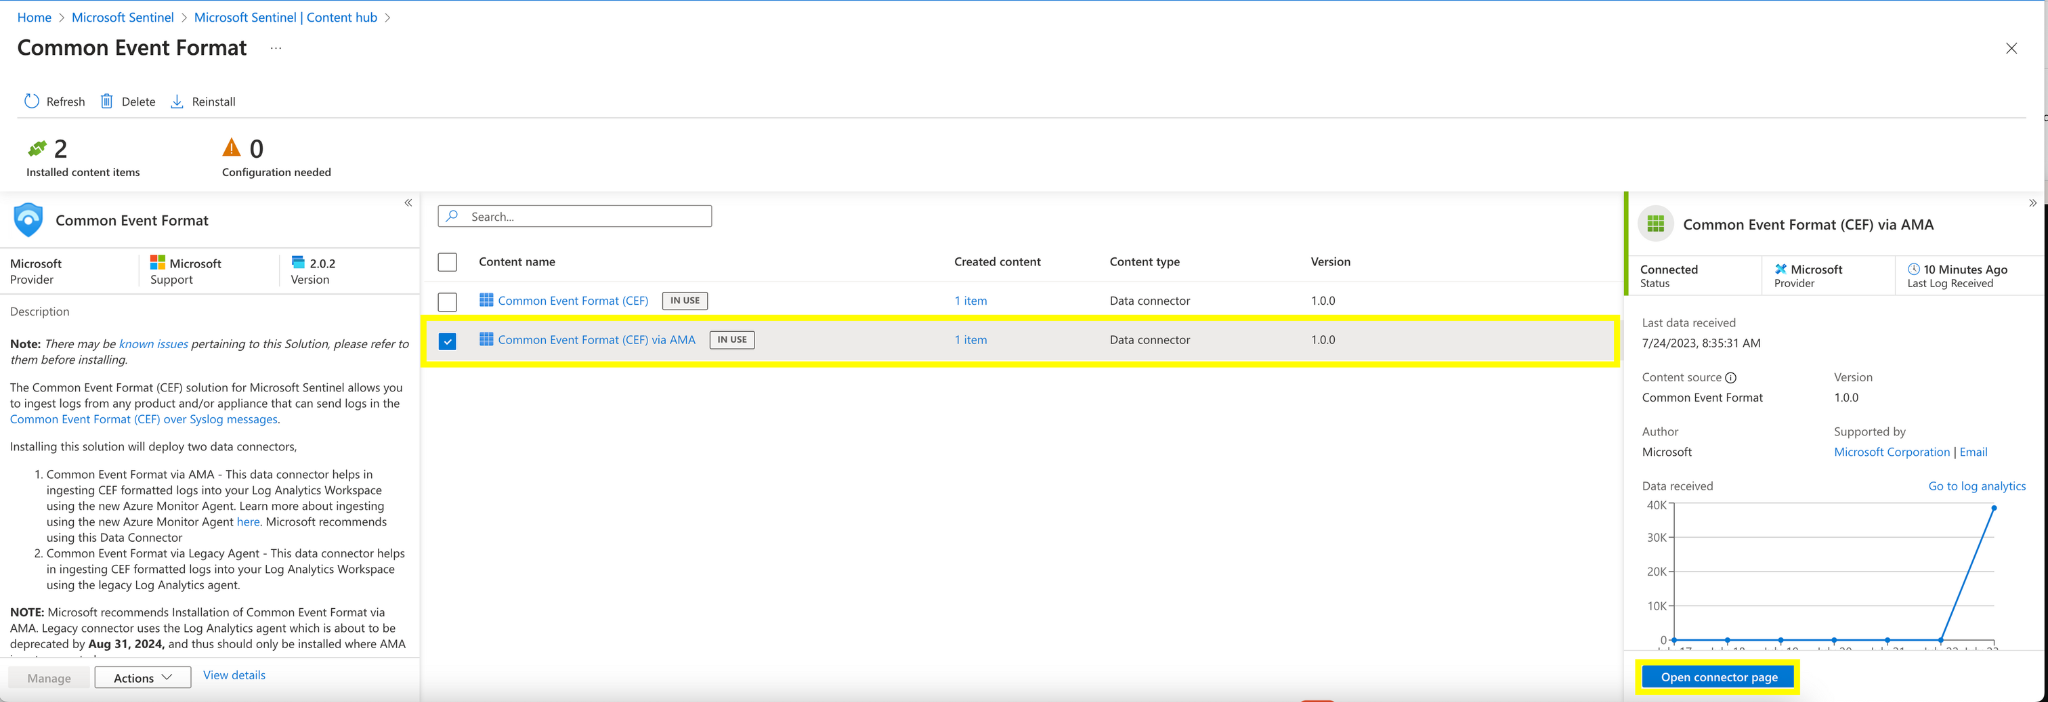
Once installed click on the “Open Connector Page” by clicking on “Common Event Format (CEF) via AMA”.

Click “+Create data collection rule”.

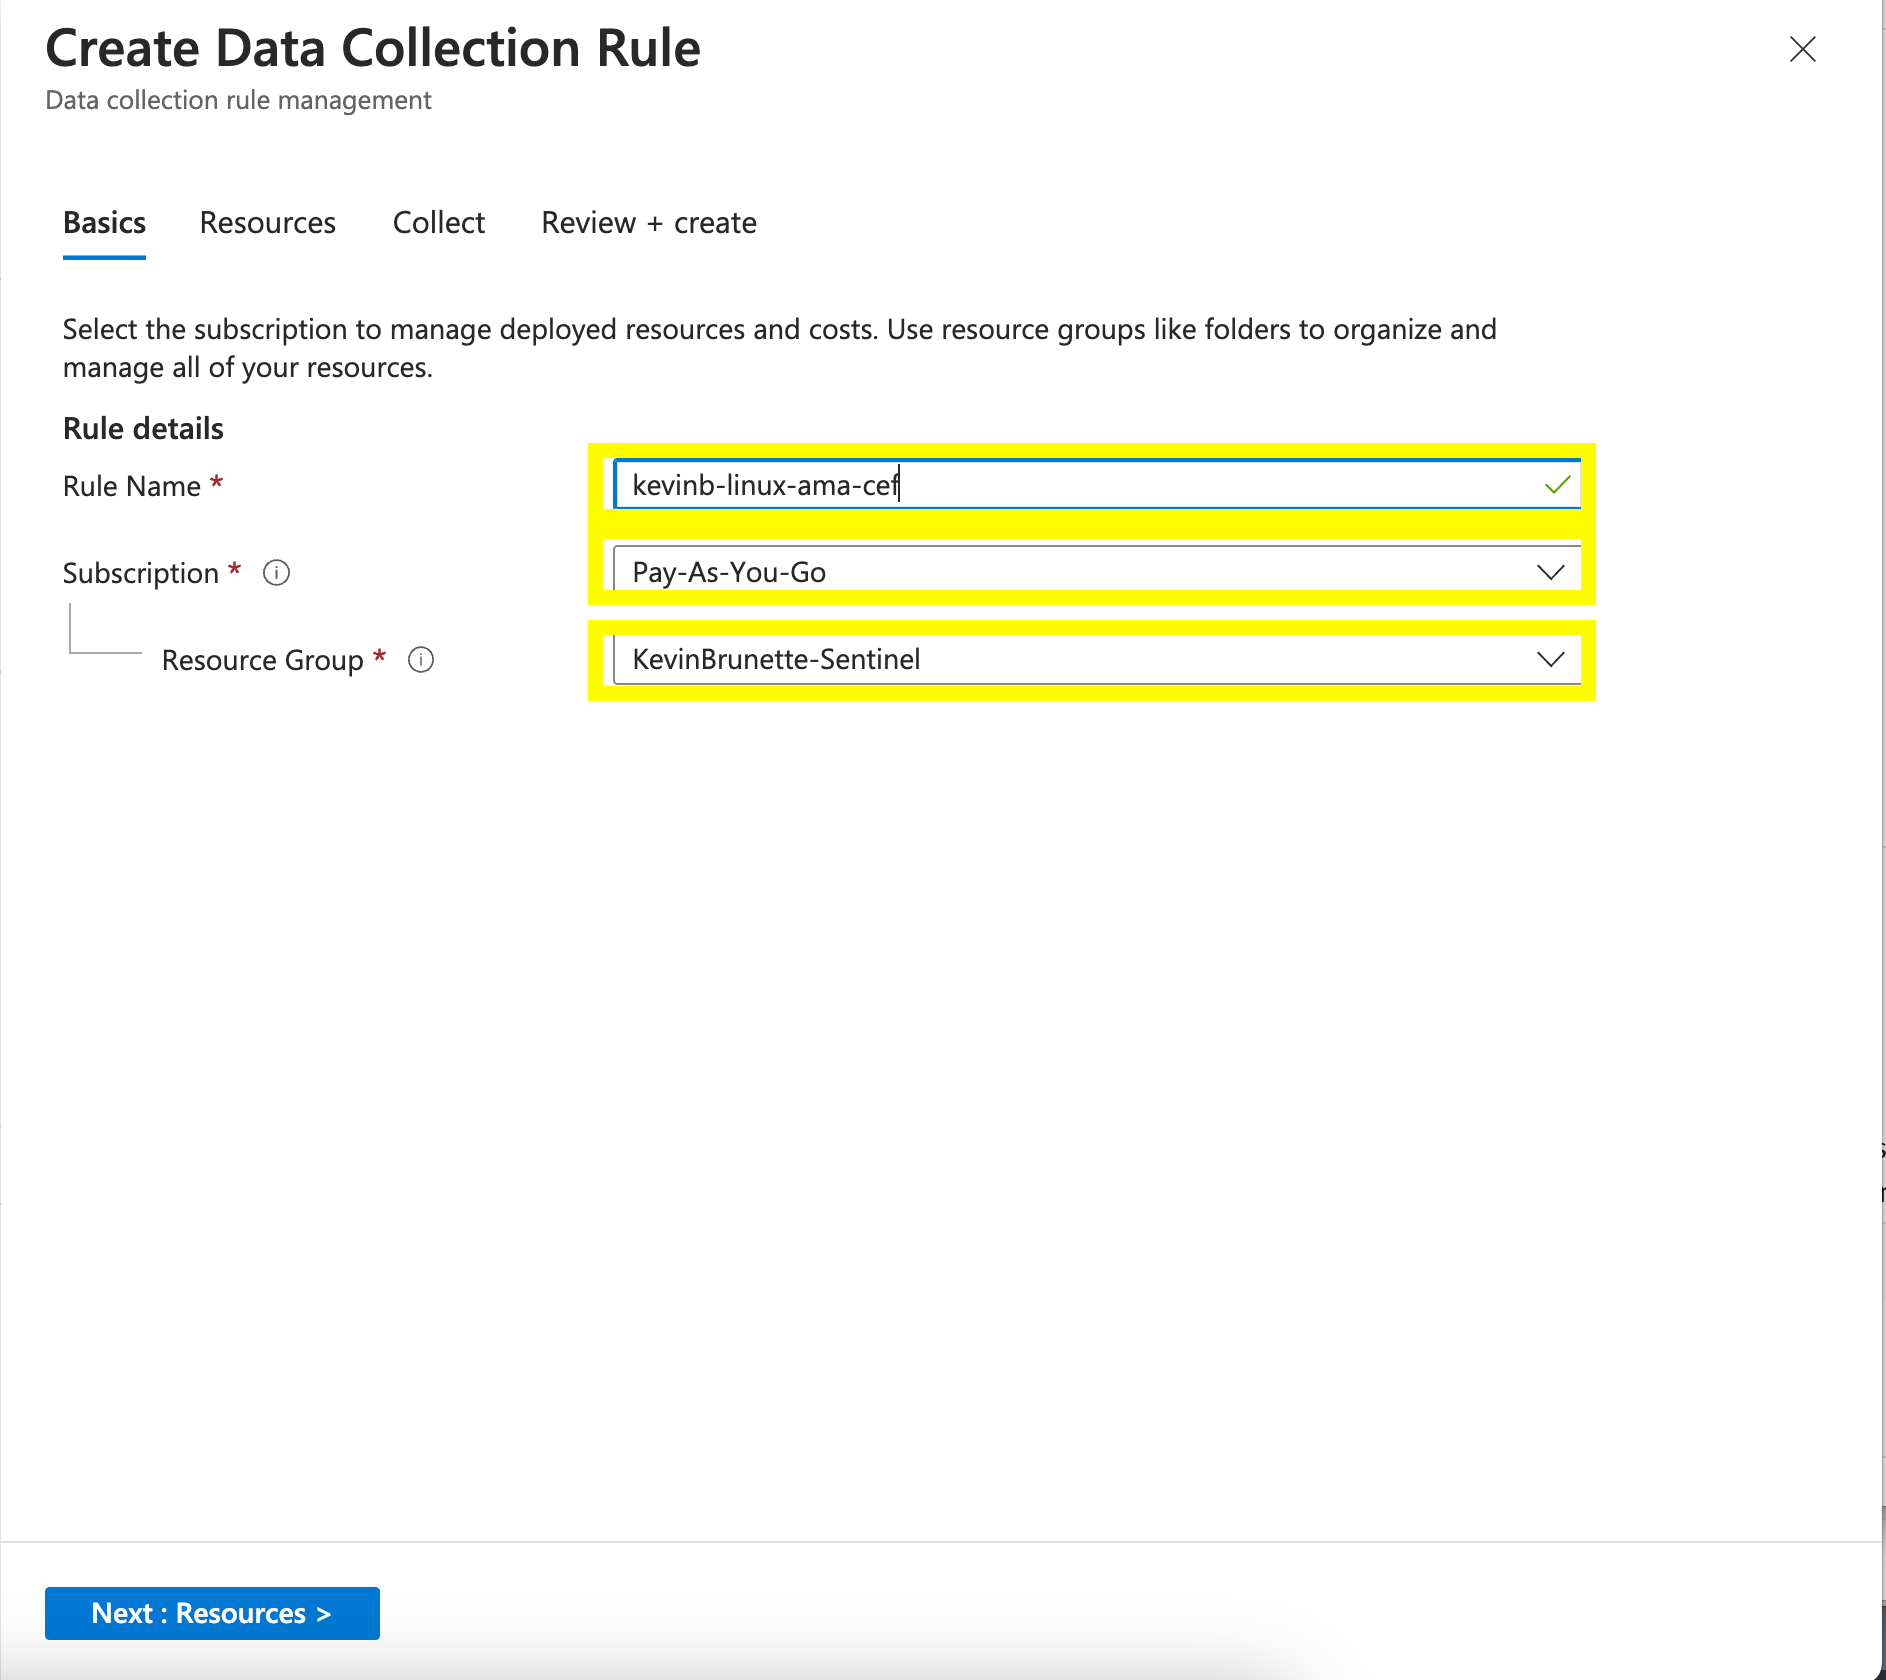
Give it a name and define the Subscription details.

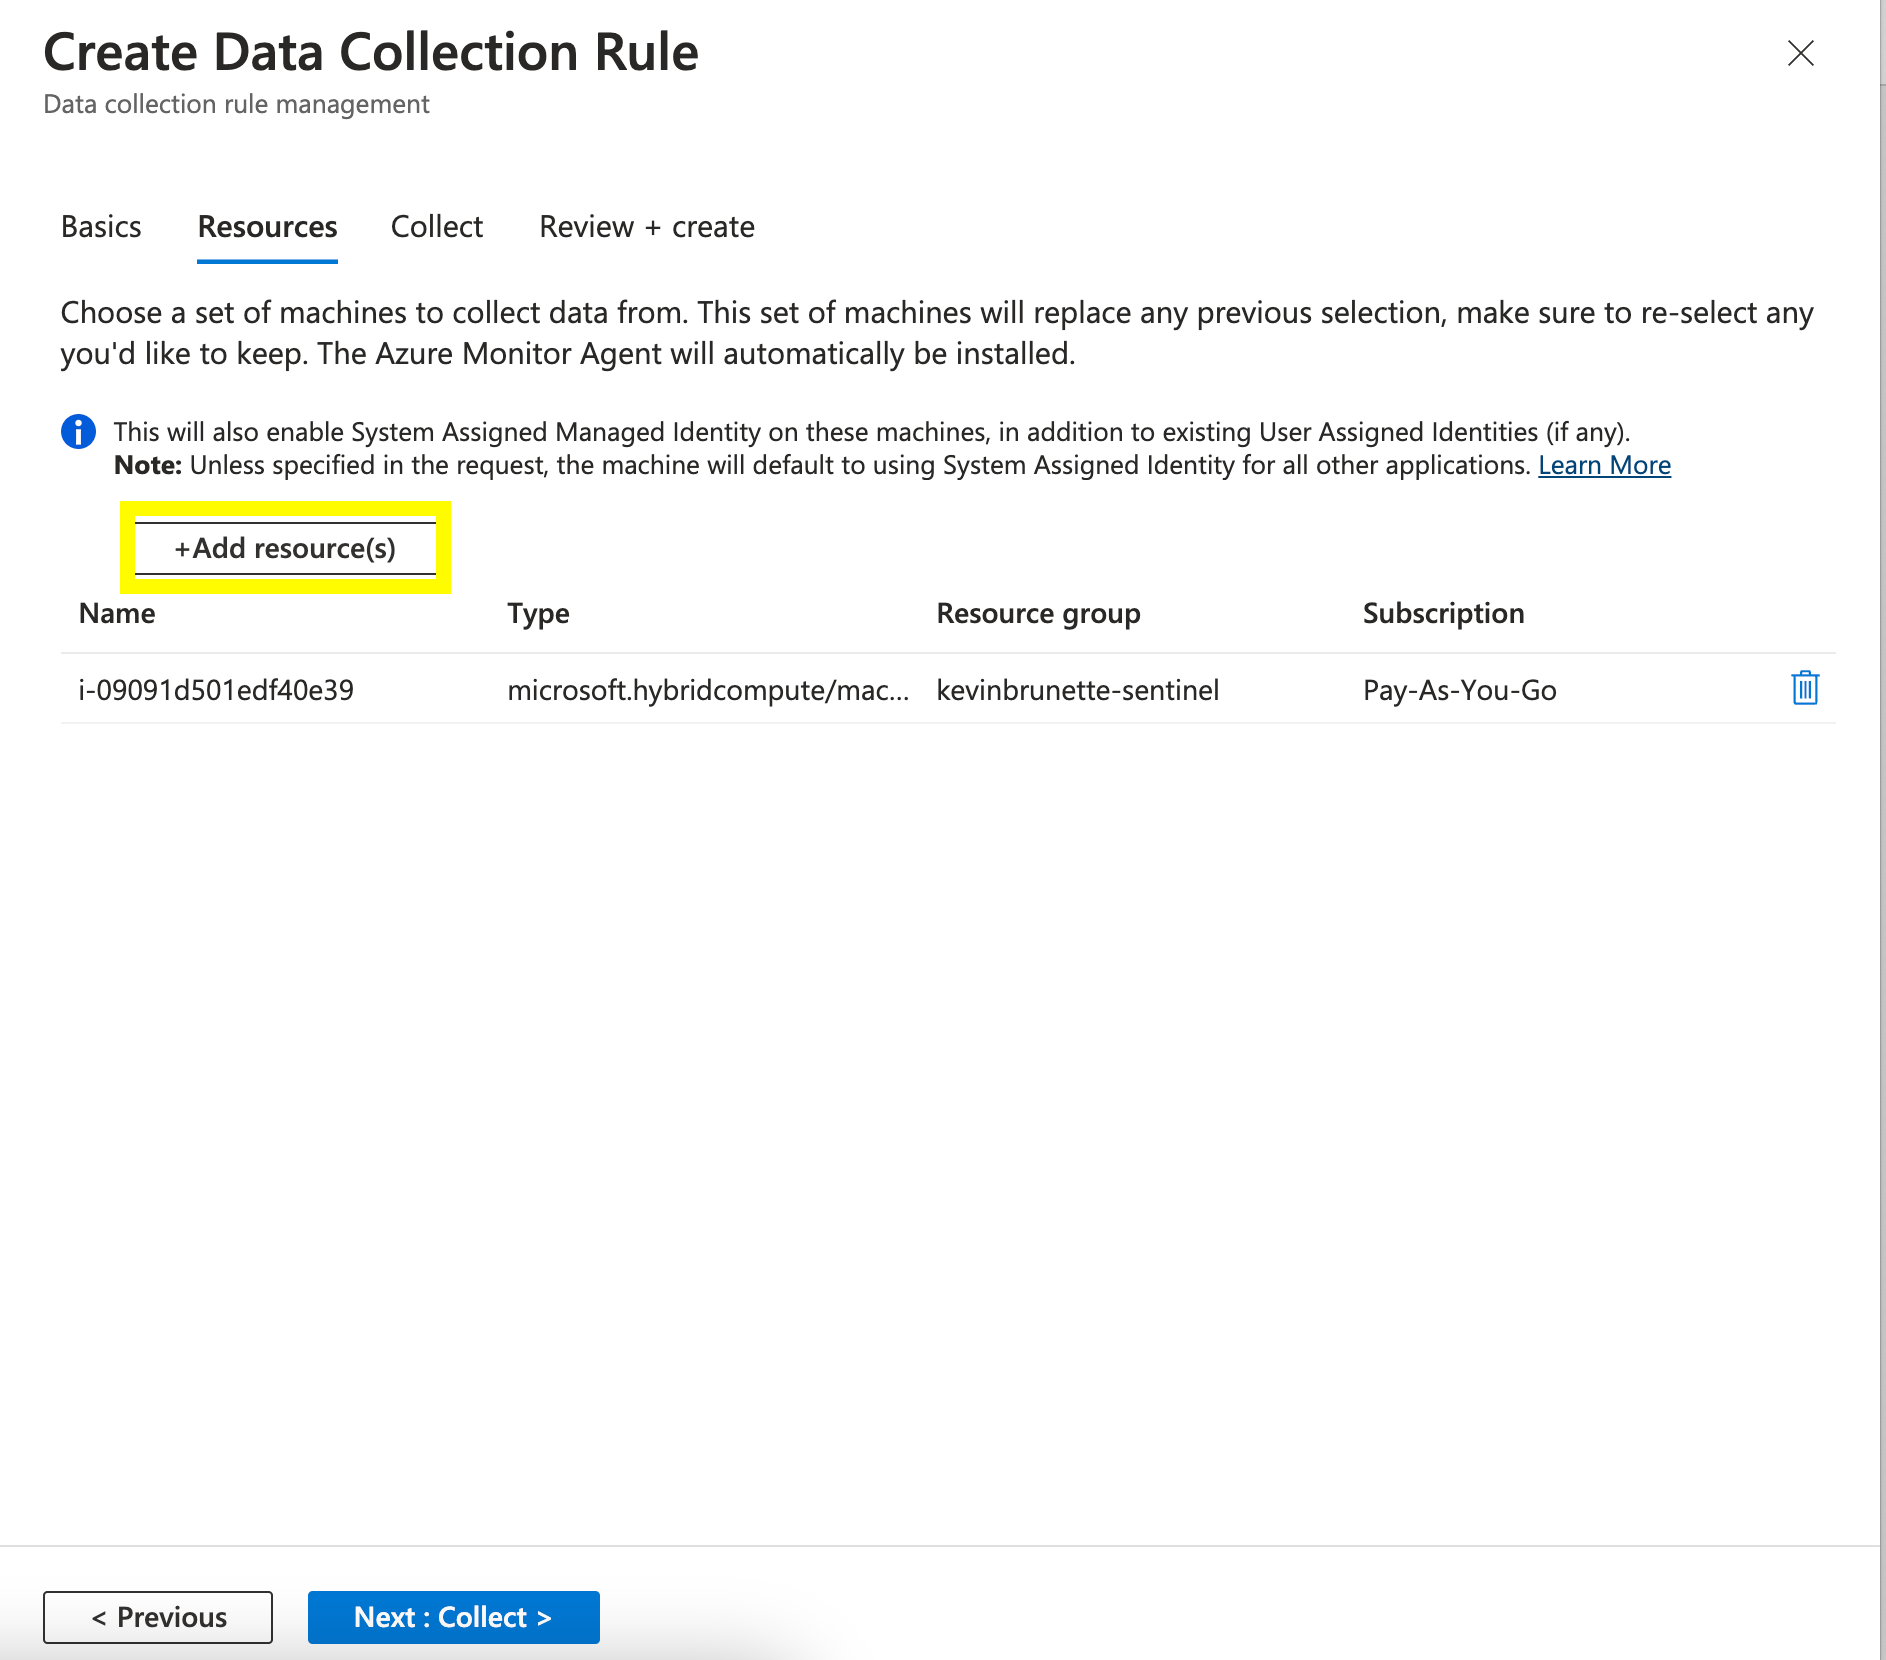
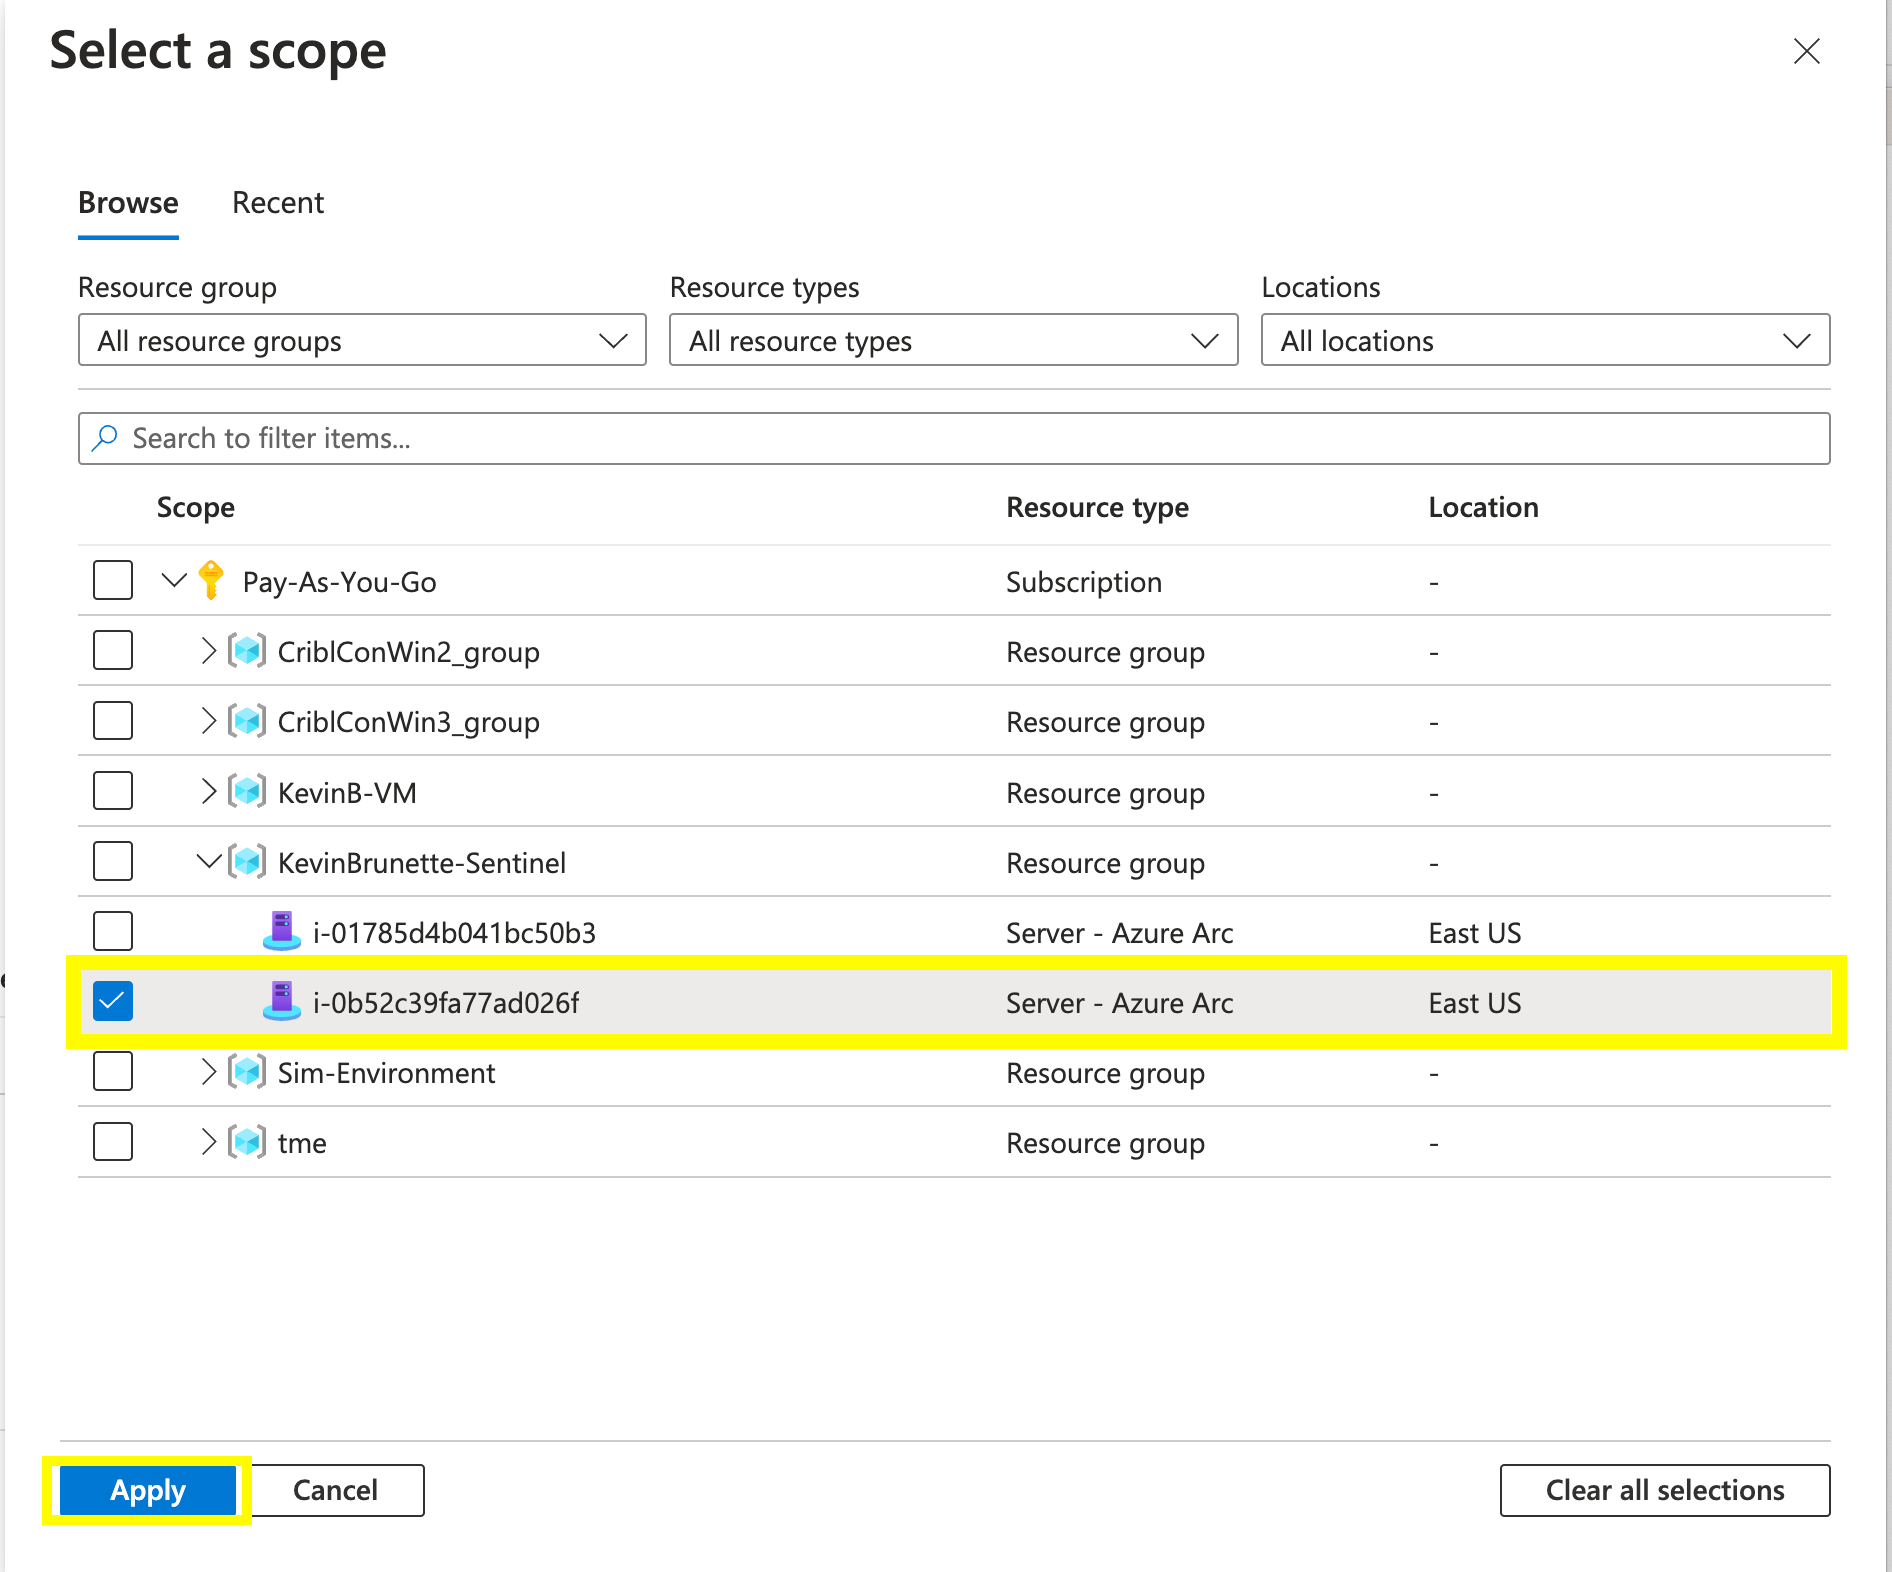
On the next page click “+Add Resource(s)” and find your Azure Arc server by its instance id and add it to the servers to be configured. Once finished, click “Next: Collect”.

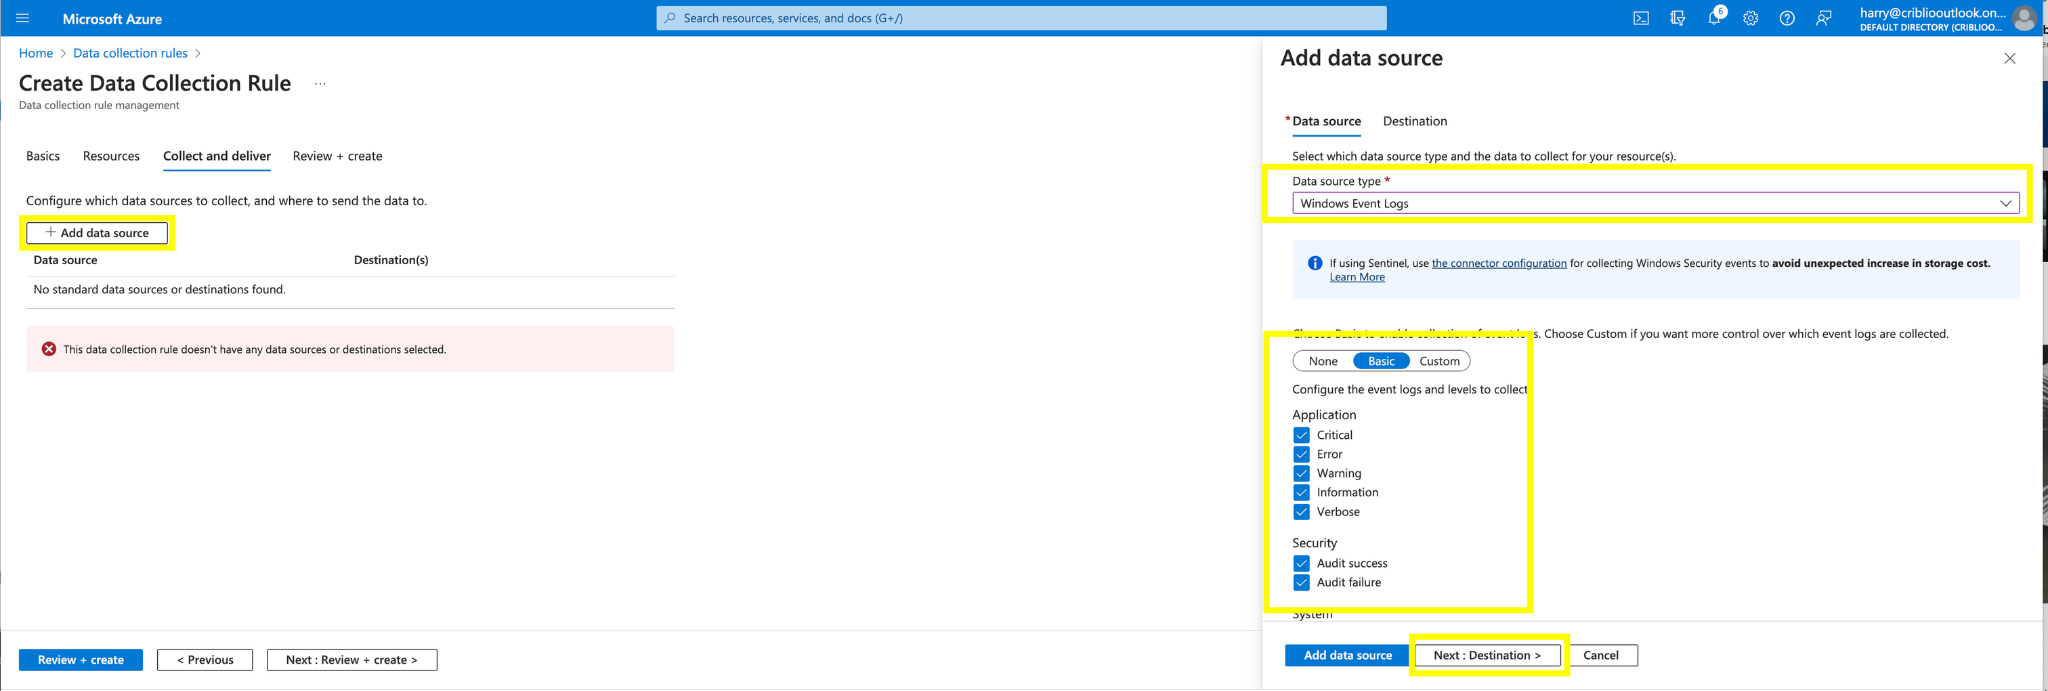
Now we need to tell the DCR what data sources to collect. We do this by clicking “+ Add Data source”.

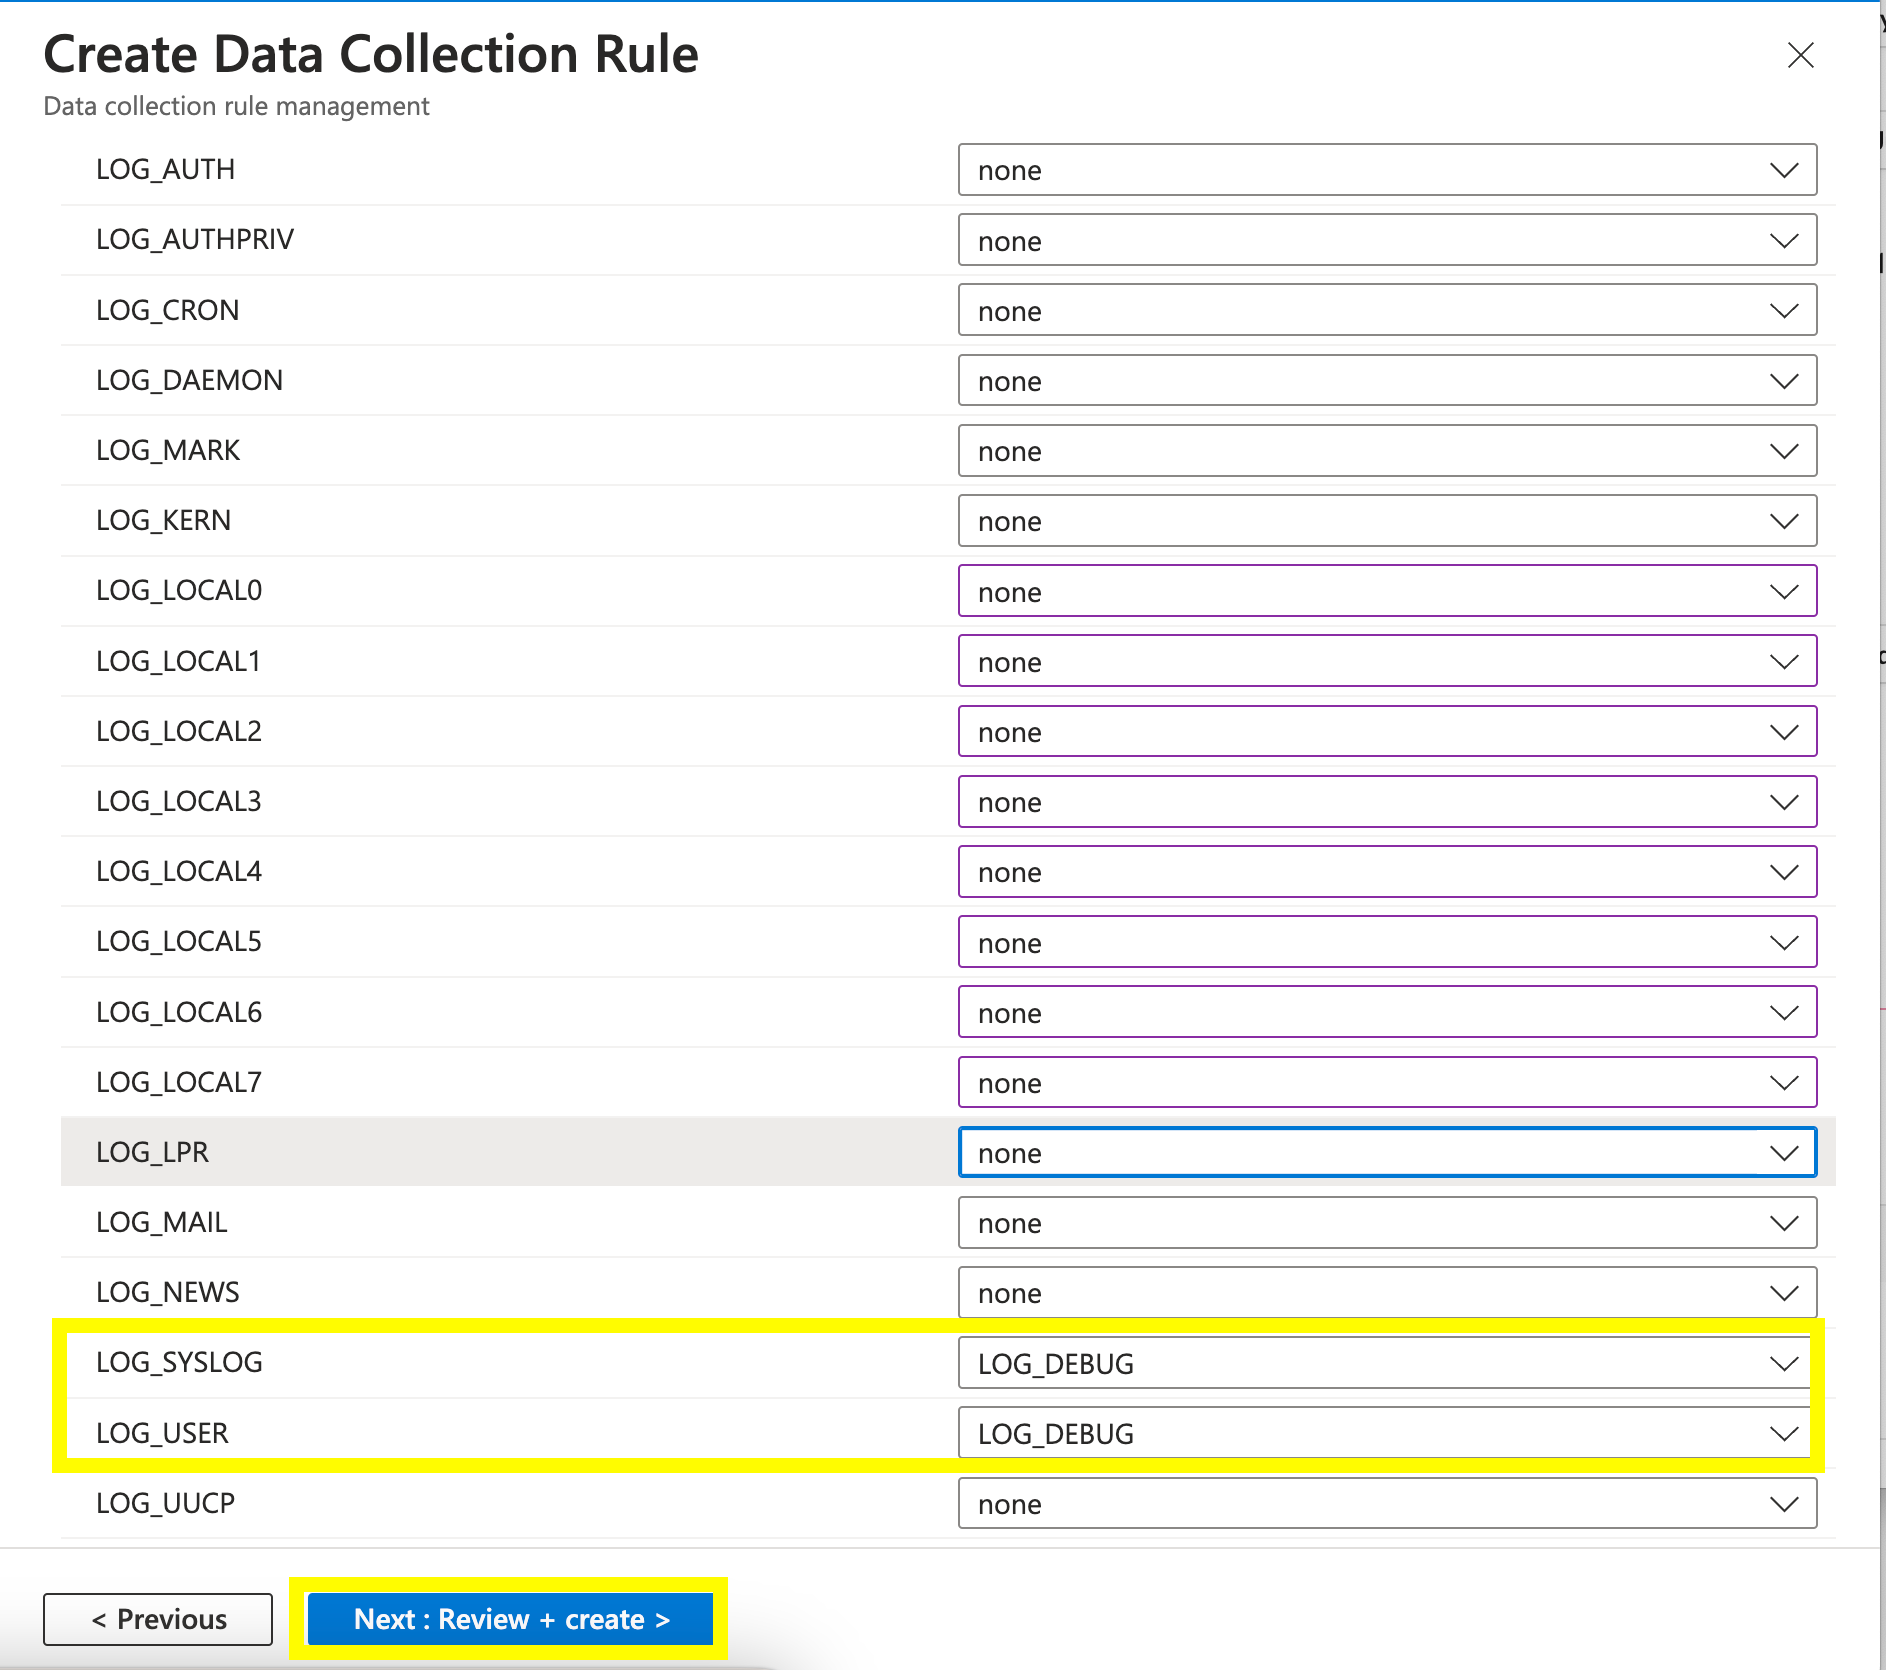
We’ll need to collect Syslog based data and we’ll need to define what facilities to collect data from. In my case I just want “Syslog ” and “User” based facilities since my other devices will be sending data to the”Syslog ” and”User ” based facilities. You can turn on the kitchen sink if you will, but keep in mind that we really only want CEF based data sources.
Define the log level you’d like to use and click “Next: Review and Create”.

Hit “Next: Review + create”.

Whew! We are almost done. After this step, your DCR deployment has been successfully deployed to Azure.

Step 4: Check status of the Azure Connected Machine extension
Let’s first check to see if the DCR deployed the “AzureMonitorLinuxAgent” extension. Go back to the “Arc Servers” page and select the VM instance id of the VM and then Click “Extensions”. You should see the status of the “AzureMontiorLinuxAgent” install status and hopefully it says “Succeeded”.

Step 5: Check Agent Connectivity to the Log Analytics Workspace.
Let’s make sure that the agent has successfully connected to our workspace.
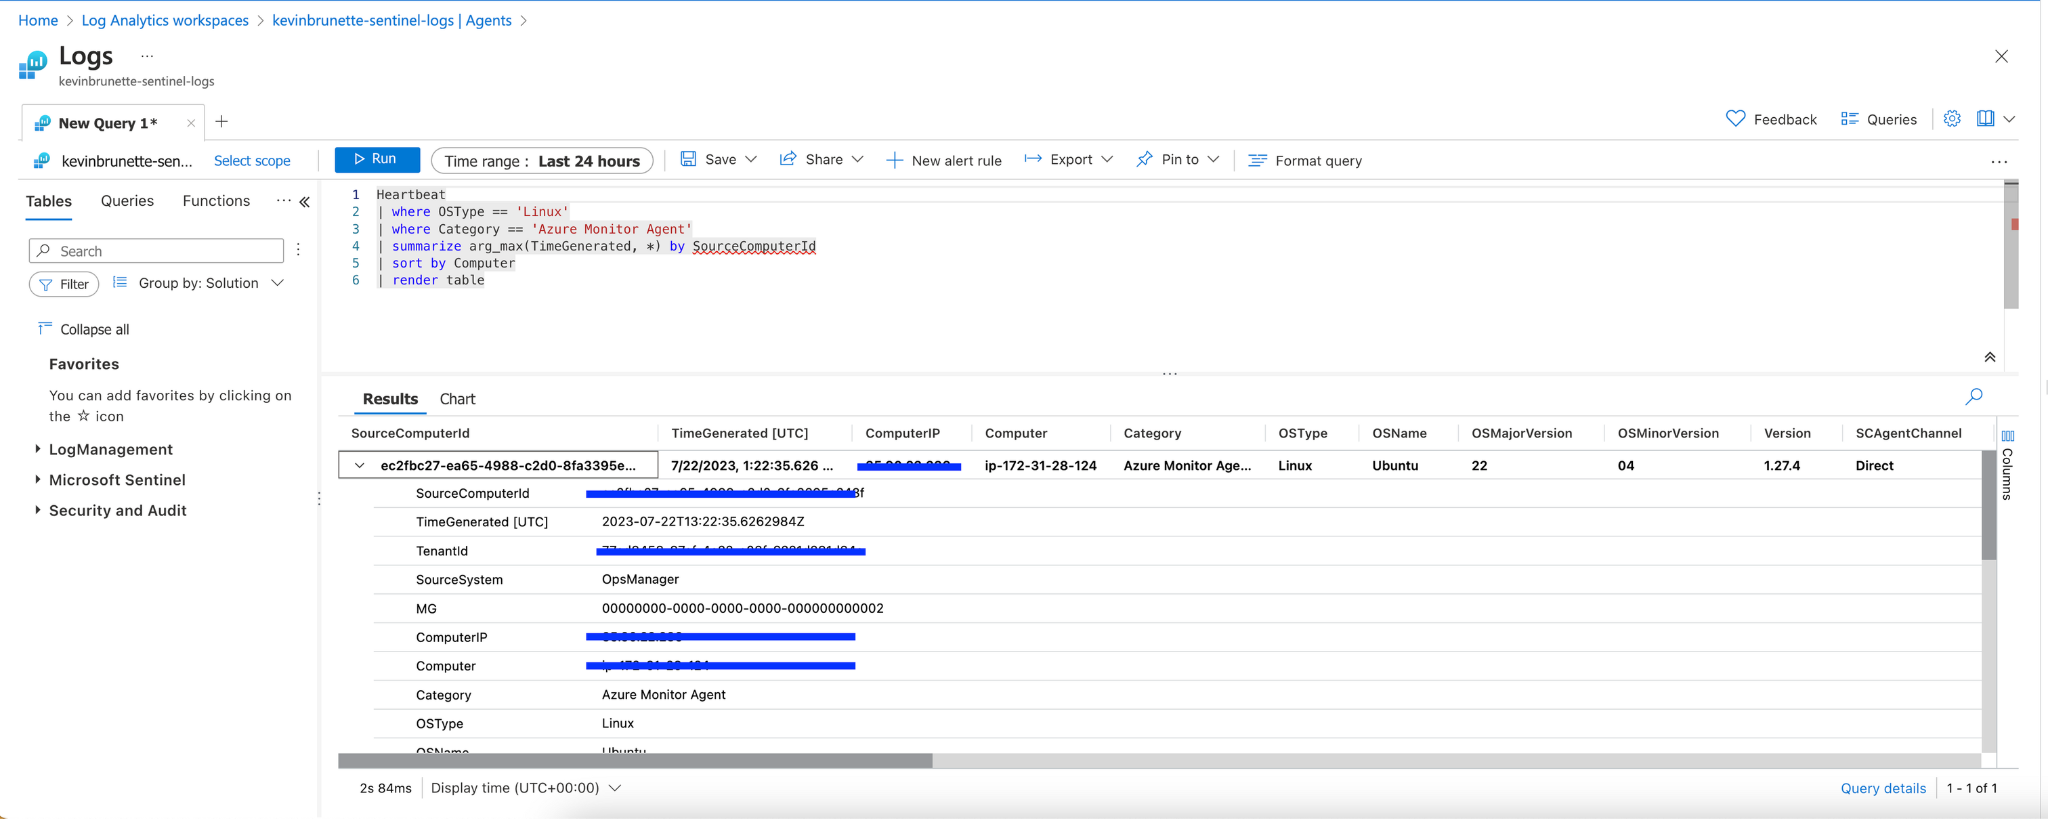
We verify even further by selecting “See them in logs” under the “X Linux Computers connected”.

By default, it will run a summarize query and give you details of the agent which should align to the server you just configured. You should see your VM and you can verify by examining the name, server IP, etc.

Step 6: Send sample CEF Syslog messages into Sentinel.
Moment of truth, at this point, you should be good to start configuring your applications to start sending CEF based syslog messages to the Azure Arc Azure Monitor Linux Agent we’ve just configured. First, let’s do a quick test to make sure it’s successfully receiving and ingesting our CEF data into the CommonSecurityLog table.
We can use Netcat to send test data into Sentinel to make sure it’s being collected and parsed correctly into the CommonSecurityLog table. In the following example, I’m sending a sample CEF Fortinet syslog message into my log analytics workspace on the host.
SSH into your host, and run the following command (You can also use your own CEF based message if you’d prefer).
echo "Dec 27 14:36:15 FGT-A-LOG CEF: 0|Fortinet|Fortigate|v6.0.3|61002|utm:ssh ssh-command passthrough|3|deviceExternalId=FGT5HD3915800610 FTNTFGTlogid=1600061002 cat=utm:ssh FTNTFGTsubtype=ssh FTNTFGTeventtype=ssh-command FTNTFGTlevel=notice FTNTFGTvd=vdom1 FTNTFGTeventtime=1545950175 FTNTFGTpolicyid=1 externalId=12921 duser=bob FTNTFGTprofile=test-ssh src=10.1.100.11 spt=56698 dst=172.16.200.55 dpt=22 deviceInboundInterface=port12 FTNTFGTsrcintfrole=lan deviceOutboundInterface=port11 FTNTFGTdstintfrole=wan proto=6 act=passthrough FTNTFGTlogin=root FTNTFGTcommand=ls FTNTFGTseverity=low" | nc -q0 127.0.0.1 514
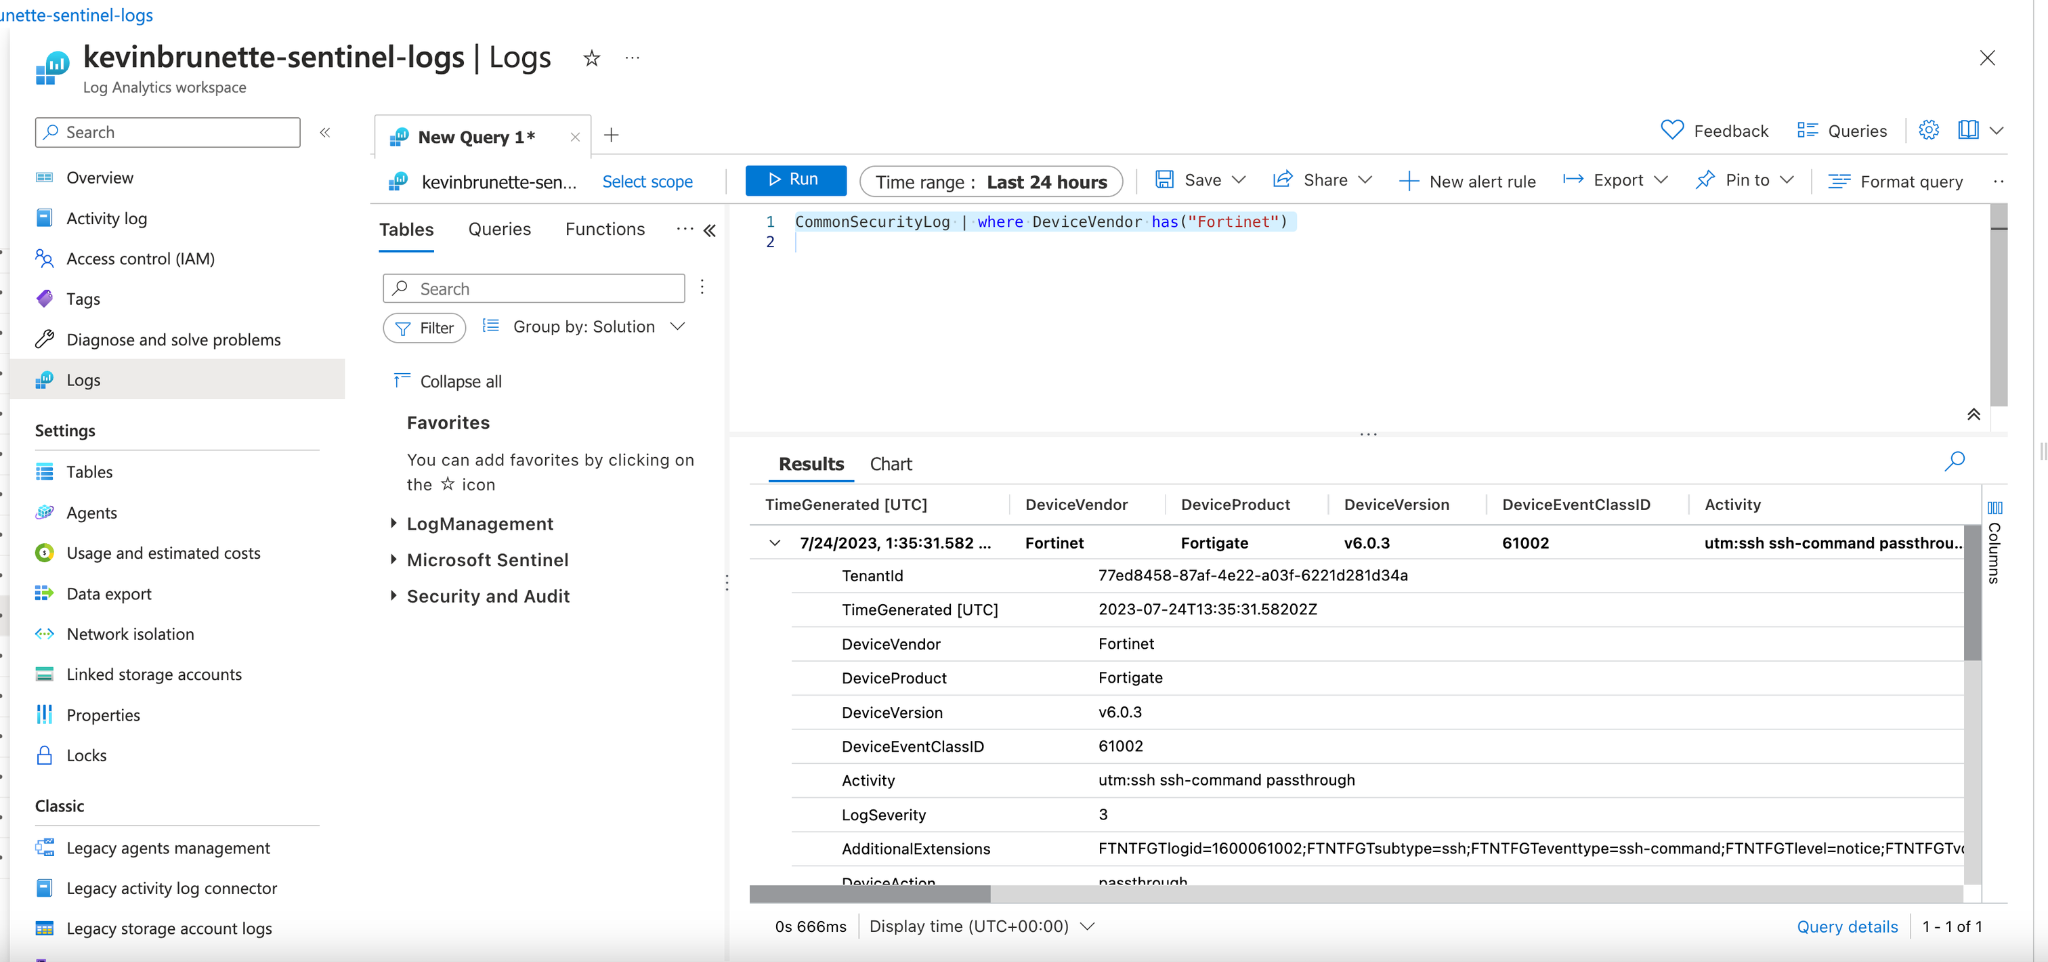
We should now see messages coming by doing a simple query looking for the message contents in our workspace.
CommonSecurityLog | where DeviceVendor has("Fortinet")
Looks like my CEF messages are being sent successfully!

Troubleshooting
Hopefully, things went well, but if not, here are a few steps.
An article is here Use Azure Monitor Troubleshooter – Azure Monitor | Microsoft Learn but here are a few good starting points.
- Rsyslog running and listening – Make sure to verify that Rsyslog is listening on ports 514 (Either UDP, TCP or both). In the Rsyslog directory, you should see the following files and if they are not there, something is wrong.
5-azuremonitoragent-loadomuxsock.conf10-azuremonitoragent.conf20-ufw.conf21-cloudinit.conf 50-default.conf
- Check logs – A good place to check is the logs.
- Logs can be found here:
- Arc policy logs:
/var/lib/GuestConfig/arc_policy_logs/gc_agent.log
- Extension logs –
/var/lib/GuestConfig/extension_logs/Microsoft.Azure.Monitor.AzureMonitorLinuxAgent-xxxxx/
- Full log dump – You can run the following command to dump all logs.
- azcmagent logs
- Network Access – Make sure that your machine can talk to Azure. Check the
- Inbound access – Since your server will be handling Syslog messages on port 514. You should open up inbound communication on TCP and/or UDP through ports on 514 depending on your scenario.
Windows Azure Connected Machine Agent
Let’s configure setting up the Windows connected machine agent.
Step 1: Add your Windows server to Azure Arc
In Azure search for “Azure Arc” and within the “Azure Arc” pane, select “Servers”.

Select the “+ Add” button on the top rail.

After hitting add click “Generate Script”

Fill in the appropriate resource details for your VM.

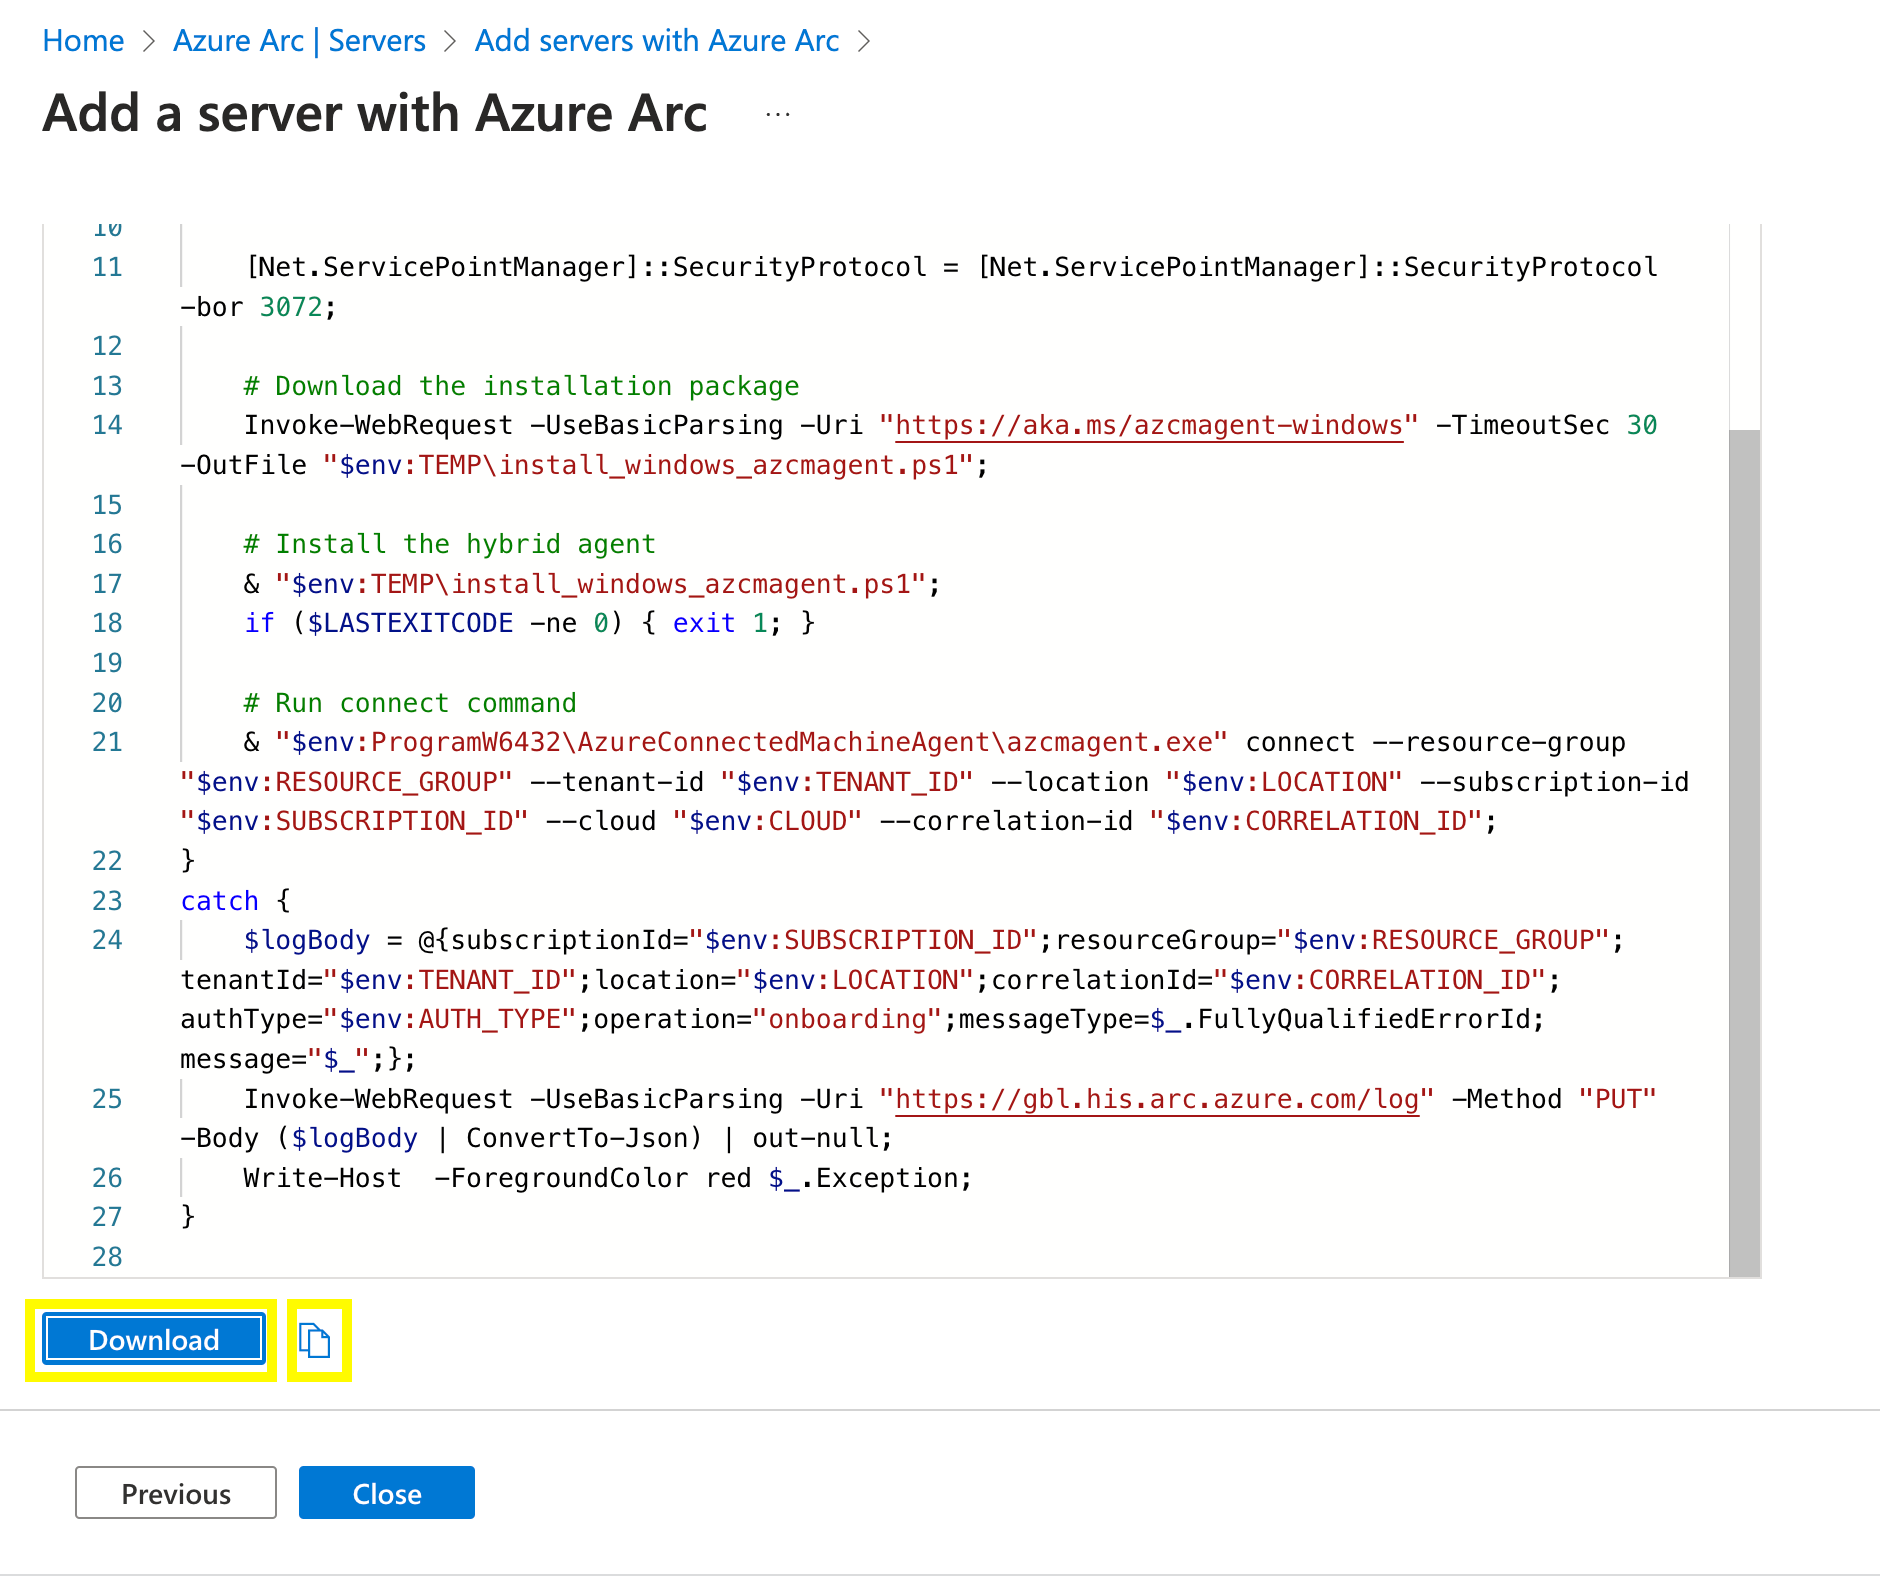
Click “Next” copy and/or download the Powershell script to onboard your Arc Server.

Step 2: Run the Arc installation Powershell script
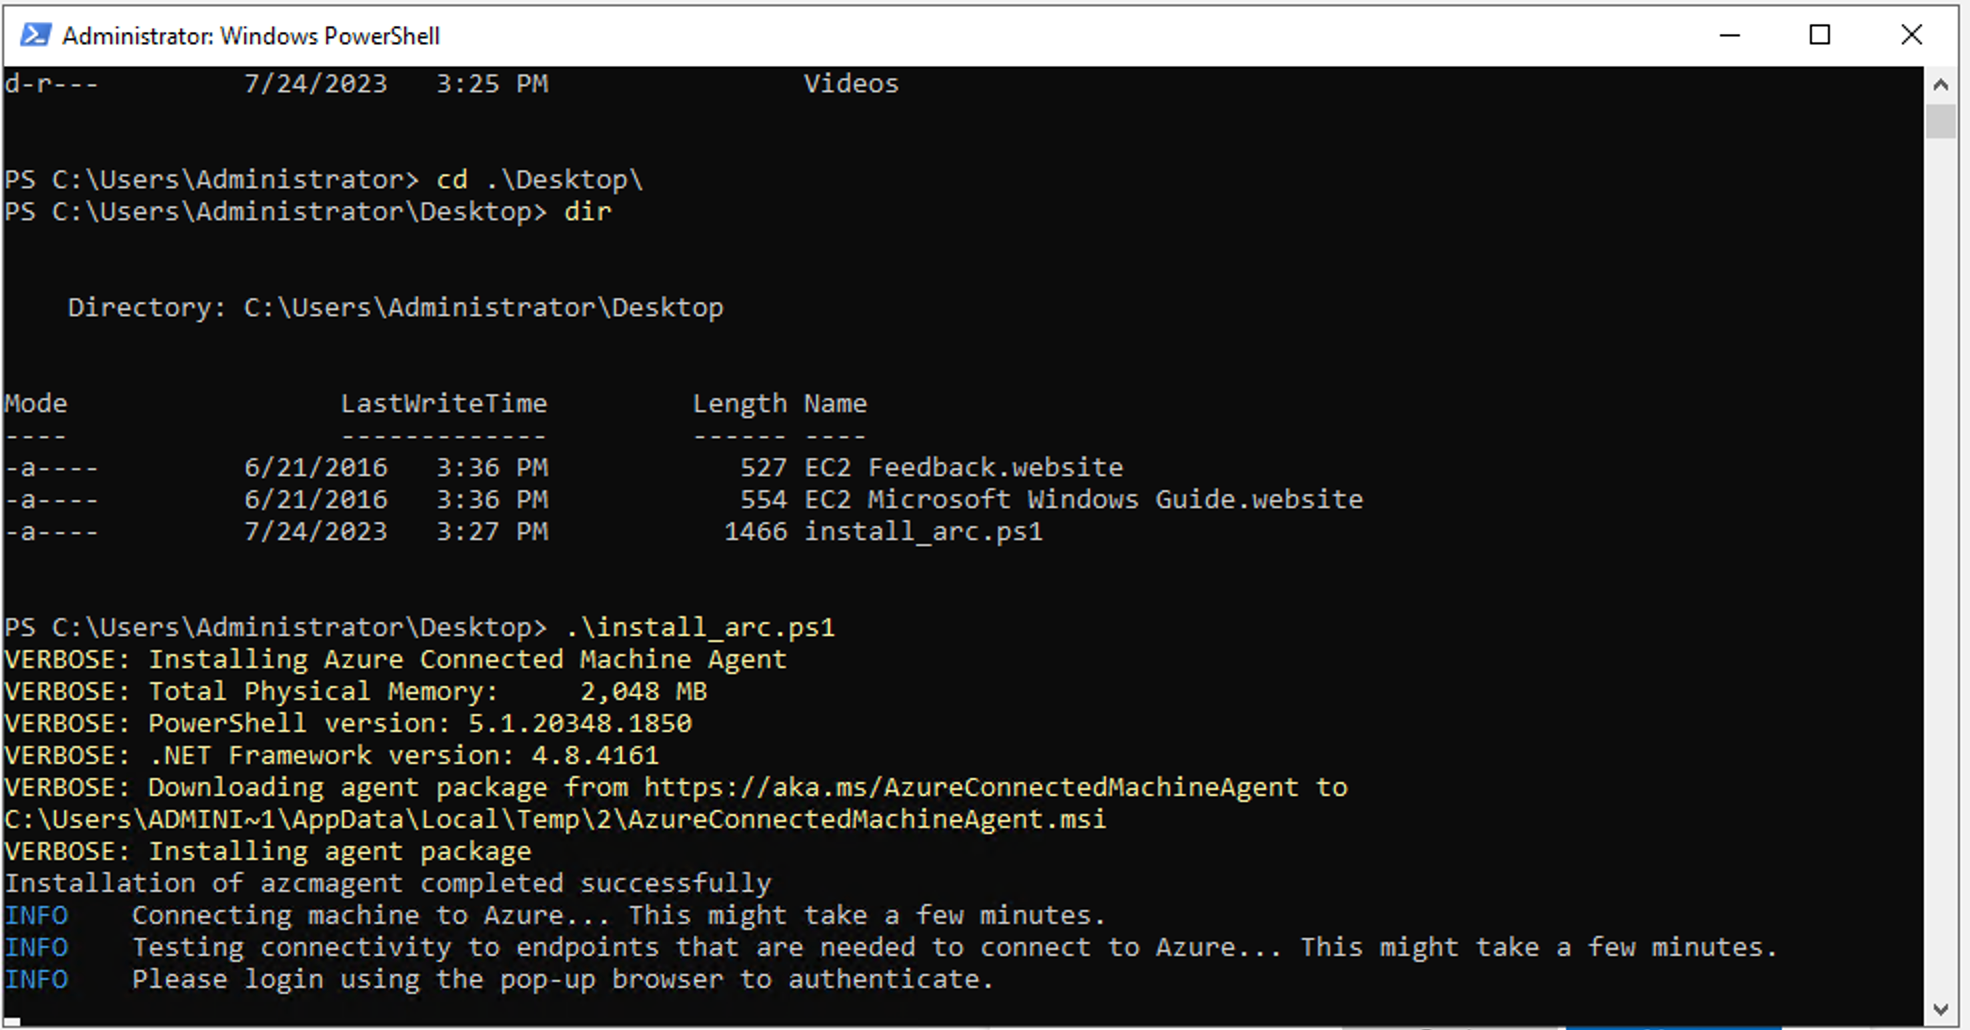
Copy and/or upload the script from step 1 onto your Windows host, open a Powershell terminal and run it.

The Powershell script will automatically open a browser to authenticate your Azure Arc server. Log in to Azure with your credentials and you should see this returned after you authenticate.

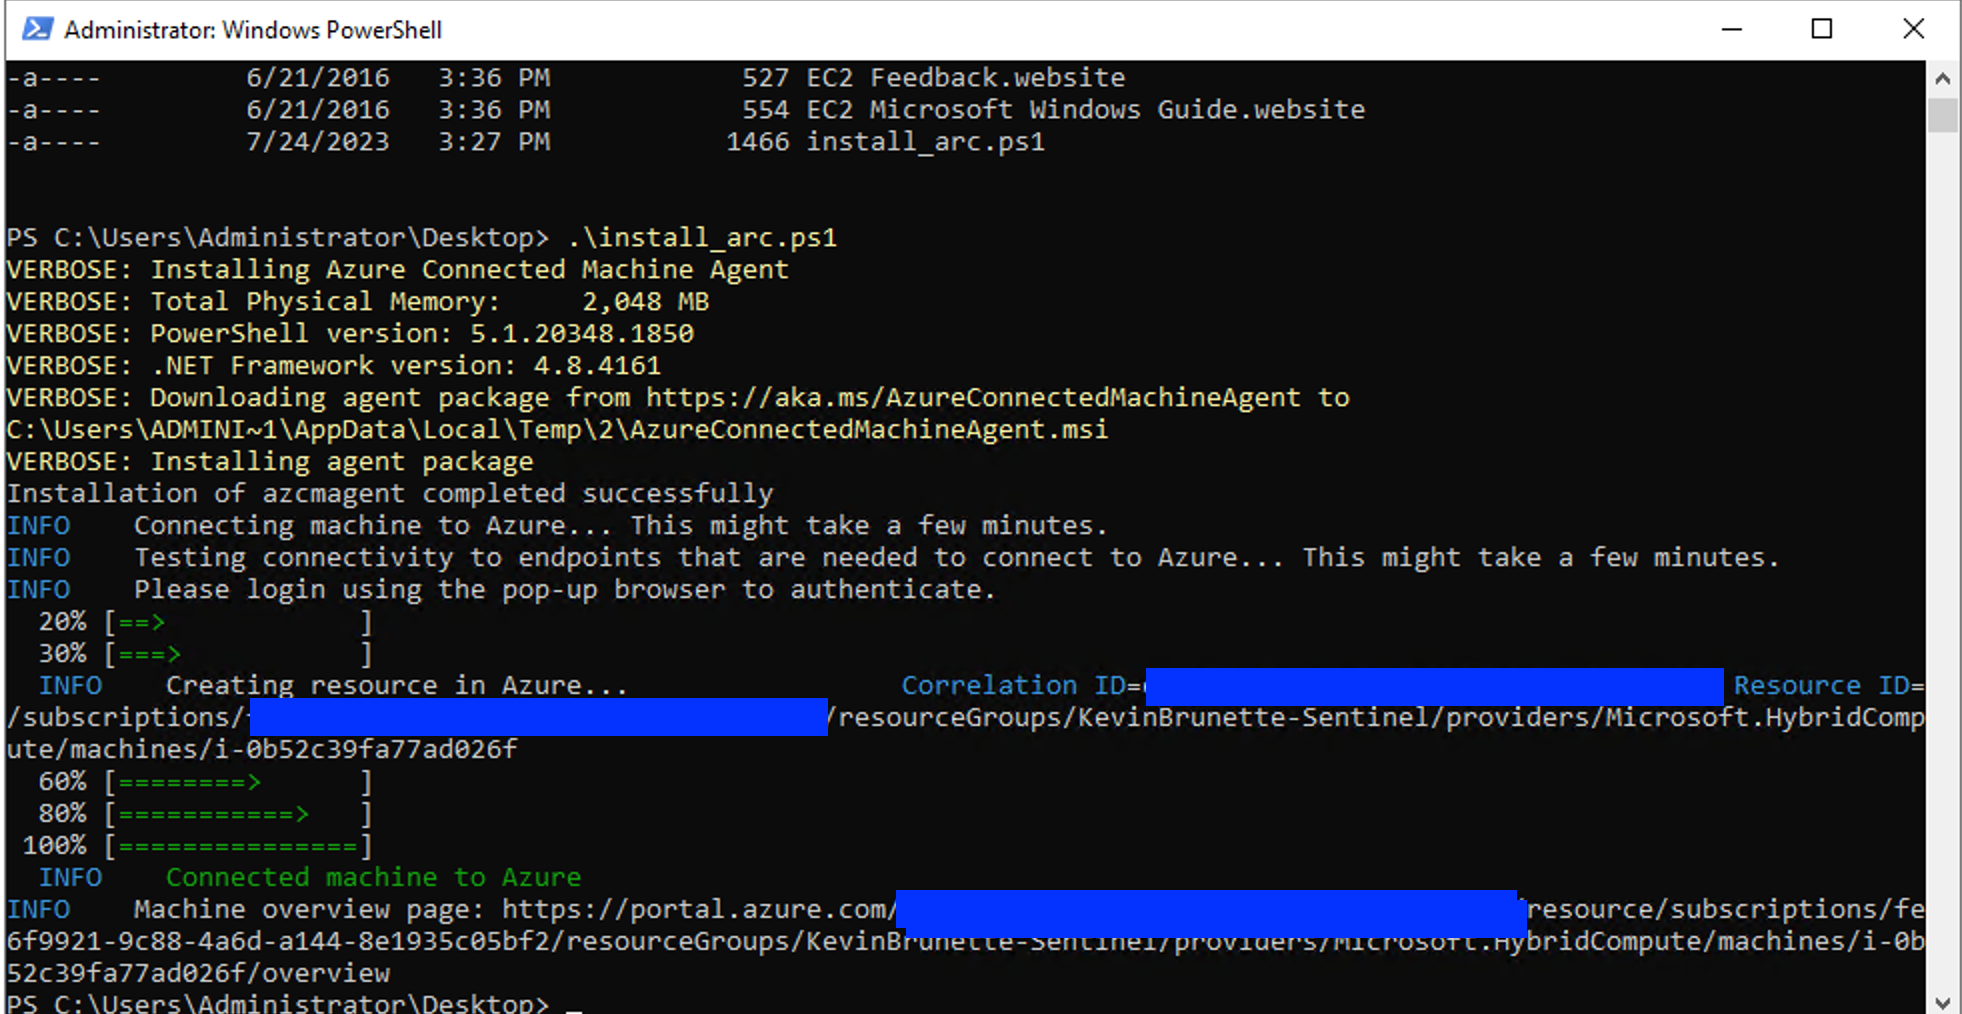
Check the Powershell terminal after you run the script and check the status. You should see a “Connected machine to Azure”.

Step 3: Create Data Collection Rule (DCR) to collect basic Events
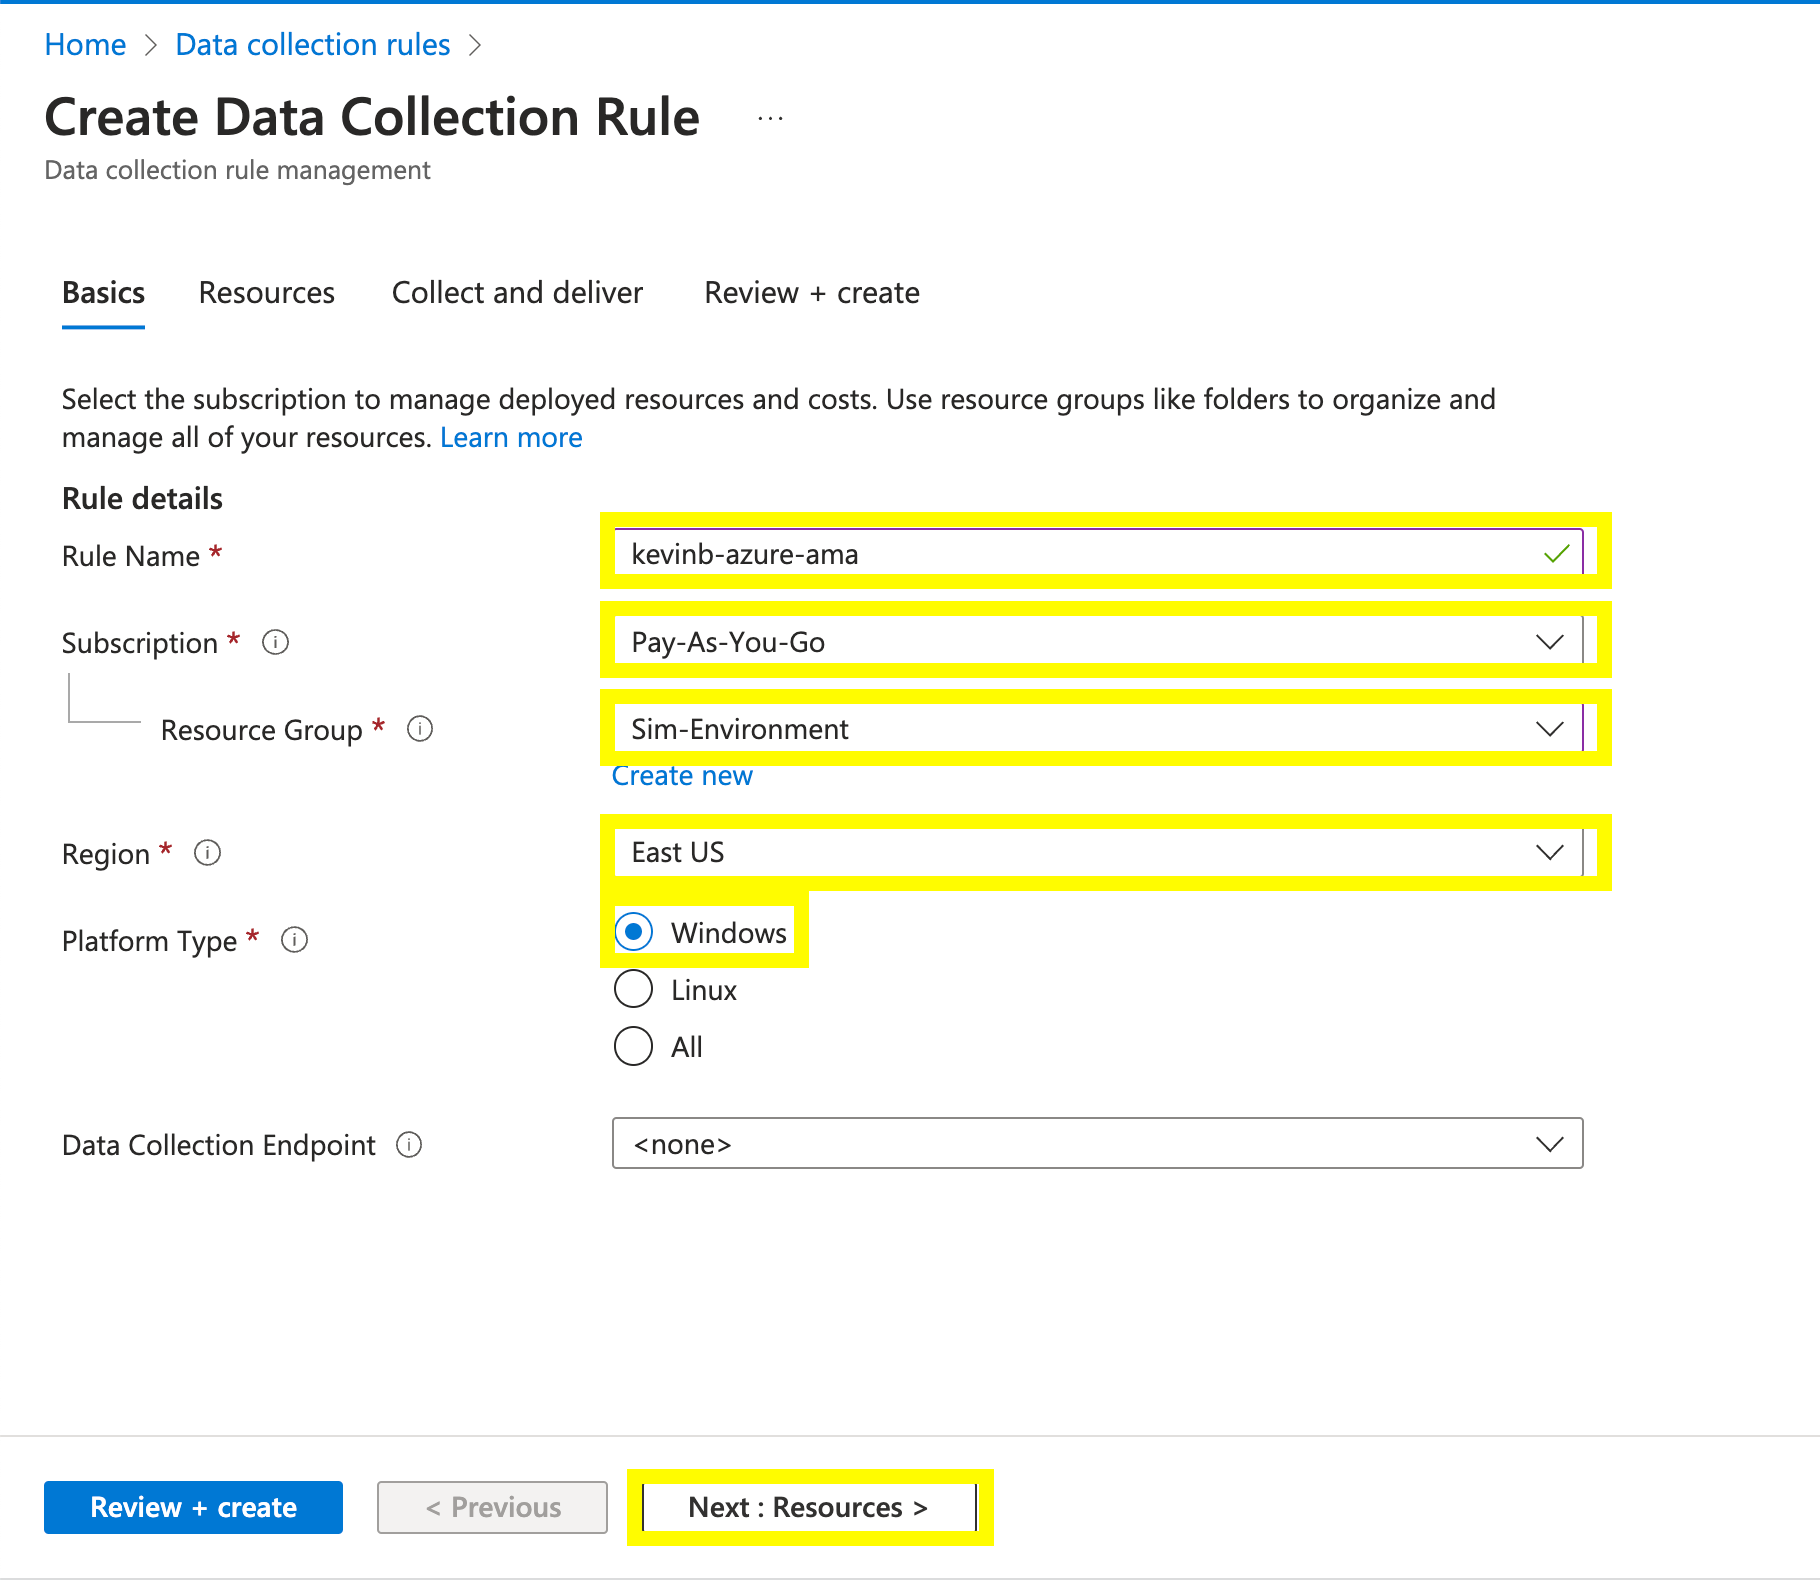
The next step is for us to create a simple Data collection to start collecting Windows events. Search for “Data Collection Rules” and hit “Create” on the top.
Add in the resource details.

In the Resources select “Add Resource” and find your VM by instance ID.

Click “+ Add a source” and choose the type of data to collect. In my example, I want to collect “Windows Event Logs” and I’m configuring to collect all log information and types. Click “Next: Destination” once finished.

Under the “Destination” select the workspace(s) you’d like to send this data.
Finally, select “Add Data Source”.

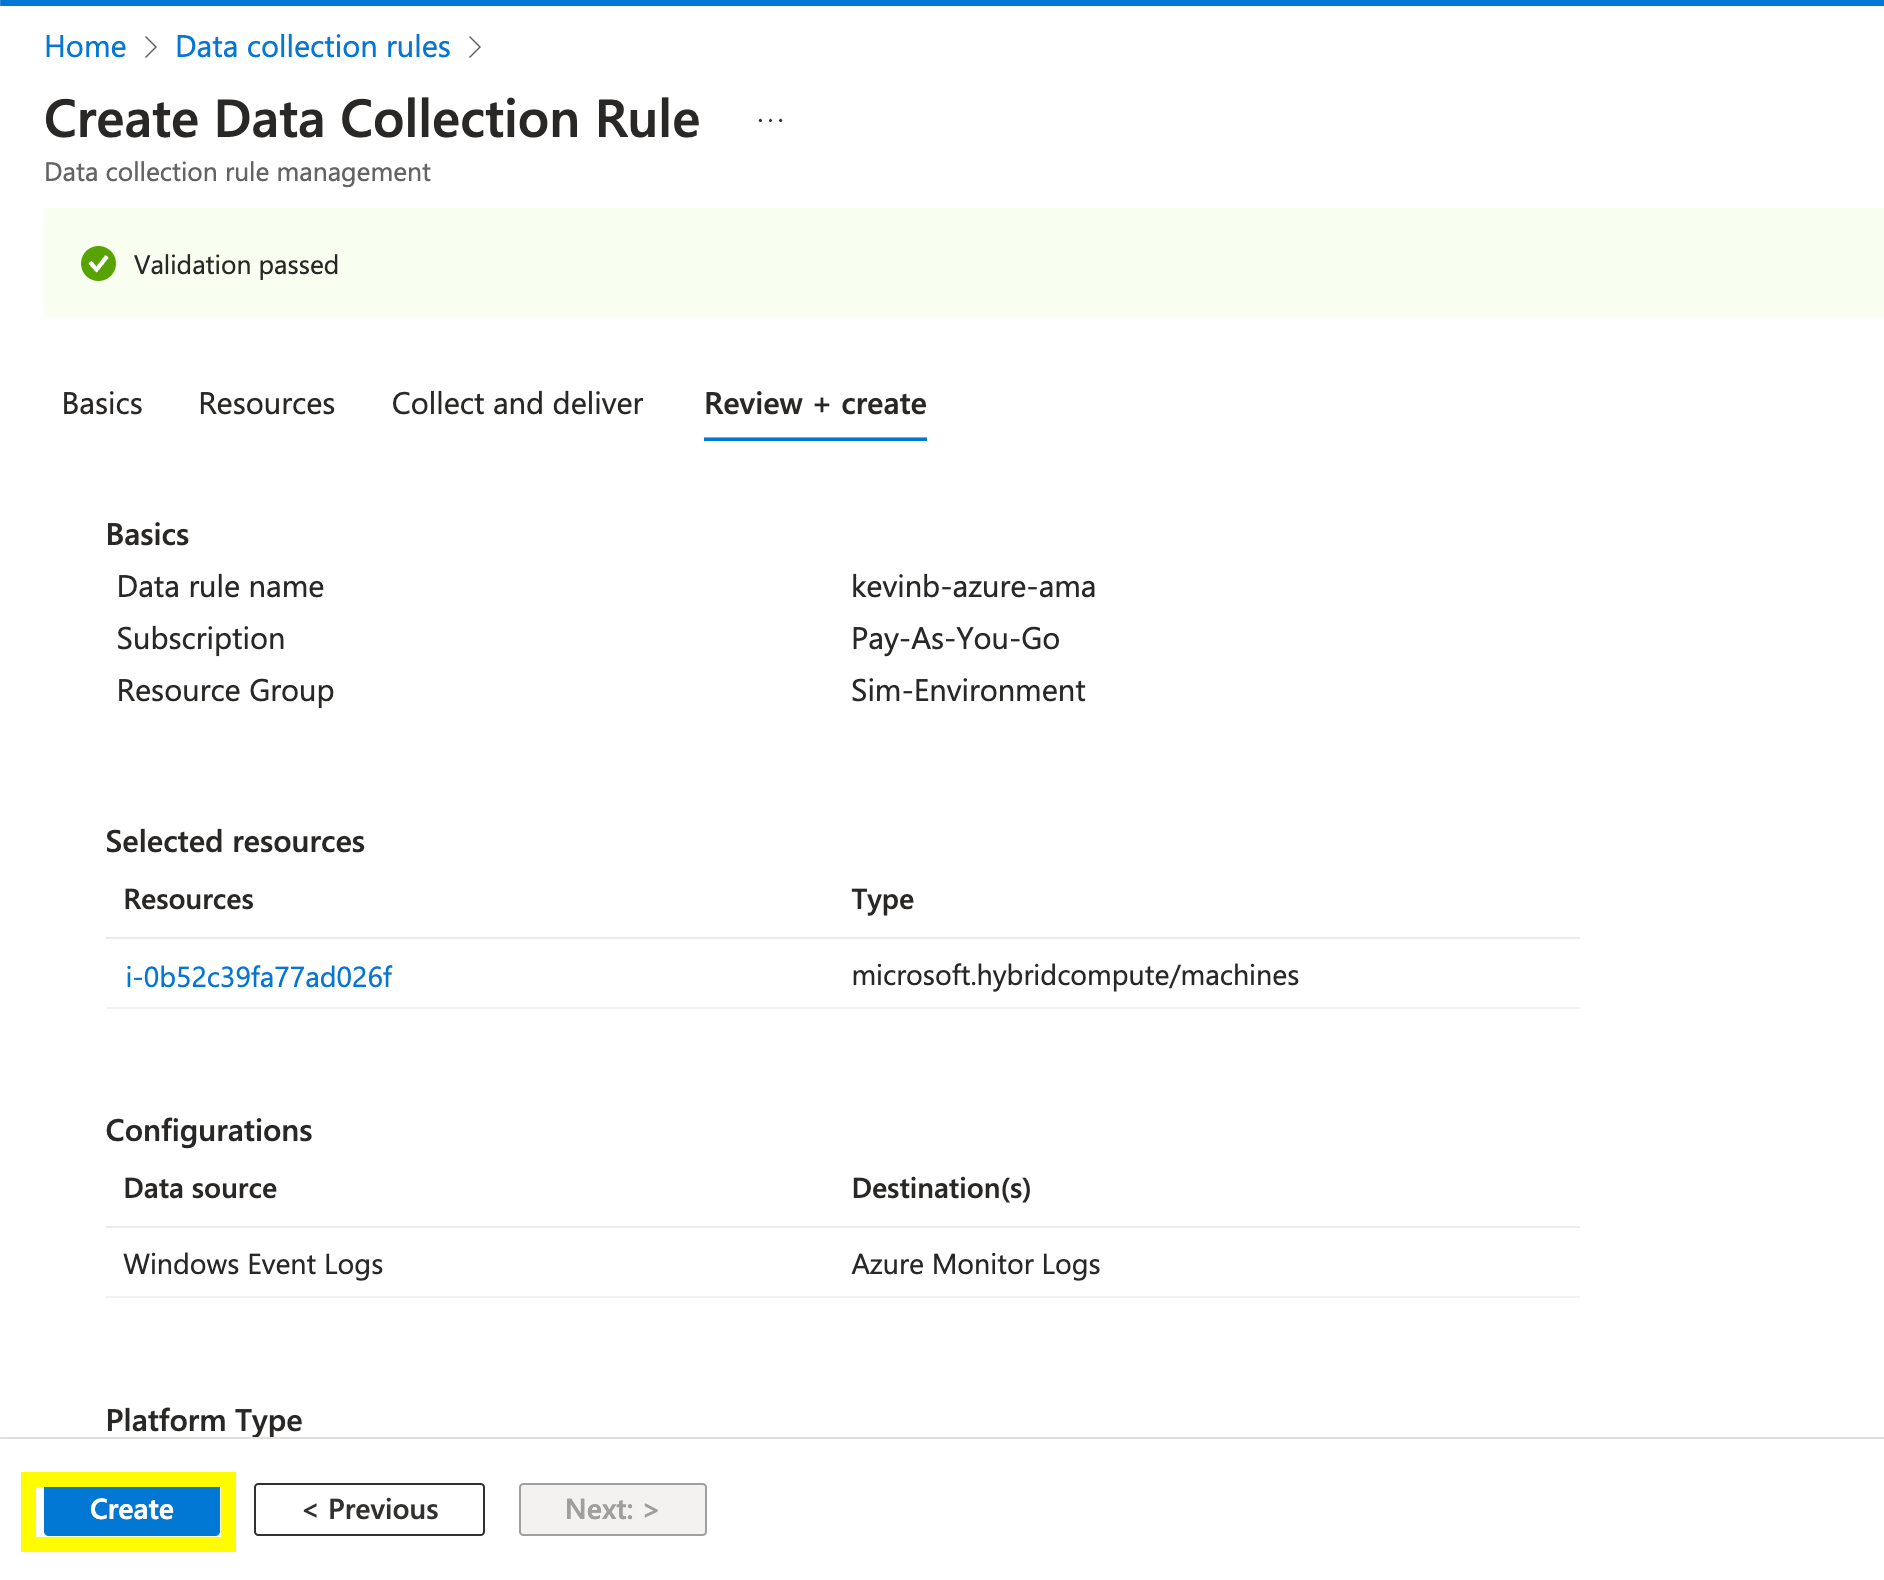
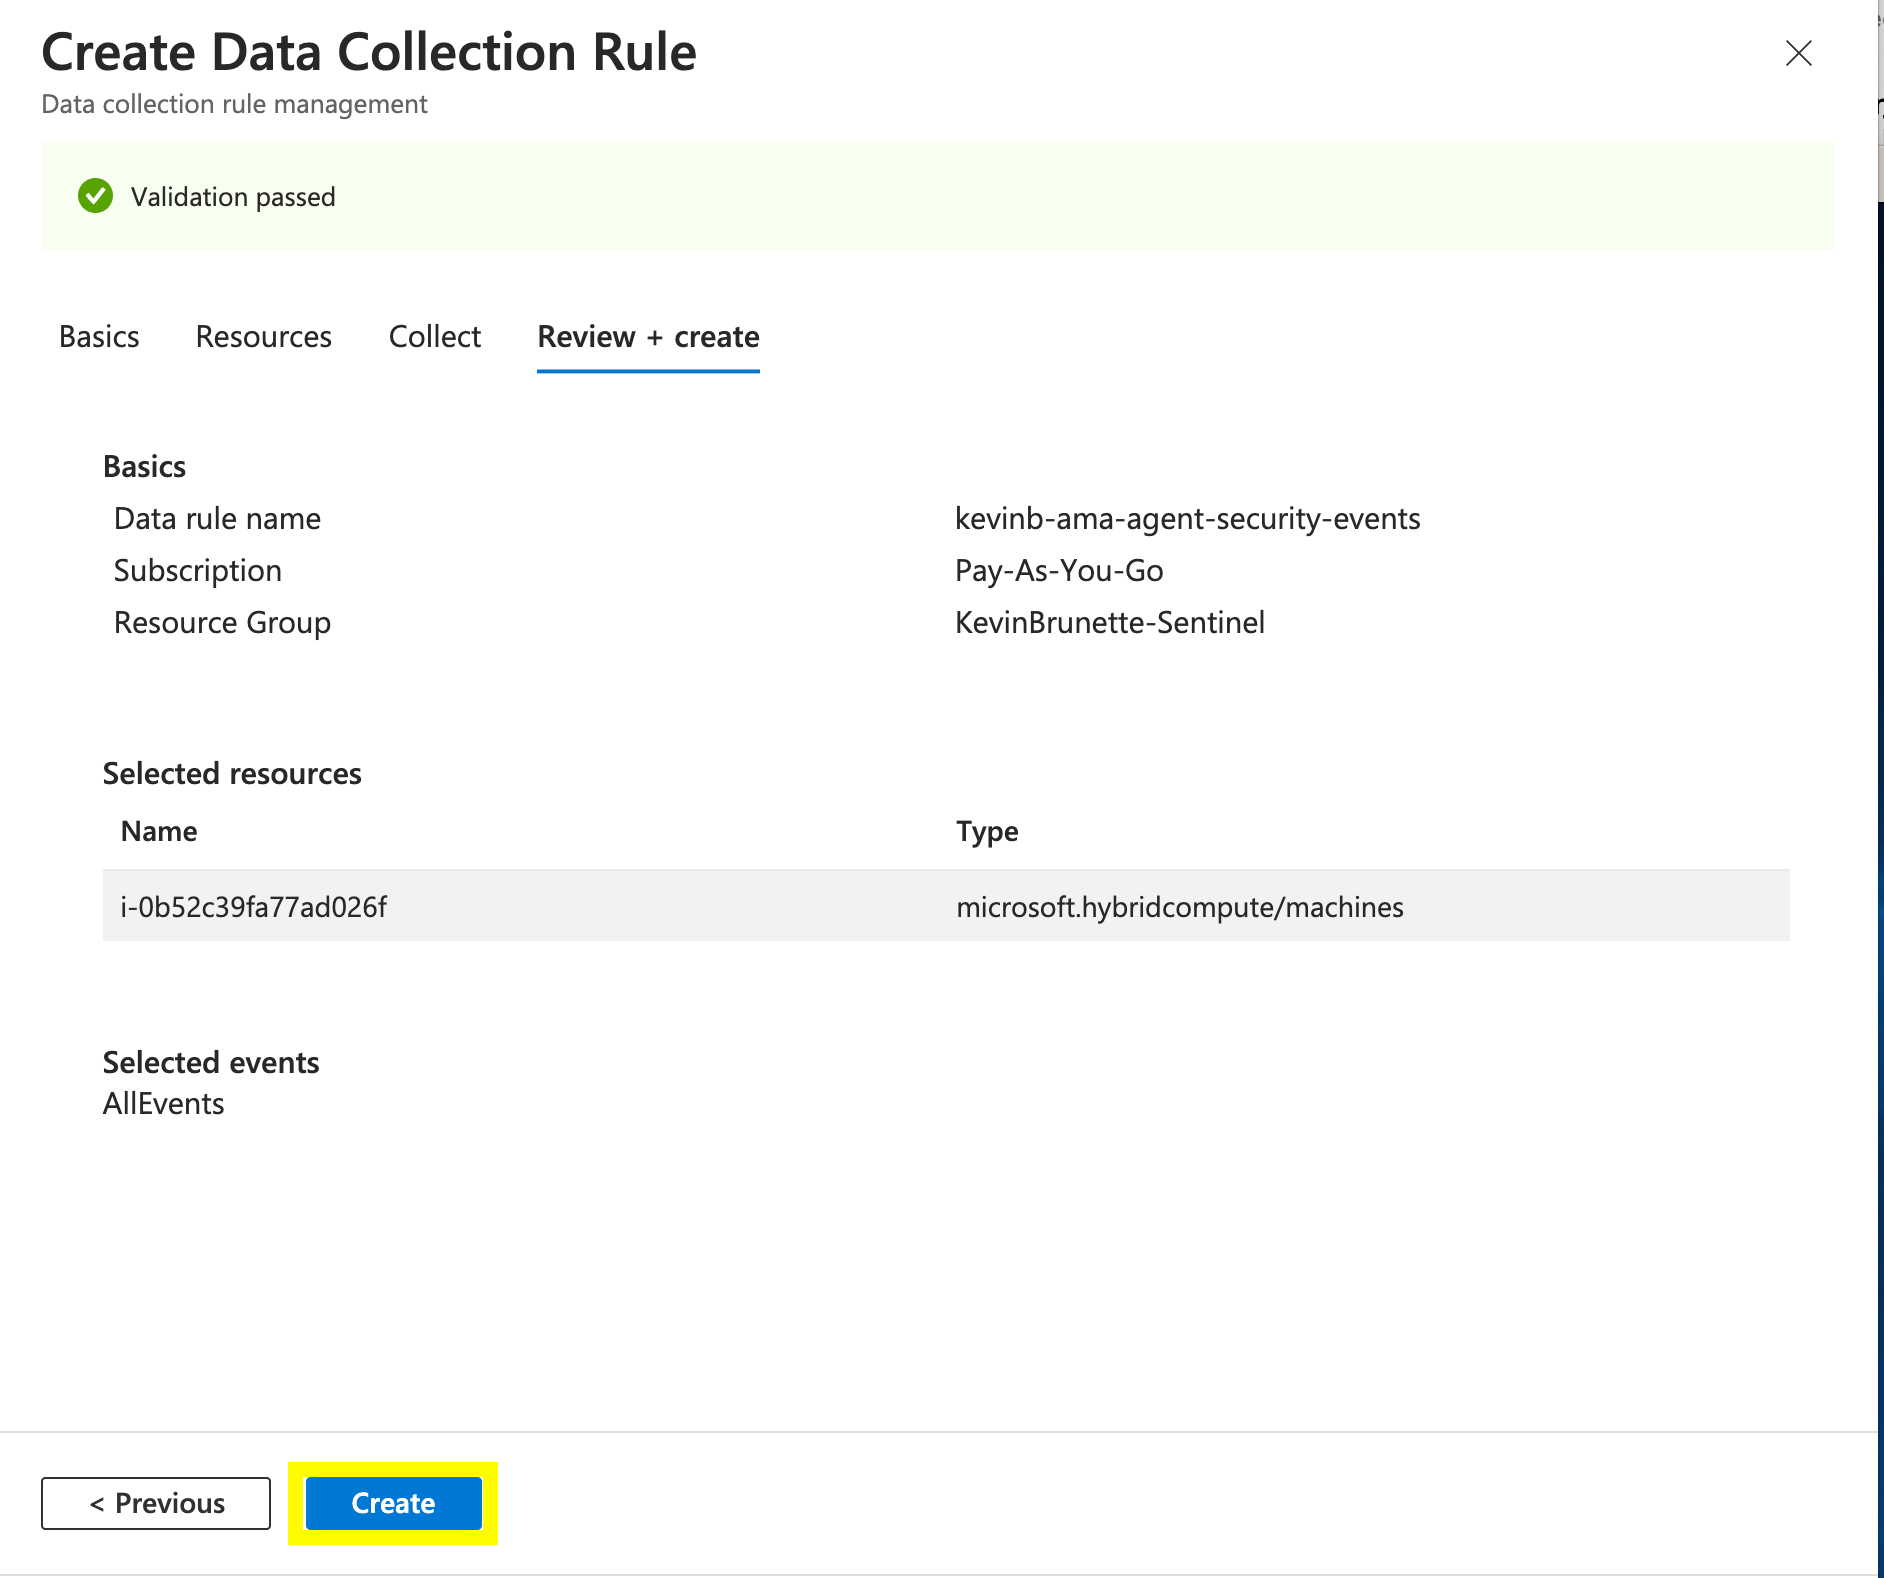
Click “Create”.

You should see this!

Step 4: Verify Agent Connectivity to Log Analytics Workspace
Let’s check our analytics workspace to see if the agent is registered.
Go to your Log Analytics workspace and select “Agents” on the left rail.

Looks like we have a few agents registered, but let’s be 100% confident the VM we just configured is registered with our workspace. Click the “See them in Logs” link.
This will open this pane running a default KQL query. Verify that your agent is within the list.
From my end, it looks good as I see my VM name and IP.

We can also check for standard “Events” coming in from the AMA agent by running a simple Kql query with your Windows host name.
Event | where Computer has("EC2AMAZ-8RJR126")
Woohoo! We are now getting basic Windows events.

Step 5: Enhancing our AMA agent to use the SecurityEvents connector
We’ve got Arc installed and are getting basic Windows event data into our Sentinel analytics workspace. Let’s enhance it by using the Data connector to tell the AMA agent to pull in SecurityEvents and send it to the “SecurityEvents” Sentinel table for more enhanced Security data.
First, go to your Microsoft Sentinel instance and select the “Data connectors” on the left rail.

Click on “Content Hub” under “More content at”.

Search for “Security Events” and select the “Windows Security Events” connector. In the bottom right if it is your first time adding this extension it should say “Install”. In my case, I’ve already installed it, so I will hit “manage”.

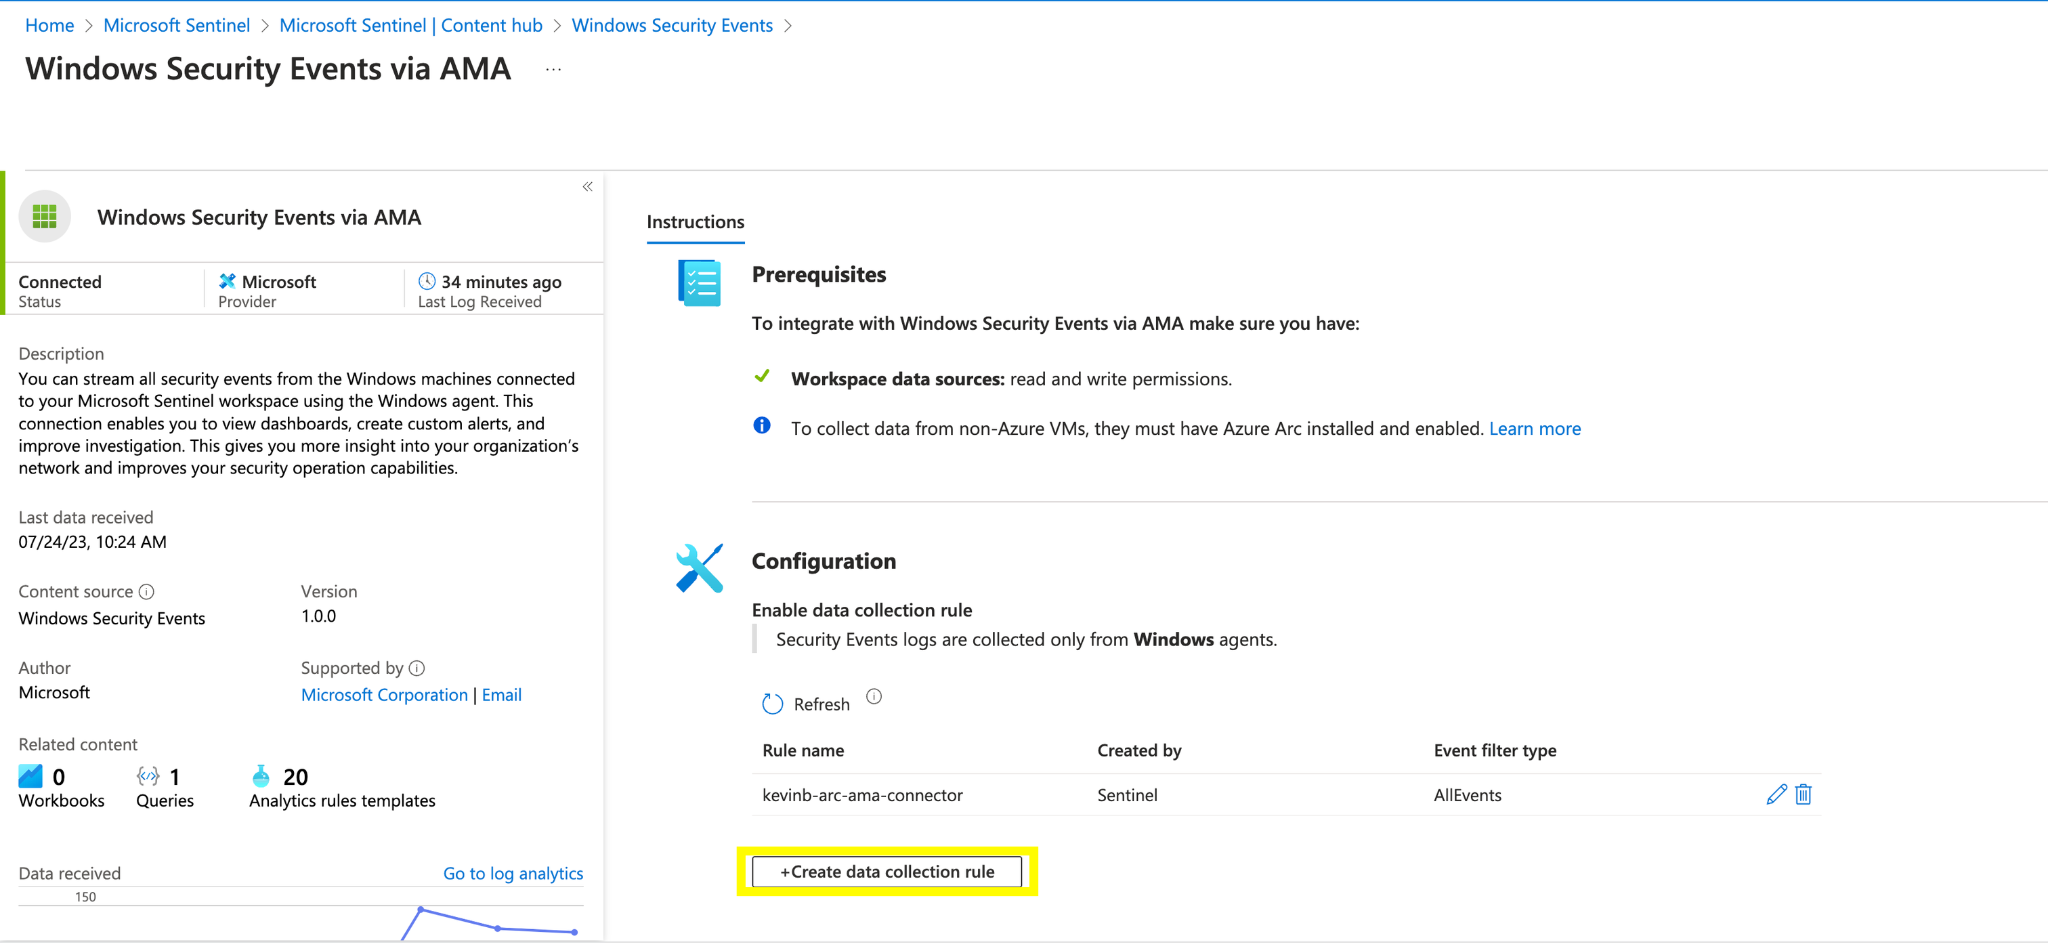
In the “Windows Security Events” connector pane, select the “Windows Security Events via AMA” and select “Open Connector page”.

Now we need to create a DCR rule. You can either create a new rule and/or modify an existing rule to start pulling in SecurityEvents to the SecurityEvent Sentinel table.
In my case, I am going to create a new one.

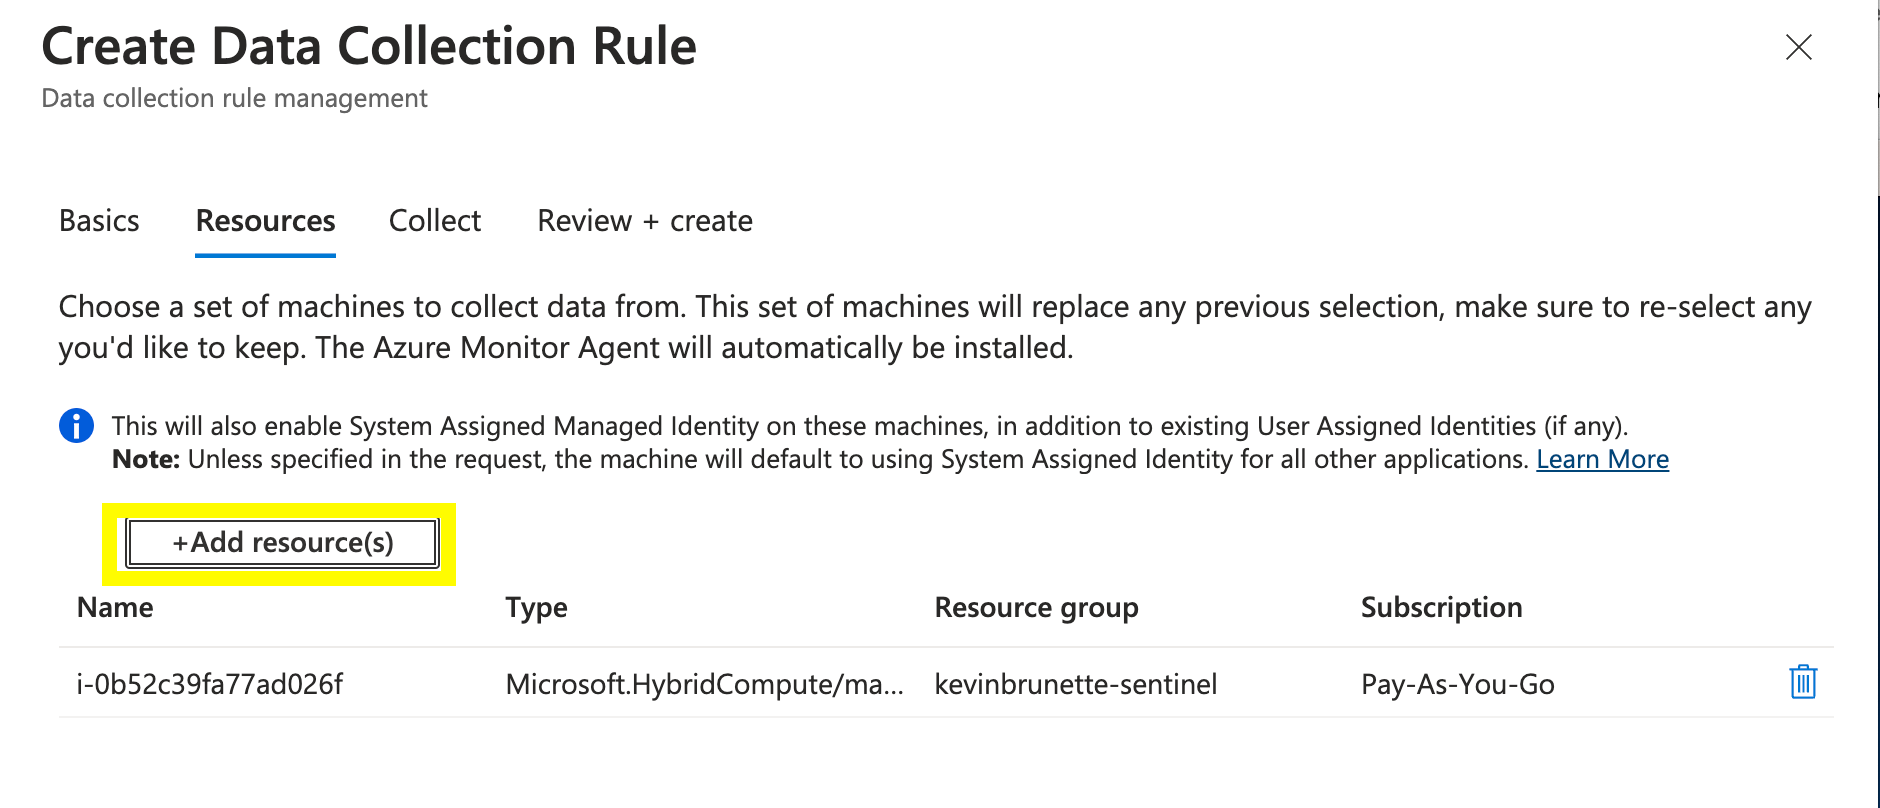
Similar to our previous DCR creation example, fill in the resource details and after click: “Next: Resources”.

Add our resource by hitting “+Add resource(s)”.

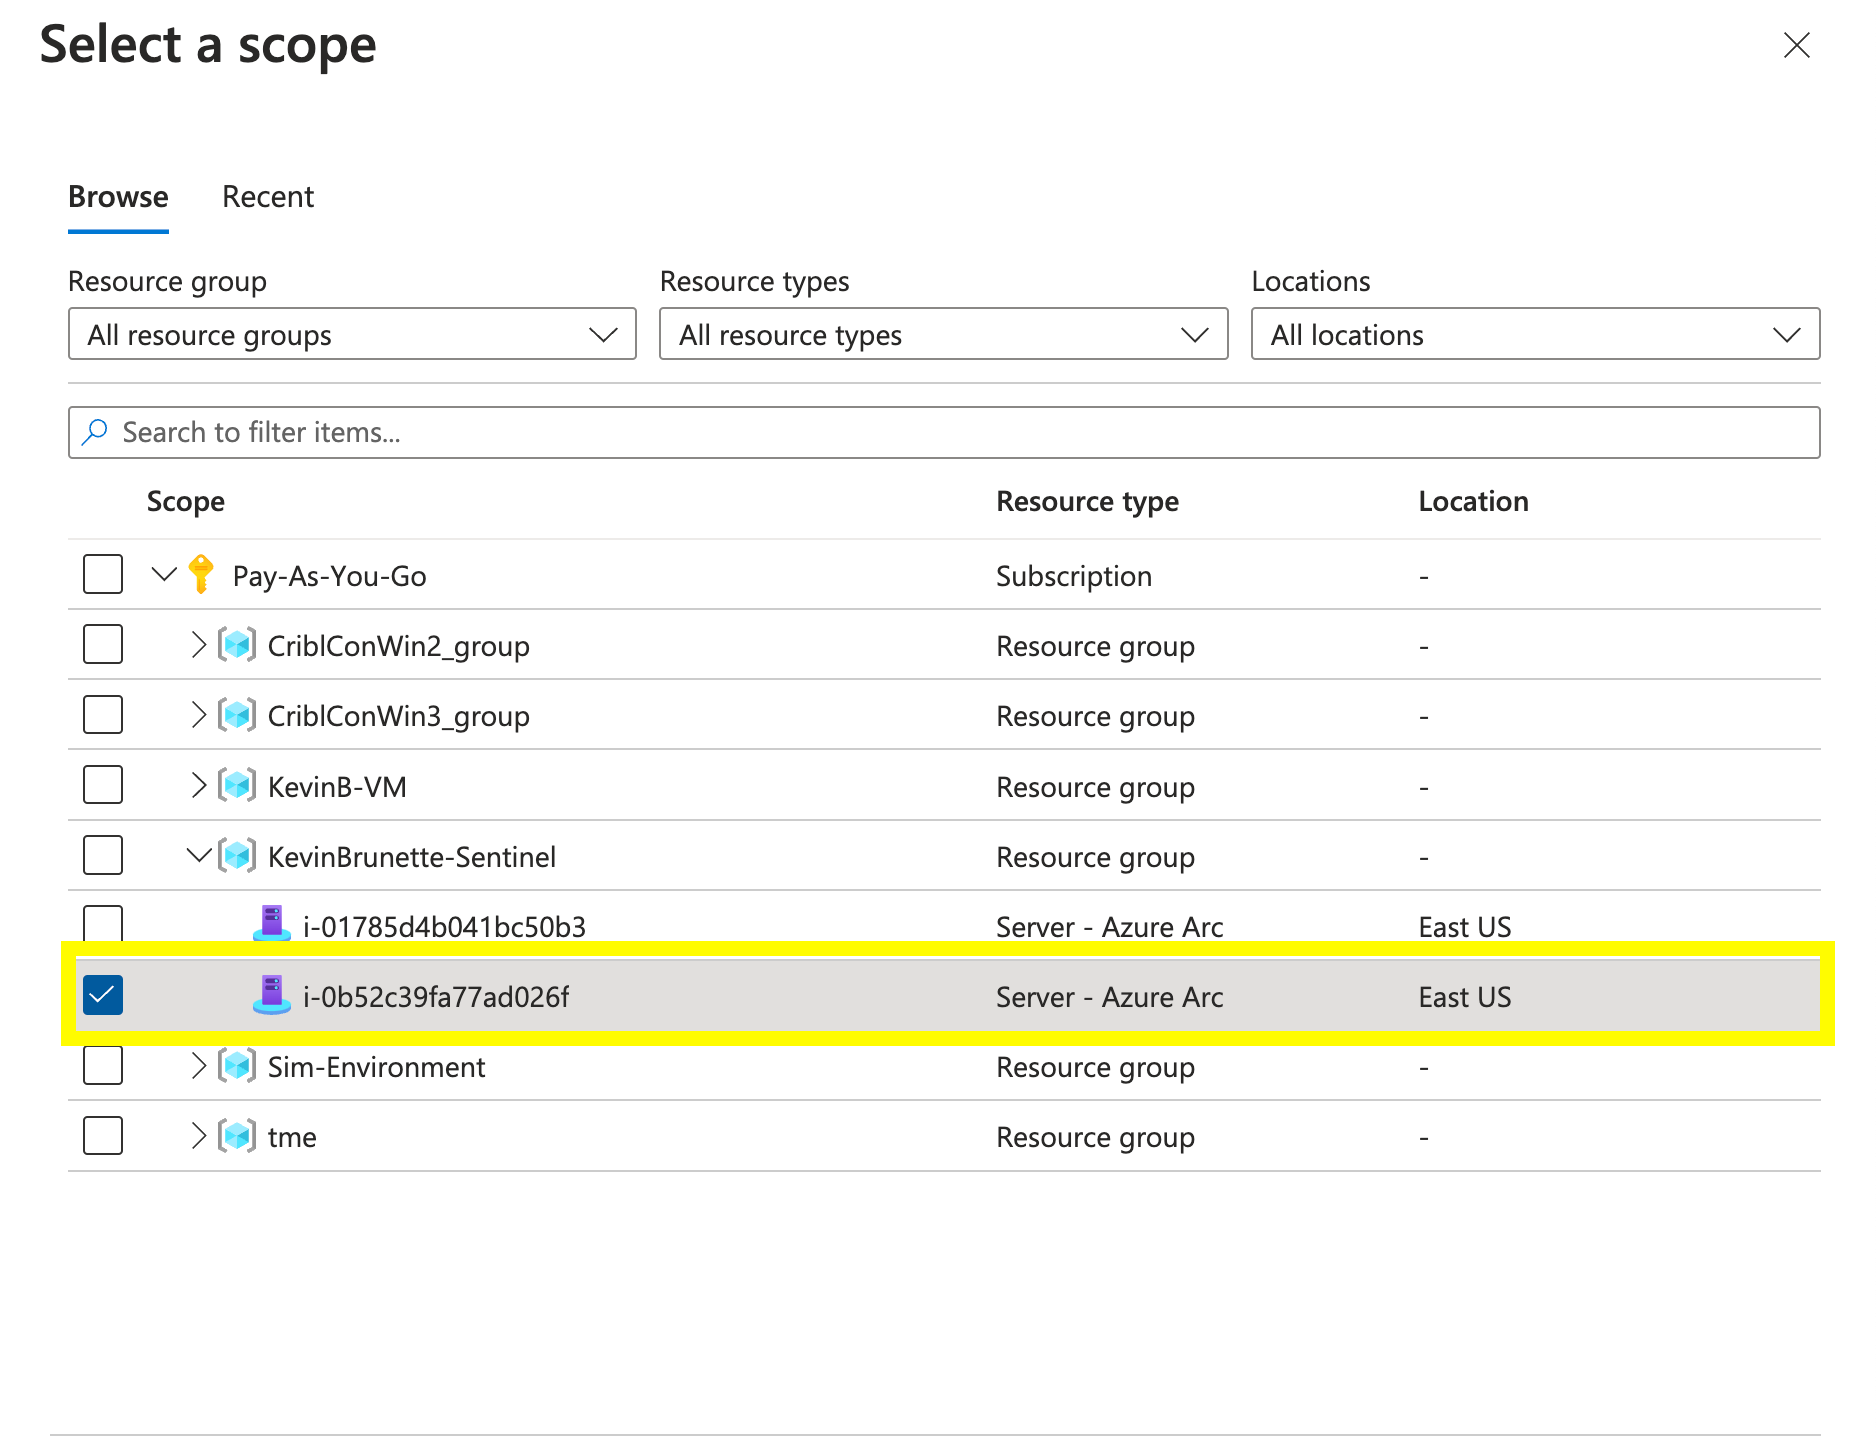
Find your VM you have installed the AMA agent on. Add it.

Select the type of security events. I am going to collect all of them. Hit “Review and create”.

Hit “Create”.

Step 6: Verifying the collection of SecurityEvents Data
Generate some Windows Security events. For example, log off and log back in, starting a random process, and adding a user are common security events.
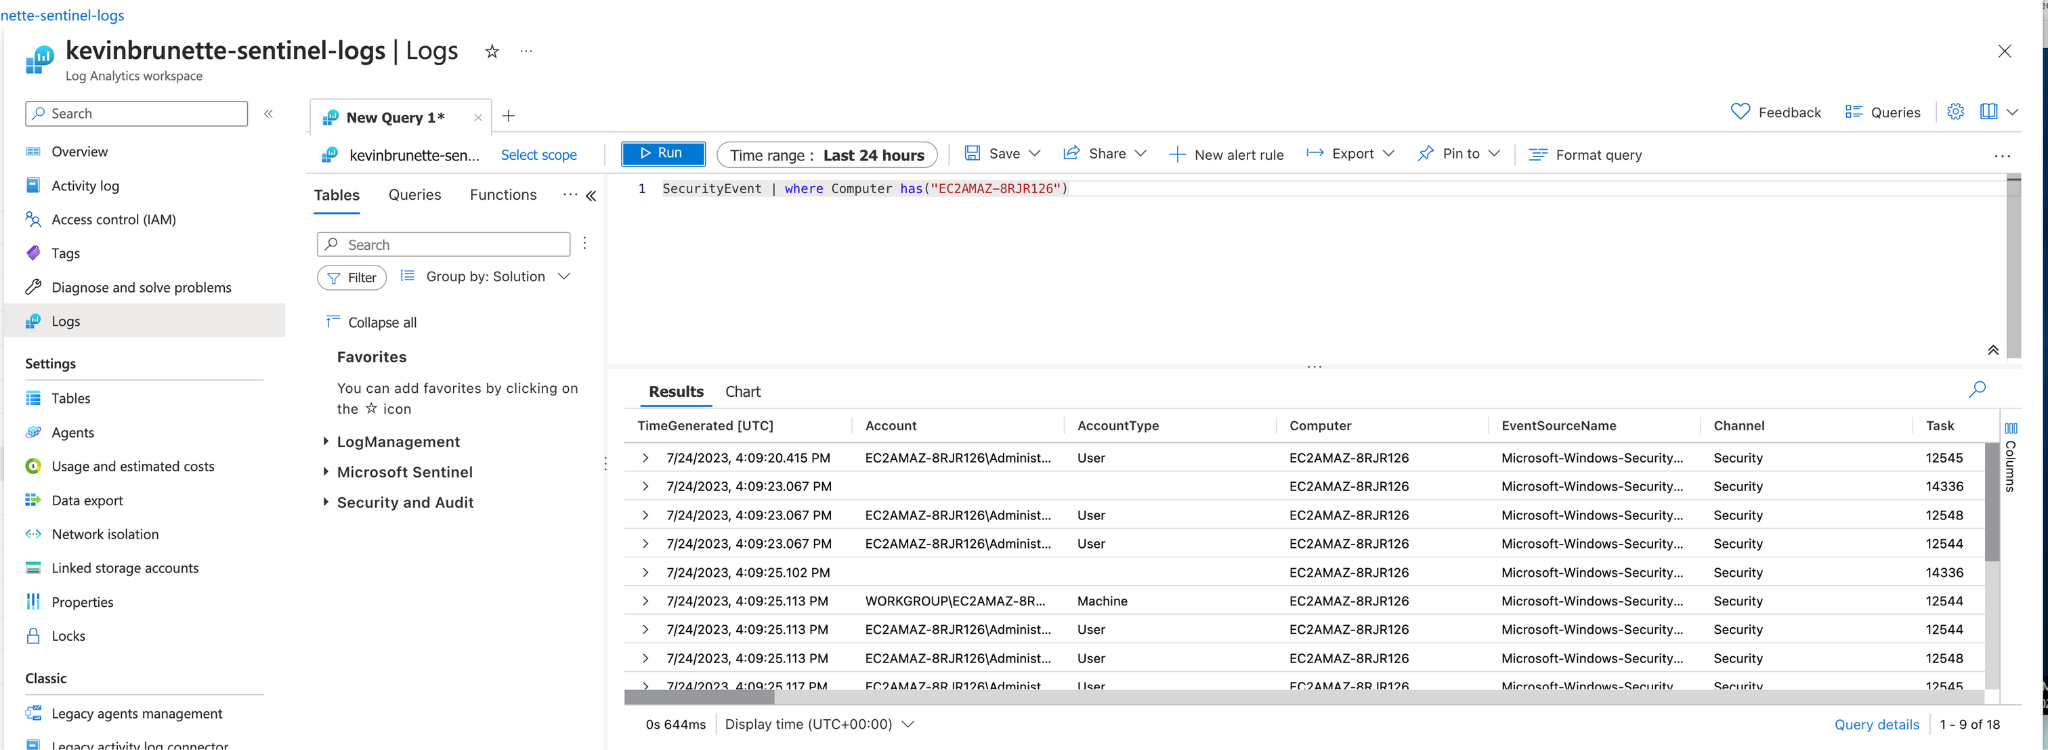
Let’s run a simple query to see if we are getting Windows Security Events into the SecurityEvent Sentinel table.
We can use a kql query to check if our host is successfully sending security events to the SecurityEvent table. Go to the log analytics workspace and run the following query.
SecurityEvent | where Computer has("EC2AMAZ-8RJR126")
Looks like we are getting SecurityEvent data back! 
Step 7: Troubleshooting the Windows AMA agent
If you aren’t seeing the agent connect to your log analytics workspaces here’s a few things to check:
Microsoft has also provided a document to help troubleshoot which is very useful.
That’s All Folks
Whew! That was A LOT of steps and hopefully, at this point, you’ve got the hang of onboarding some Windows and Linux using Azure Arc to send data into Microsoft Sentinel. Please reach out to me via email if you have any questions, comments, and/or feedback. As we said at the beginning, Cribl Stream makes this process a lot easier, and we’ve got a much simpler guide to get you started
Glossary
Common Sentinel Terms
Alright, this section is kind of boring, but I feel it’s necessary to go over some common terms so that you have an understanding of them when they are referenced in the guide.
- Common Event Format (CEF) – You’ve probably heard me mention CEF and wondered what the heck is it. Common Event Format (CEF) is an industry-standard format on top of Syslog messages, used by many security vendors to allow event interoperability among different platforms. It’s a universal log format supported by many vendors including ExtraHop, Palo Alto Networks and Fortinet (just to name a few) that can be sent via the Syslog protocol (https://learn.microsoft.com/en-us/azure/sentinel/connect-common-event-format).
- CommonSecurityLog – This is the Microsoft log format in Sentinel where CEF compliant log messages will be parsed and translated (provided everything is configured correctly). Think of this as the Microsoft flavor of CEF. A guide for the conversion is here.
- Data Collection Rule (DCR) – A data collection rule or a DCR is referred to https://learn.microsoft.com/en-us/azure/azure-monitor/essentials/data-collection-rule-overview. Data collection rules (DCRs) define the data collection process specifying what data should be collected, how to transform that data, and where to send that data. In this guide, we will be configuring a DCR to tell our Azure arc-enabled servers to collect Syslog and/or Windows events.
- Azure Arc – Azure Arc-enabled servers let you manage Windows and Linux physical servers and virtual machines hosted outside of Azure, on your corporate network, or another cloud provider. In Azure Arc, machines hosted outside of Azure are considered hybrid machines.
- Azure Connected Machine Agent (AMA) – This comes in two flavors for either Linux or Windows. Often referred to as an “Extension” in Azure Arc and/or a connector. It will automatically be enabled when a DCR is applied to a server resource if the DCR is to collect Syslogs, Windows events, and/or performance counters.
- OMS Agent – Also referred to as the “Log Analytics” agent, this is the legacy agent that is being deprecated and will no longer be supported as of August 2024. Confusing the matter, you will often see references to this agent throughout the Microsoft documentation and in Microsoft Sentinel UI (I.E. Under the “Agents” tab). This agent will still work to collect data and if you so choose to use it, this guide will not help you and it is highly recommended that the AMA agent be used in place of the OMS agent.
- Data Connectors – Out-of-the-box configurations for Microsoft Sentinel, which help to onboard and analyze data very quickly. Think of these as “content packs” that come with analytic rules, dashboards, and alerts. They are often written by vendors like Palo Alto Networks and Cisco for example and are designed to easily ingest and understand specific data types.
As mentioned in the previous term definition page, the OMS agent, often referred to as the “OMS Agent” is being deprecated and should NOT be used. It will still work however; support for this agent will end in August of 2024.
Making matters worse is the old documentation and references to the OMS agent within the Microsoft Sentinel portal and UI.
Cribl, the Data Engine for IT and Security, empowers organizations to transform their data strategy. Customers use Cribl’s suite of products to collect, process, route, and analyze all IT and security data, delivering the flexibility, choice, and control required to adapt to their ever-changing needs.
We offer free training, certifications, and a free tier across our products. Our community Slack features Cribl engineers, partners, and customers who can answer your questions as you get started and continue to build and evolve. We also offer a variety of hands-on Sandboxes for those interested in how companies globally leverage our products for their data challenges.
