
One of the most shocking things to me during the current COVID-19 crisis is that the infrastructure we’ve come to depend upon for our work, entertainment, and lifeline to the outside world has continued to function quite well despite surging demand. Our home Internet has become like the dial-tone it replaced, and Netflix and other streaming services like our cable.
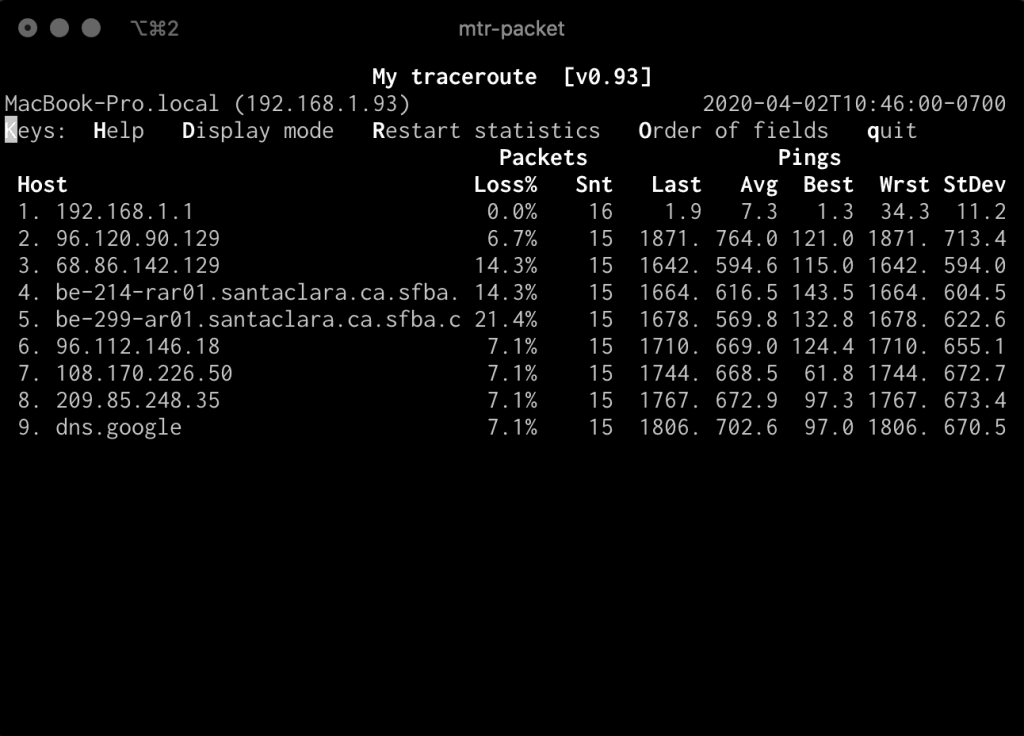
We expect it to be on and working. That being said, I saw a tweet from Luke Demi over at Coinbase (whom I’ve been following since his excellent Monitorama presentation last year) complaining about latency from his house. I suggested he check out mtr, a cool Linux utility which is kind of a hybrid of traceroute and ping. mtr will look along the route between you and the destination you specify and continually ping all the hops along that path and display information on latency and packet loss. This is incredibly useful from the perspective of the end user to understand along which hops they may be experiencing loss or higher latency.
When I was running mtr myself after suggesting it to Luke, I noticed my latency was much higher than I’d come to expect, which correlates with some general slowness I’ve been seeing on my own Internet performance lately.
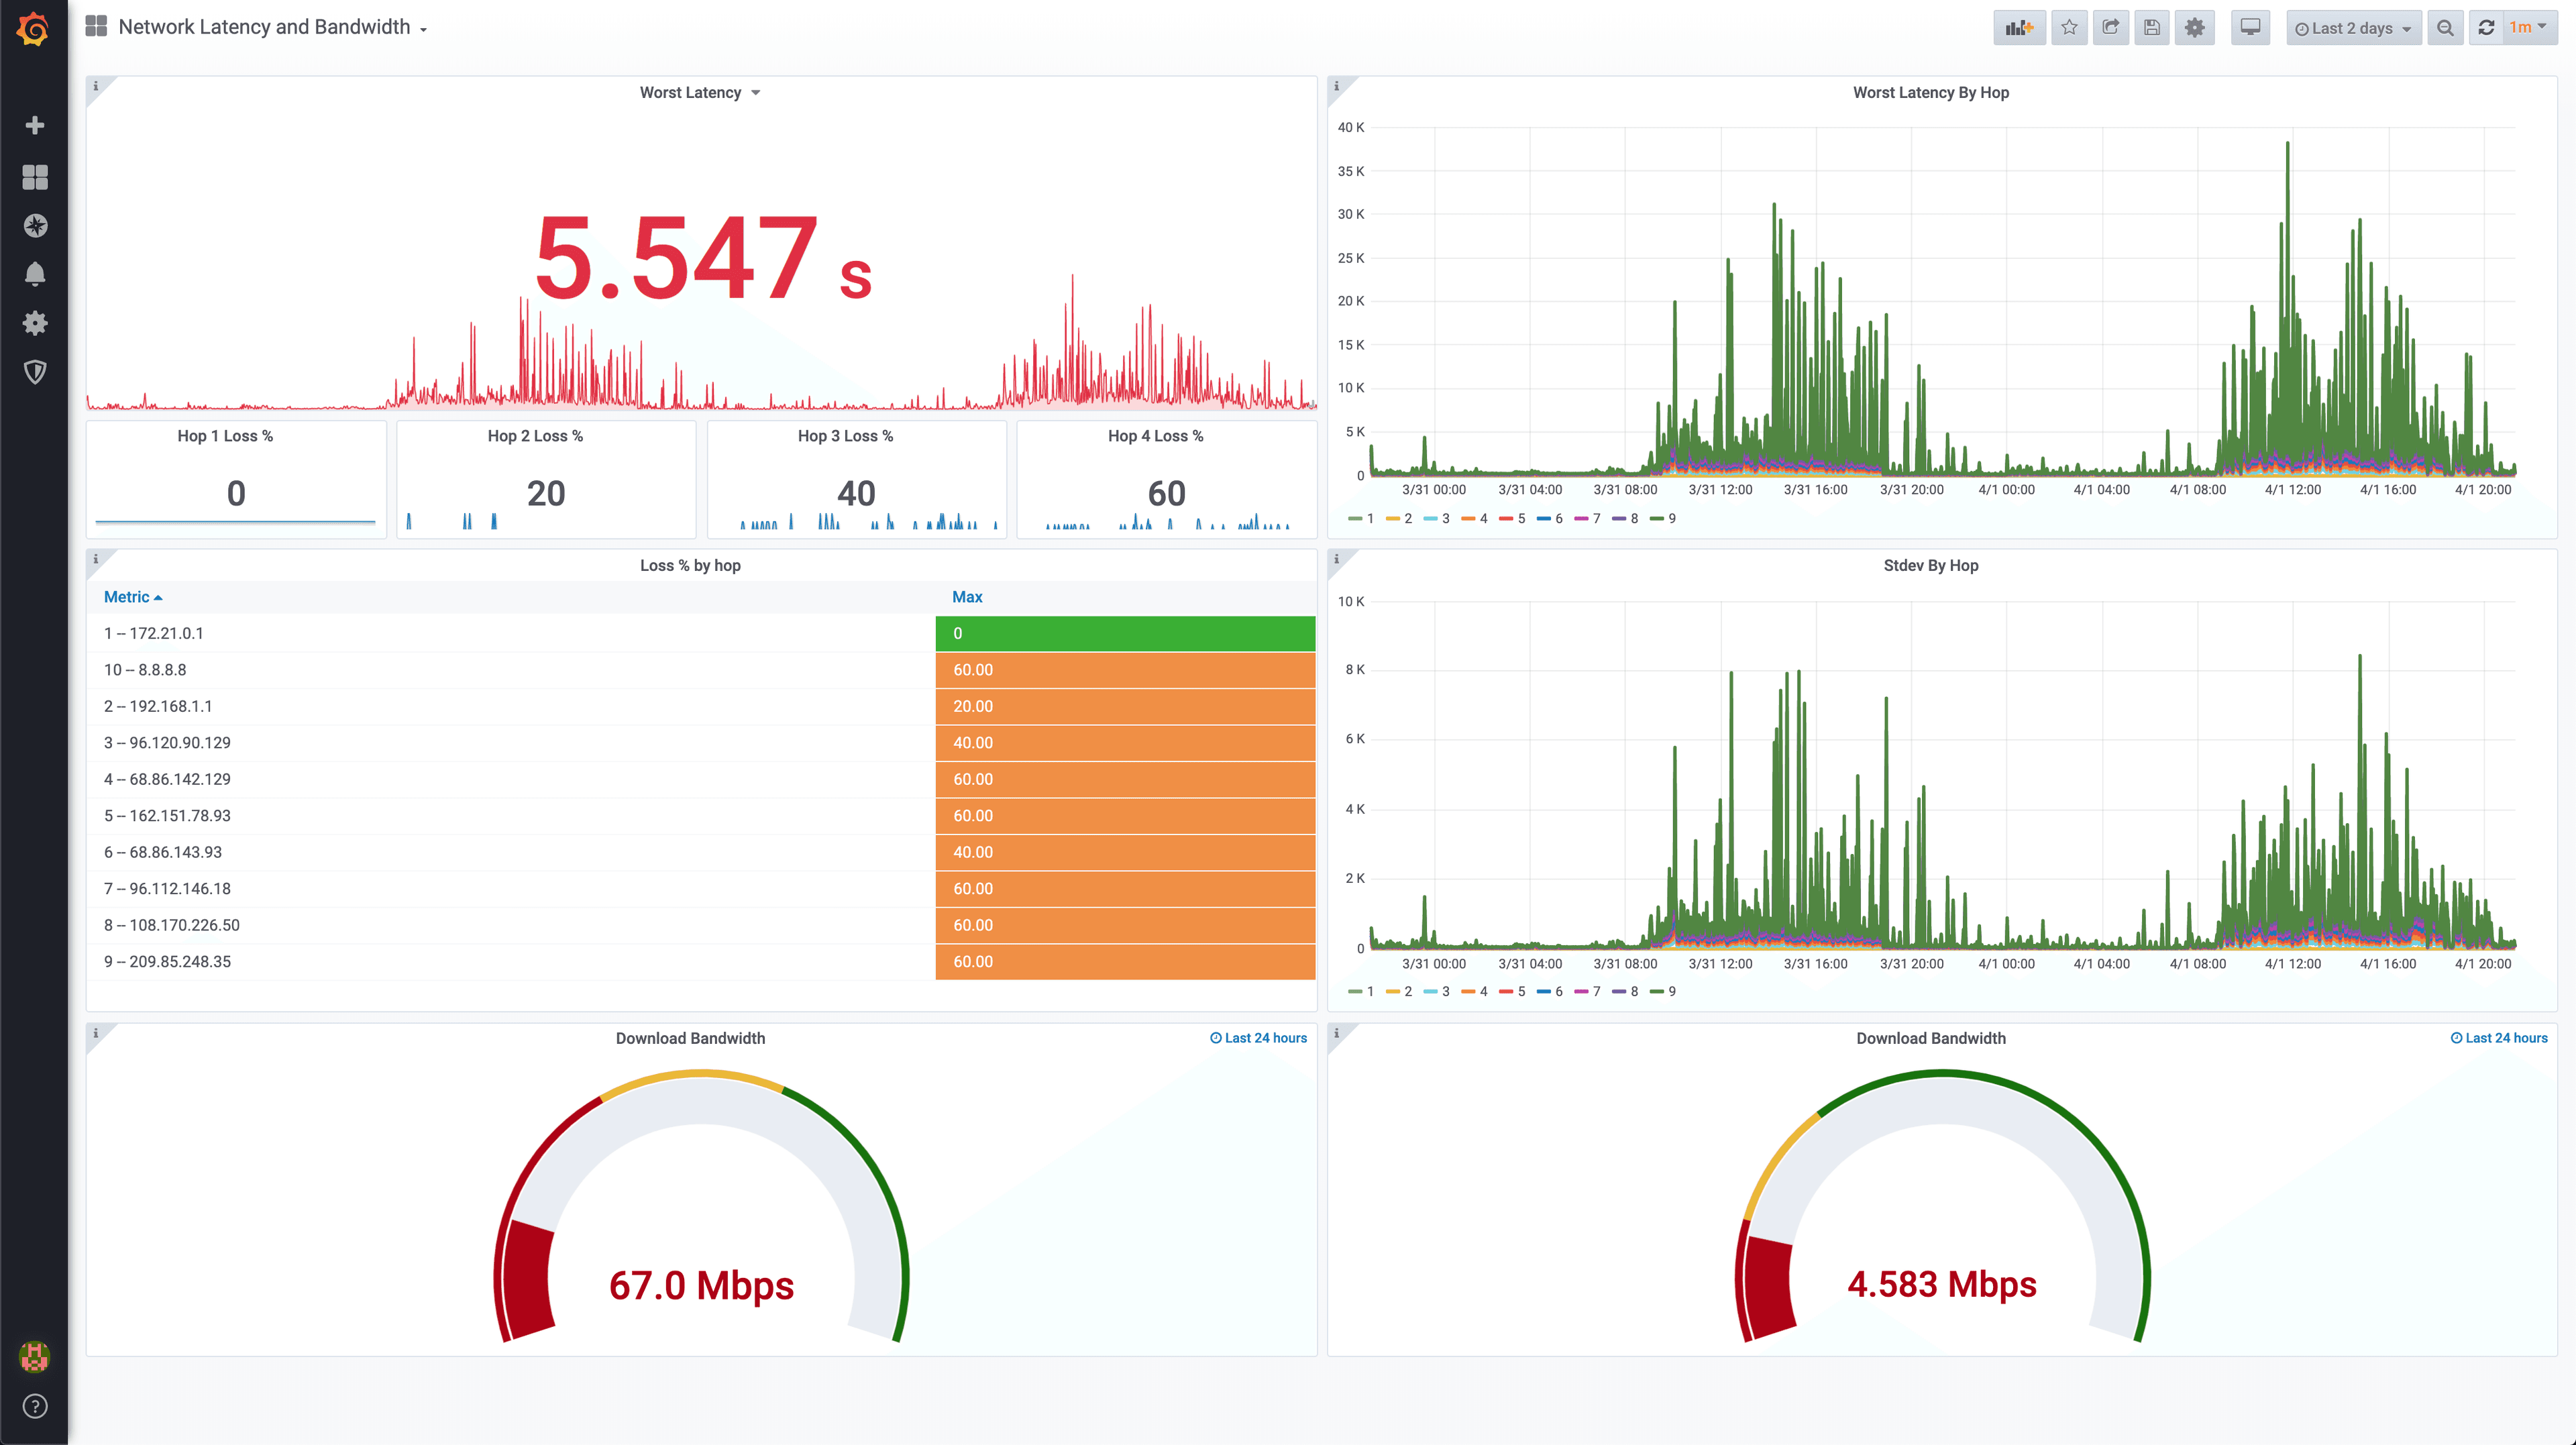
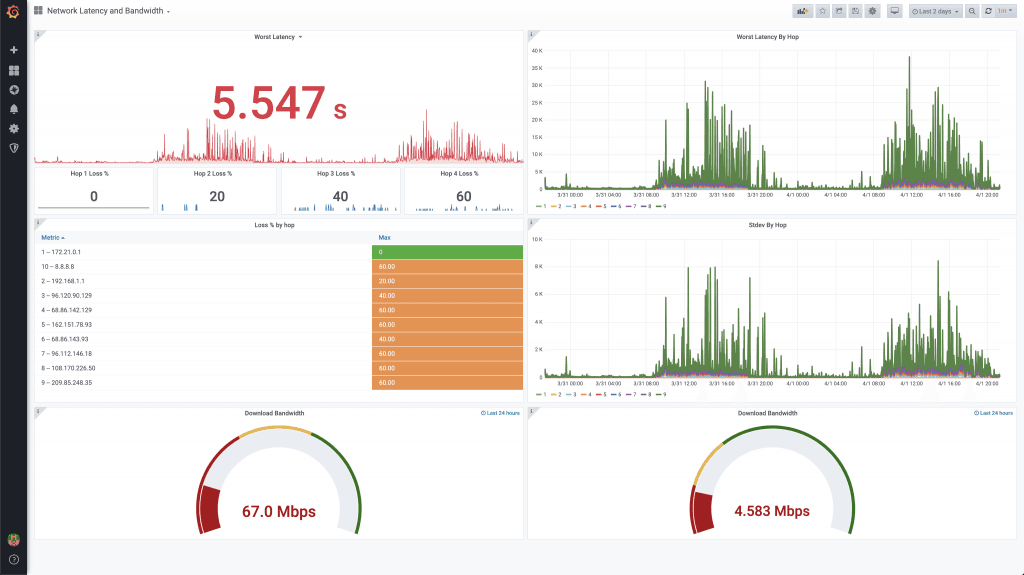
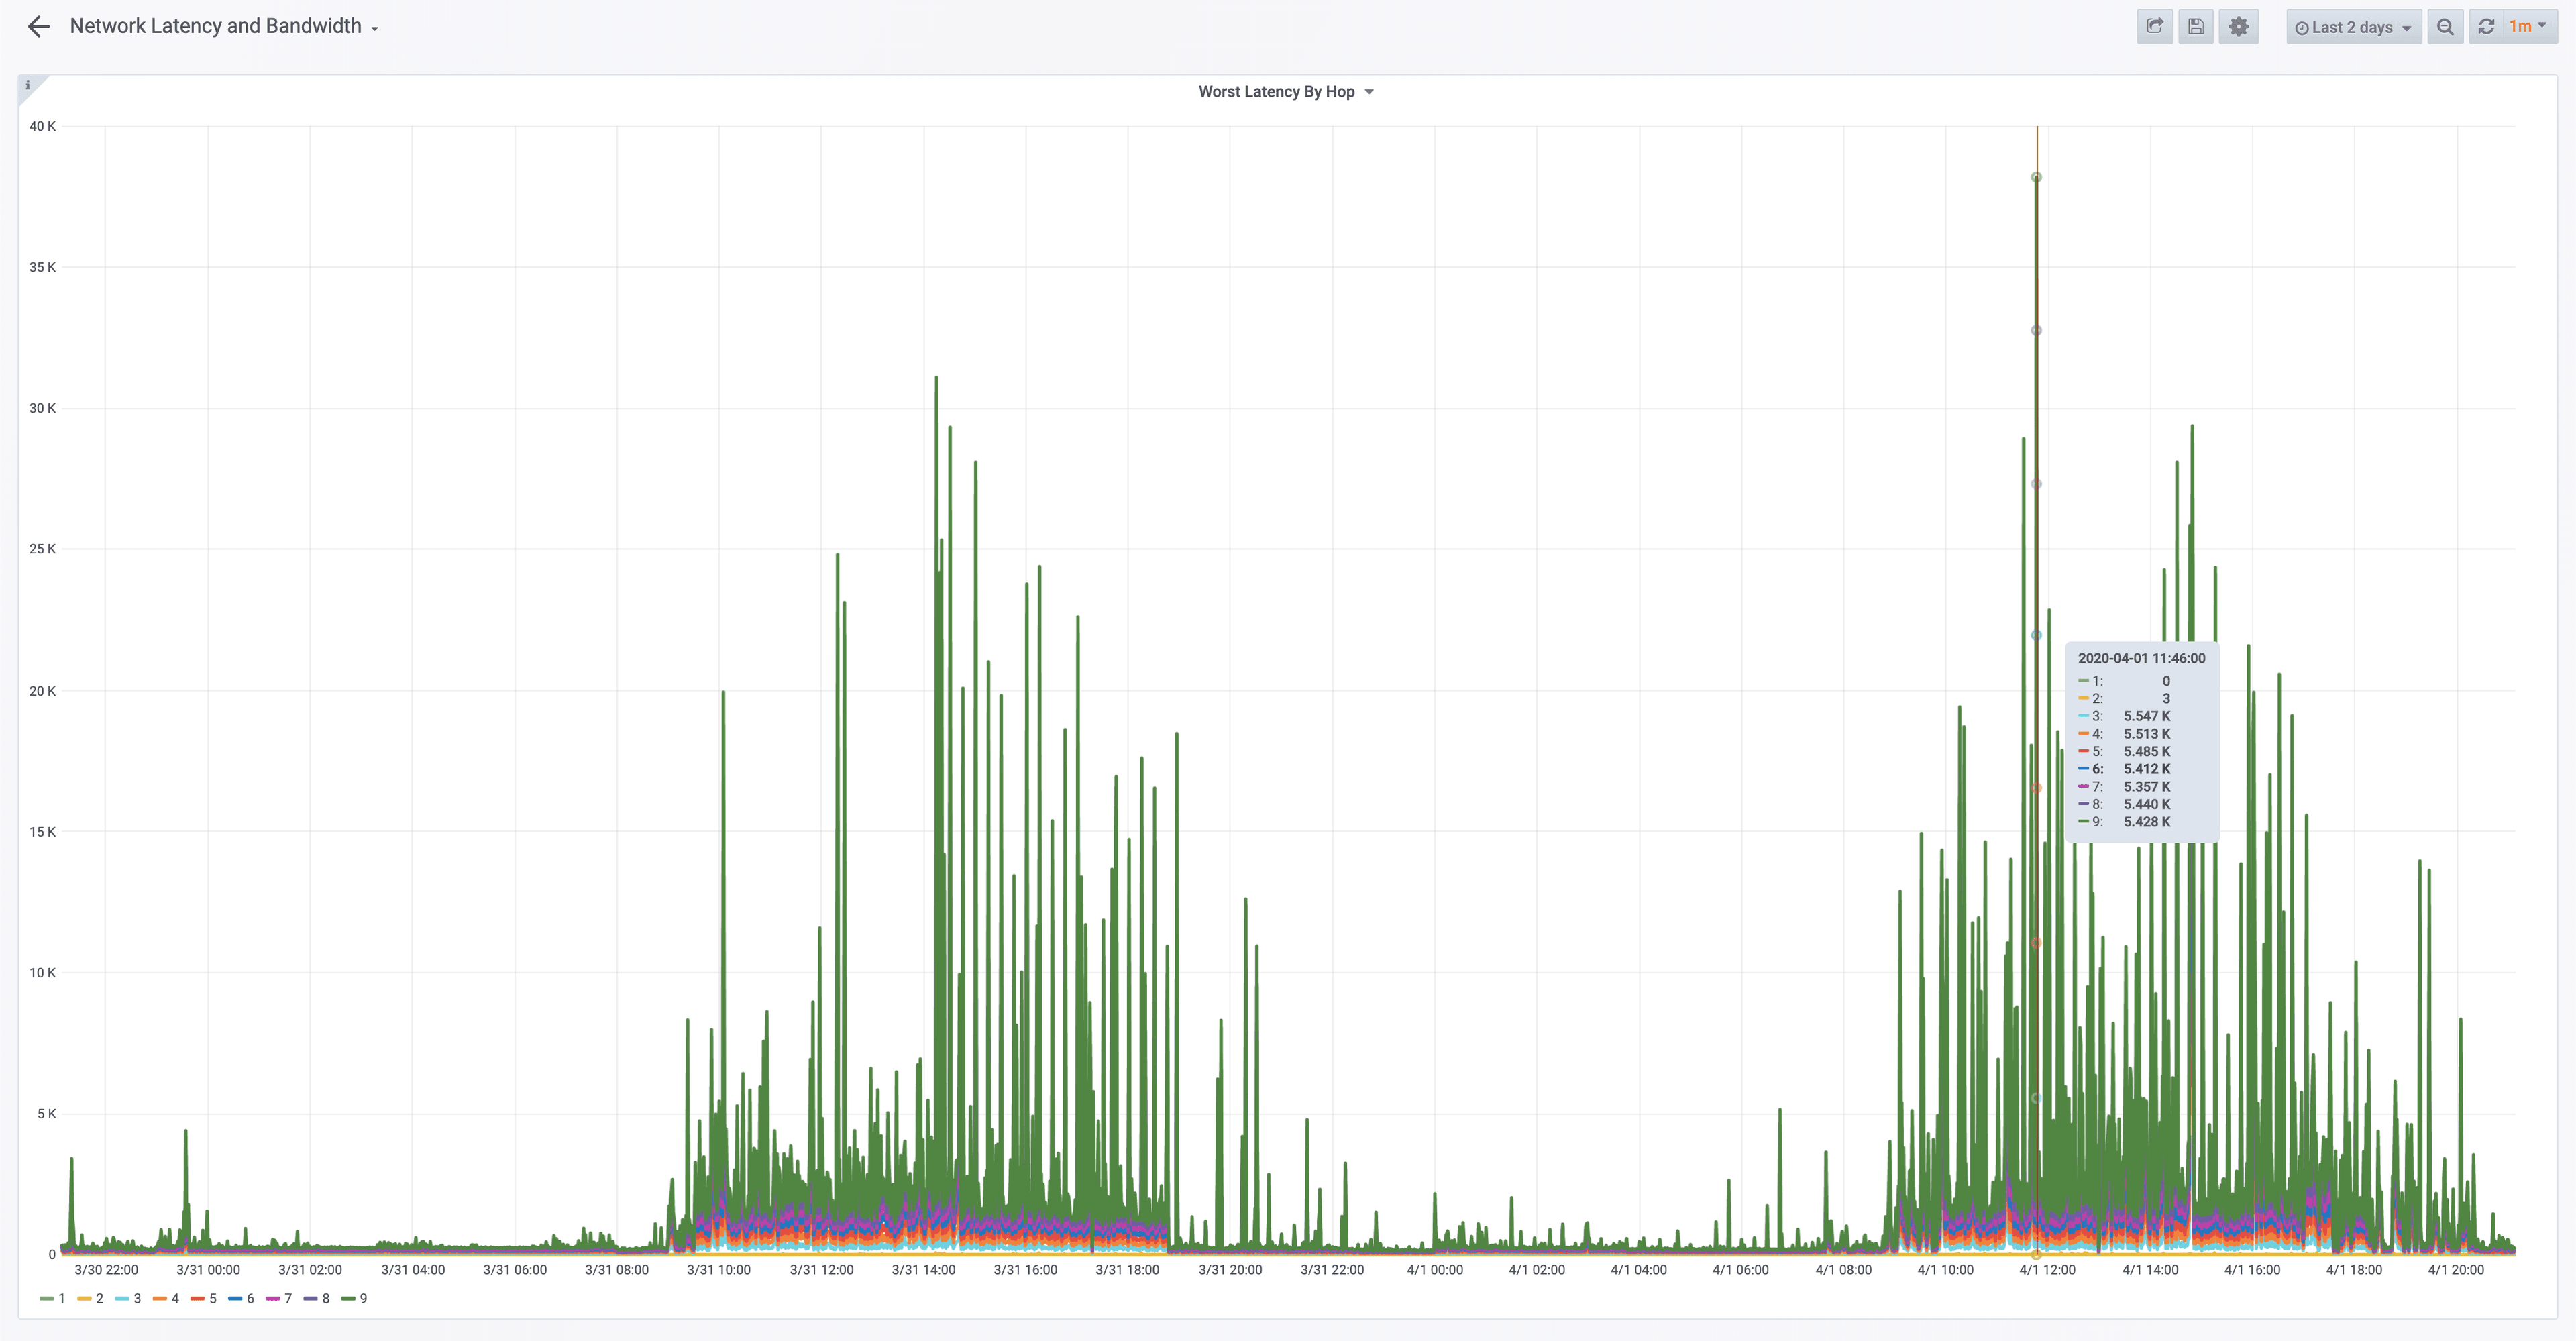
What I immediately wanted was the ability to trend this over time. Could I take the data from mtr and get it into an easy to consume time series of latencies by hop? TL;DR Yes! Cribl LogStream makes this trivially simple, and using mtr, Cribl LogStream, InfluxDB, and Grafana I was able to easily create the below dashboard, which you can see from my last 2 days shows incredibly high latencies.
If you want to get this dashboard in your environment, check out our Metrics Demo repo where you can run this on any machine that has Docker and Docker Compose. This environment runs a handful of containers, including a container running mtr to collect data, InfluxDB and Grafana to visualize it and of course Cribl LogStream to receive the mtr data, reshape it as a metric and forward on to InfluxDB. To learn how I used Cribl LogStream to easily took data from mtr, turned it into a metric in InfluxDB and visualized it with Grafana, read on!
Getting the Data
The first step in generating a dashboard of latency per hop over time is to gather the data. mtr worked great interactively, and I discovered it has JSON output available. Cribl LogStream supports receiving JSON documents over a simple TCP Port, so getting data from mtr into LogStream is a simple matter of taking the JSON output and using netcat to send it over to LogStream on our TCPJSON input. To get mtr to output JSON, I ran:
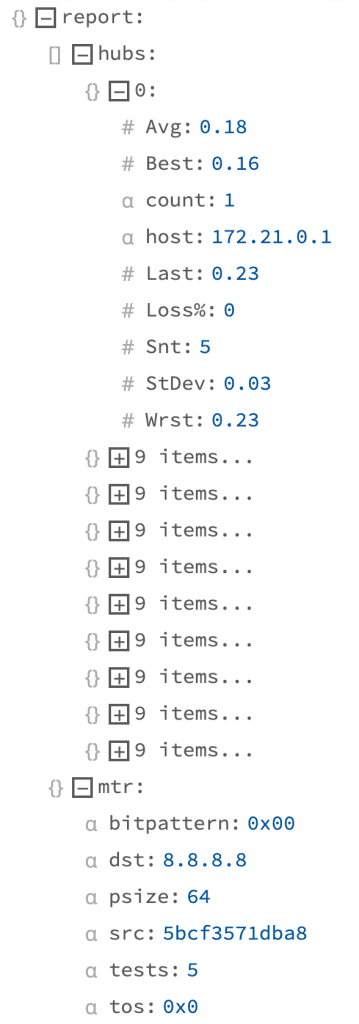
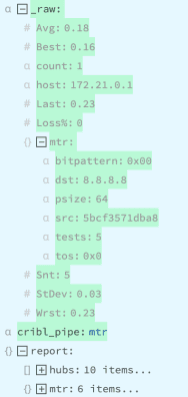
mtr --report -c 5 -i 1 --json --no-dns 8.8.8.8This tells mtr to output a report after running 5 pings for 1 interval in JSON format skipping DNS resolution. The data which is output looks like what we see at the right, as shown in the LogStream UI. This data structure contains exactly the data we need, but it’s not yet in the right shape to throw into a TSDB.
Next, we need to run mtr at a regular interval and get the data to LogStream. I built a simple Docker container, based on alpine, which runs mtr every 15 seconds, viacron. You can see this in the Dockerfile. Note, I create 4 entries because cron does not support sub-minute scheduling, so I instead schedule 4 tasks every minute and then have each sleep for an incrementing 15 seconds before starting. The cron job calls mtr.sh which runs mtr and then outputs the data to ${CRIBL_TCPJSON}, which in this environment is set via a .env file to cribl:10001, or hostname of cribl and port of 10001. Cribl LogStream has been configured to listen on port 10001 with a TCPJSON input which supports newline delimited JSON documents over TCP. Now that we’re getting the data in LogStream, we need to use LogStream to get the data in metrics format over to InfluxDB.
Reshaping the Data
In order to visualize this data in Grafana, we need to create a metric out of every row in the reports.hubs[] array. In LogStream, we call this Unroll, and we support it for JSON and XML. Unroll will take a row in a JSON document and create a new event with the value of that item, in our case, it’s an object so each object gets a field in the top level event. Anything at the top of the object also gets copied to this new event, so the mtr object also gets copied to each new event.
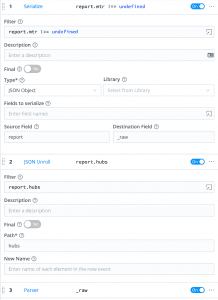
In LogStream 2.1, Unroll requires a JSON object in a text field, as parsing is built into the function (thusly JSON Unroll). As a workaround, we Serialize the report object to the _raw field and use JSON Unroll to explode that JSON serialized version of the event. In 2.2 and later, we’ll support Unroll operations on already parsed arrays in events. JSON Unroll will create a new event with _raw set to a JSON object with the contents of the array plus a copy of any top level fields from the array’s parent. After JSON Unroll our event looks like Image 1 below, which we then use Parse on to bring the JSON fields back into the event.
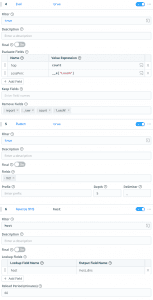
Next, we use Eval to rename count to hop as well as rename Loss%, which doesn’t work well as a JavaScript variable name, to loss_perc. We use Flatten to take the mtr object and turn each nested field and value into a top level field like mtr_field=value. Also, we use Reverse DNS to see if we can resolve the IP addresses from each hop.
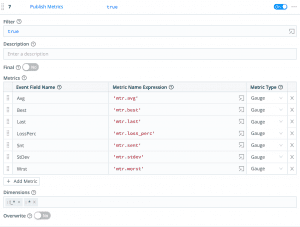
As of now, we’ve got a lot of different measurements in columns like Avg, Best, Last,LossPerc, and more, along with a rich set of dimensions like the mtr_dst, hop, and others. The event as we have it now is not yet a metric event, because we don’t know which of the values in the event are values and which are dimensions. We could use Aggregations to aggregate these values over a given tumbling window, but we have very few values only collected every few seconds, so for that use case we want to just put every value in the time series database (TSDB), or InfluxDB in our case. We use the Public Metrics function which will allow us to pick which of the fields in the event are values and keep the rest as dimensions.
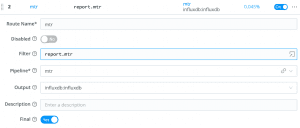
Lastly, we add a Route which matches any event which contains an object called report with a member called mtr and sends it down our Pipeline for processing mtr data.
Storing & Visualizing the Data
Now that we have the data converted to a metric ready to send to a TSDB, we need to select a TSDB and visualization engine. I’ve known the guys over at InfluxDB for years, since my days at Splunk, and I think they made a really killer time series database. There’s a publicly available Docker image which makes it easy to run in my home lab. Grafana also makes a really easy to use dashboarding engine which sits on top of a number of time series databases, including InfluxDB. Cribl LogStream supports outputting to InfluxDB, so in this demo environment we’re outputting to InfluxDB to store the data and we’re shipping a dashboard provisioned in Grafana to visualize it. If you log into Grafana in the demo environment (instructions in the README), you should see a dashboard like below. I had a few of my colleagues run it, and you can see the numbers vary pretty heavily.
My Home Internet Performance
My current performance is not particularly great. What I’ve seen from the last couple of days worth of data is that latency is definitely in the neighborhood. The first two hops are regularly <5ms to leave my house, and the latency to the first hop varies from a few milliseconds overnight to the hundreds of milliseconds or perhaps even seconds during the day. Whatever layer 2.5 or layer 2 hops are in that hop, it could be many, but it points to something relatively local to me. I have historically seen no more than about 20ms to get to 8.8.8.8, but now I’m seeing hundreds. Here’s hoping my provider can up my local capacity!
Wrapping Up
I’ve been using this dashboard daily. My internet performance is quite poor at the moment, but I’m sure my internet provider is doing the best they can to deal with this massive surge in consumption. My thoughts are with the ops folks, network engineers, and support personnel who are dealing with such massive swings in traffic over the last few weeks. Nobody could have prepared for an event like this, and even with the performance problems I’ve been seeing I must commend our infrastructure providers for keeping us all up and running with reasonable service in such a trying time.
Again, if you’d like to get this dashboard in your environment, it’s as simple as cloning the Metrics Demo repo and running docker-compose up -d. This use case is a superb example of how Cribl LogStream can take arbitrary data, structured or not, and reshape it to be used for just about any monitoring or analytics use case. We deal with data in any format we find it and allow you to connect from even the most legacy systems to any observability or security tool you might want to send the data to. If you find yourself with these kinds of data transformation and enrichment challenges, please drop us a note at hello@cribl.io or join our Cribl Community Slack!
Cribl, the Data Engine for IT and Security, empowers organizations to transform their data strategy. Customers use Cribl’s suite of products to collect, process, route, and analyze all IT and security data, delivering the flexibility, choice, and control required to adapt to their ever-changing needs.
We offer free training, certifications, and a generous free usage plan across our products. Our community Slack features Cribl engineers, partners, and customers who can answer your questions as you get started. We also offer a hands-on Sandbox for those interested in how companies globally leverage our products for their data challenges.