
As a fan of OpenTelemetry, I love to see Cribl meeting customers where they are and helping them get to where they want to be with a vendor-agnostic approach. Where it is not possible or practical to re-instrument a telemetry source, whether an application or infrastructure, the barrier to adopting OpenTelemetry Signals can be daunting. The launch of the OTLP Metrics Function in Cribl 4.5 allows customers to take Prometheus metrics and translate them into the OTLP Metric format without modifying the telemetry source. And, when you need to send OpenTelemetry Signals into an agnostic message bus, use the Cribl Stream Kafka Destination to deliver OLTP-formatted telemetry serialized via Protobuf.
Being a fan of OpenTelemetry (OK, I’m an OpenTelemetry nerd!) and the Product Manager for Observability at Cribl, I talk to a lot of people about observability and OpenTelemetry. Whether prospective customers or current customers, I’ve observed some themes that I want to share with everyone. Some of these are lessons I learned, some are lessons I taught, and others are just worth mentioning so that we can all talk about observability and OpenTelemetry from a shared understanding.

Lesson 1 – Observability does not require OpenTelemetry
The most frequent question I field from customers and prospective customers alike about observability is the perceived dependency on OpenTelemetry. Cribl is a vendor-agnostic product suite to source, process, route, store, and analyze billions of events per second. As the data engine for IT and security, our customers and the Cribl Curious want to know about OpenTelemetry and the questions I hear follow a predictable pattern exposing a fundamental misunderstanding about the purpose of OpenTelemetry as an observability strategy. The conversation usually goes something like this:
Product Manager: “What does observability mean to you and your organization?”
O11y Observants: “We need to have OTLP Logs, Metrics, and Traces.”
PM: “Do you plan to use trace and span ID propagation to link logs and metrics to application traces?”
OO: “Yes!”
PM: “Fantastic, that is the key purpose for the OpenTelemetry semantics and standards.
Have you instrumented your applications to emit logs, metrics, and traces in OTLP format?
OO: <awkward silence>
OpenTelemetry (properly abbreviated as OTel) is primarily an application-centric approach to how data is structured as logs, metrics, traces, events, and resources. Standards are fantastic for data structures, transport mechanisms, and other key elements of interoperability. Ethernet, IP, NTP, and other standards are the unsung heroes of the internet age. The OpenTelemetry Signals are having a similar impact on observability, defining immutable standards for the format, content, and transportation of logs, metrics, traces, and the associated signals.
However, adopting OpenTelemetry is not a requirement in an observability strategy. If you can instrument an application to emit OpenTelemetry Traces, Metrics, and Logs, then adopting OpenTelemetry data standards as the preferred strategy makes sense. Without an application-first approach, OpenTelemetry can still provide a standardized data framework, especially if context propagation between metrics and logs is required. With OpenTelemetry, this concept is called a Resource and represents the entity, be it a server, host, pod, etc, that is generating the telemetry. These Resource Detectors are often the elements managed and maintained by IT and operations teams.
Adopting OpenTelemetry is a strong move towards a vendor-agnostic strategy for observability. However, it is not a perfect solution, or even the only solution, to build an observability strategy, especially if application tracing is not part of the equation. Logs and metrics power observability strategies for IT and Security teams with similar outcomes as tracing and metrics for application engineers.
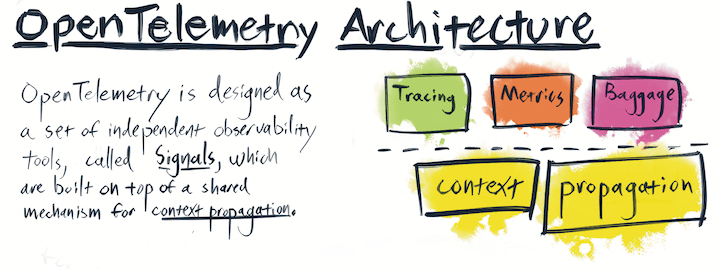
Snippet from https://opentelemetry.io/docs/specs/otel/overview/#opentelemetry-client-architecture
Lesson 2 – OpenTelemetry does not require the OpenTelemetry Collector
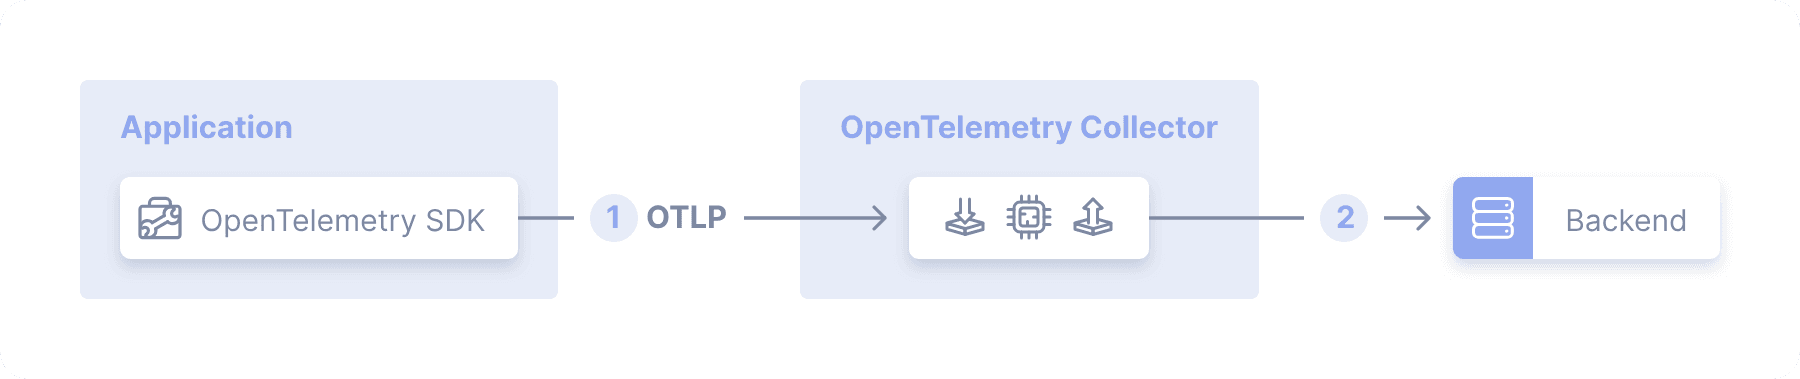
As OpenTelemetry is primarily designed by and for an application-centric approach to telemetry, it makes perfect sense that the OpenTelemetry Collector is also very application developer/ DevOps/SRE-centric too. The Collector (abbreviated OTelCol) runs in two modes – as daemon alongside the application and as a Collector.
According to the OpenTelemetry Collector page, the collector “offers a vendor-agnostic implementation of how to receive, process and export telemetry data.” When a vendor wants to deploy their own version of the collector, it is still the OpenTelemetry Signals (logs, metrics, traces, etc.) that are vendor agnostic.
Cribl supports the ingress, processing, and egress of OpenTelemetry Signals (logs, metrics, and traces) even though it is not a deployment of the OpenTelemetry Collector. Where the OTelCol can be deployed in Agent Mode, uses Cribl Edge to collect OpenTelemetry signals, system metrics, and even system state too.
Agent Mode
From https://opentelemetry.io/docs/collector/deployment/agent/
Use Cribl Stream when centralized, petabyte-scale data processing is required. Stream Worker Nodes allow for horizontal scaling in a Worker Group with additional nodes and scaling vertically via Worker Processes by simply adding CPU capacity.
A Worker Group is similar to deploying the OpenTelemetry Collector in Gateway Mode using multiple instances of the OpenTelemetry Collector and the underlying OS. Where the OTelCol must be discreetly deployed and managed, a Stream Worker Group shares a managed configuration across all Workers and Worker Processes.
Gateway Mode
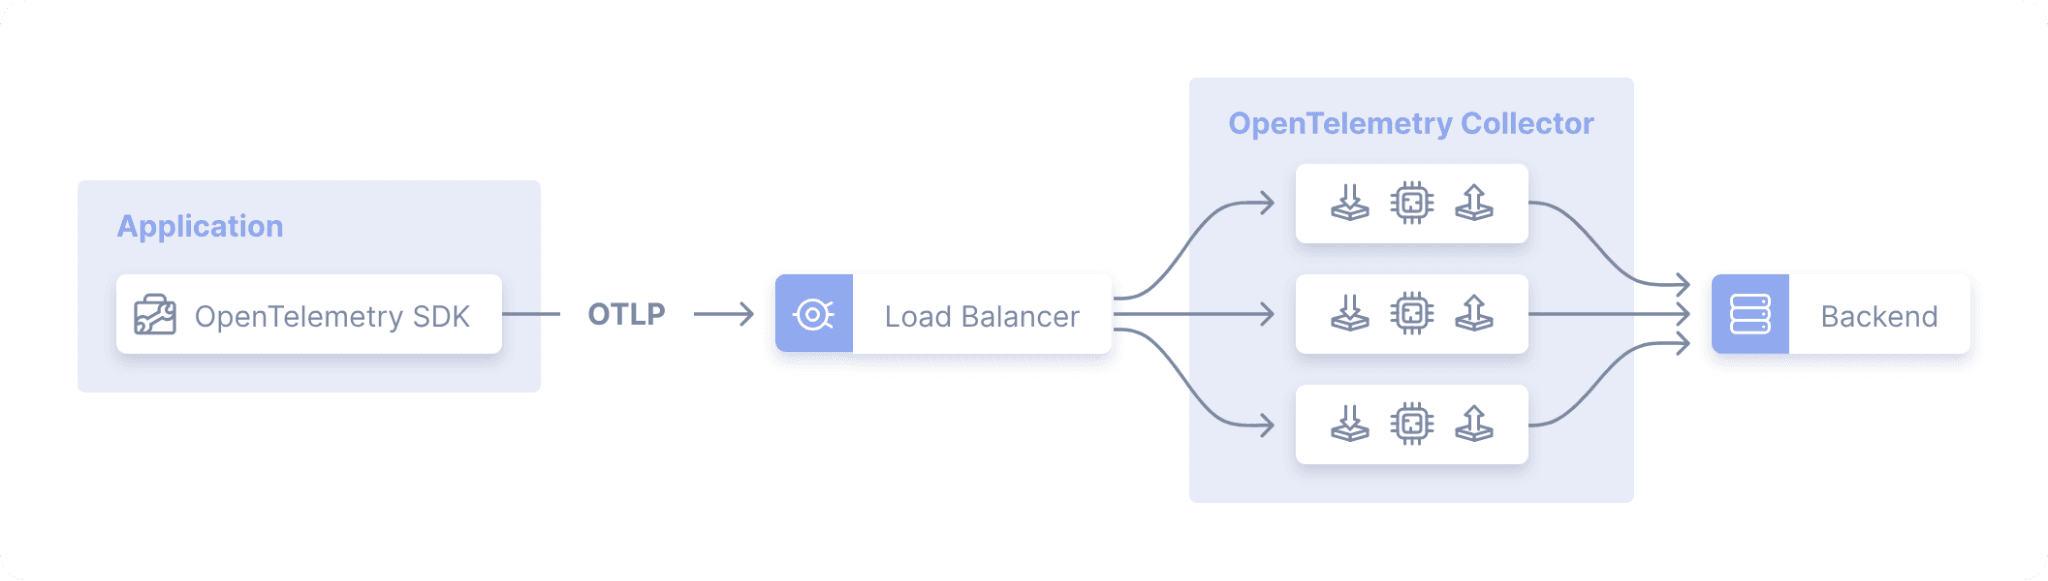
From https://opentelemetry.io/docs/collector/deployment/gateway/
Whether sending OpenTelemetry Signals directly from an instrumented application or forwarding them via OpenTelemetry Collector, Cribl puts your IT and Security data at the center of your data management strategy and provides a one-stop shop for analyzing, collecting, processing, and routing it all at any scale.
Lesson 3 – Observability is an outcome, not a feature
I start most of my introductions about my role as the Product Manager, Observability by joking that I am a PM without a product. I say that because you cannot buy observability and, as I quote in my blog Observability for Everyone, “Anyone who says differently is selling something.” Observability is about building a culture of well-instrumented technology, tools and mechanisms to acquire, process, store, visualize, and act on that data, and provide access to the data needed to ask and answer complex questions about business systems.
When a prospective customer starts a question with “Can you…?” followed by a technical explanation about their environment, it signals that they are struggling with one of those mechanisms essential to observability – telemetry acquisition, processing, storage, visualization, action (aka alerting/notification), and/or access. Achieving observability is rarely as simple as solving for a singular telemetry problem, it is about building repeatable patterns that meet current needs and mitigate future risks for accessing telemetry.
More and more Cribl customers are making the decision to expand the adoption of Cribl products – Edge, Stream, Search, and the recently announced, Lake – as the foundational architecture for powering their cultures of observability. Interoperability with Cloud, hardware, application, and other critical components allows those customers to focus on how to power their observability goals with data rather than revisiting data mechanisms for every business decision.
Summary
Nearly 10 years ago, Torkel Ödegaard, the creator of Grafana and co-founder of Grafana Labs, wrote about the genesis of the phrase “Democratize Metrics”, a phrase that has had a profound impact on the way I thought about monitoring and, now, observability. OpenTelemetry has helped advance idea that Torkel and Raj Dutt, CEO and co-founder of Grafana Labs, proposed in the decade since their vision emerged, expanding on the idea to be inclusive of logs and traces too.
When data is well known, well structured, and accessible to the right people, in the right place, at the right time, that is a culture of observability. Observability is enabled by logs, metrics, and traces, and powered by the people your organization has entrusted with the availability, performance, and security of your systems.