
Organizations leverage many different cybersecurity and observability tools for different departments. It’s common to see the IT department using Splunk Enterprise, while the SOC uses Exabeam. These tools use separate agents, each feeding different data to their destinations. Normally, this isn’t a problem unless you’re talking about domain controllers. Domain controllers only allow a single agent, meaning you can’t feed two platforms with data. How do you get around this limitation and send security logs to Exabeam while still sending the right data to Splunk? In this scenario we’ll explore below, a customer has Splunk Universal Forwarders (UFs) installed on the Domain Controllers, sending classic event logs to Exabeam. These classic logs embed new lines and special characters, and these break Exabeam’s parser. We need to remove them before delivering them to Exabeam. Luckily, this is where Cribl Stream comes in. With Stream, we can ingest directly from Splunk UF running on the domain controller and transform the events before routing them to Exabeam. Let’s get started with Parser Validating with Exabeam and Cribl Stream.
Step 1: Capturing Logs
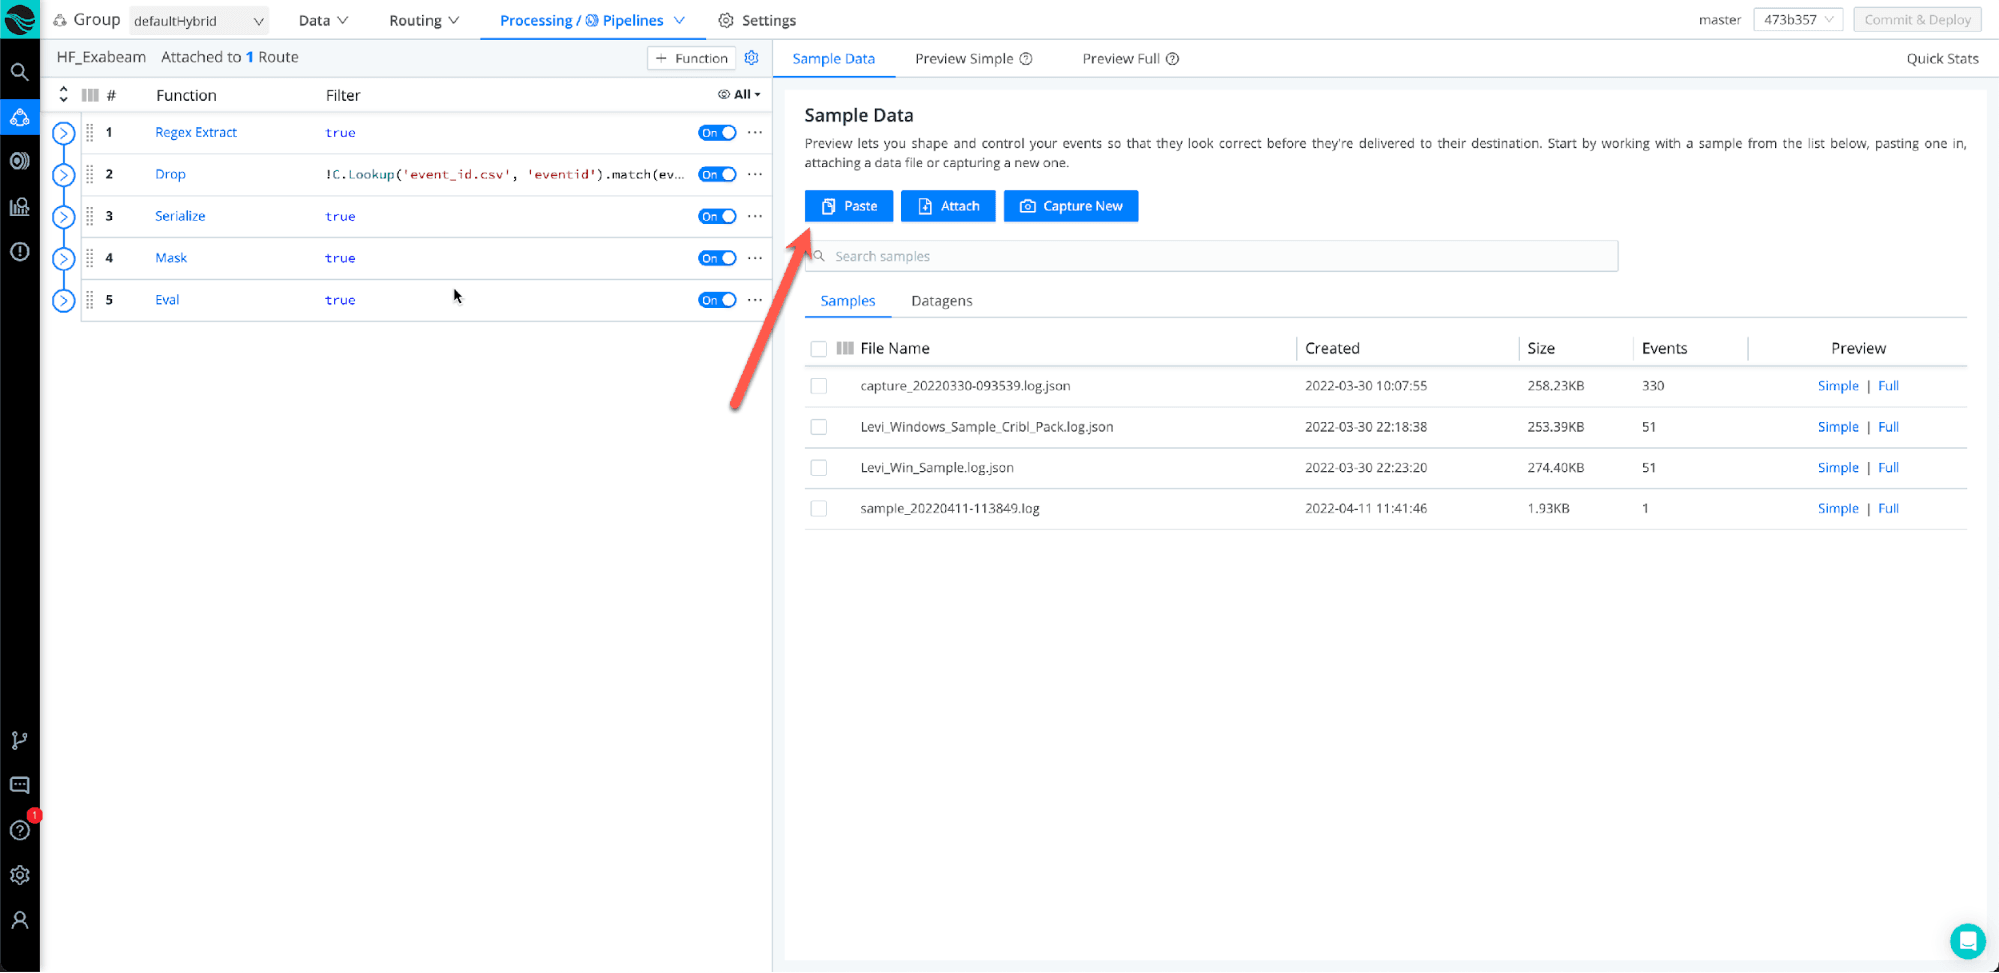
You can capture your logs in many ways:
Capture off the wire as data is coming in
If you have a copy of the logs, you can attach the file to the modal
Lastly, you can copy and paste the event straight into Cribl Stream (Method 3 is being used)
Step 2: Save Sample File
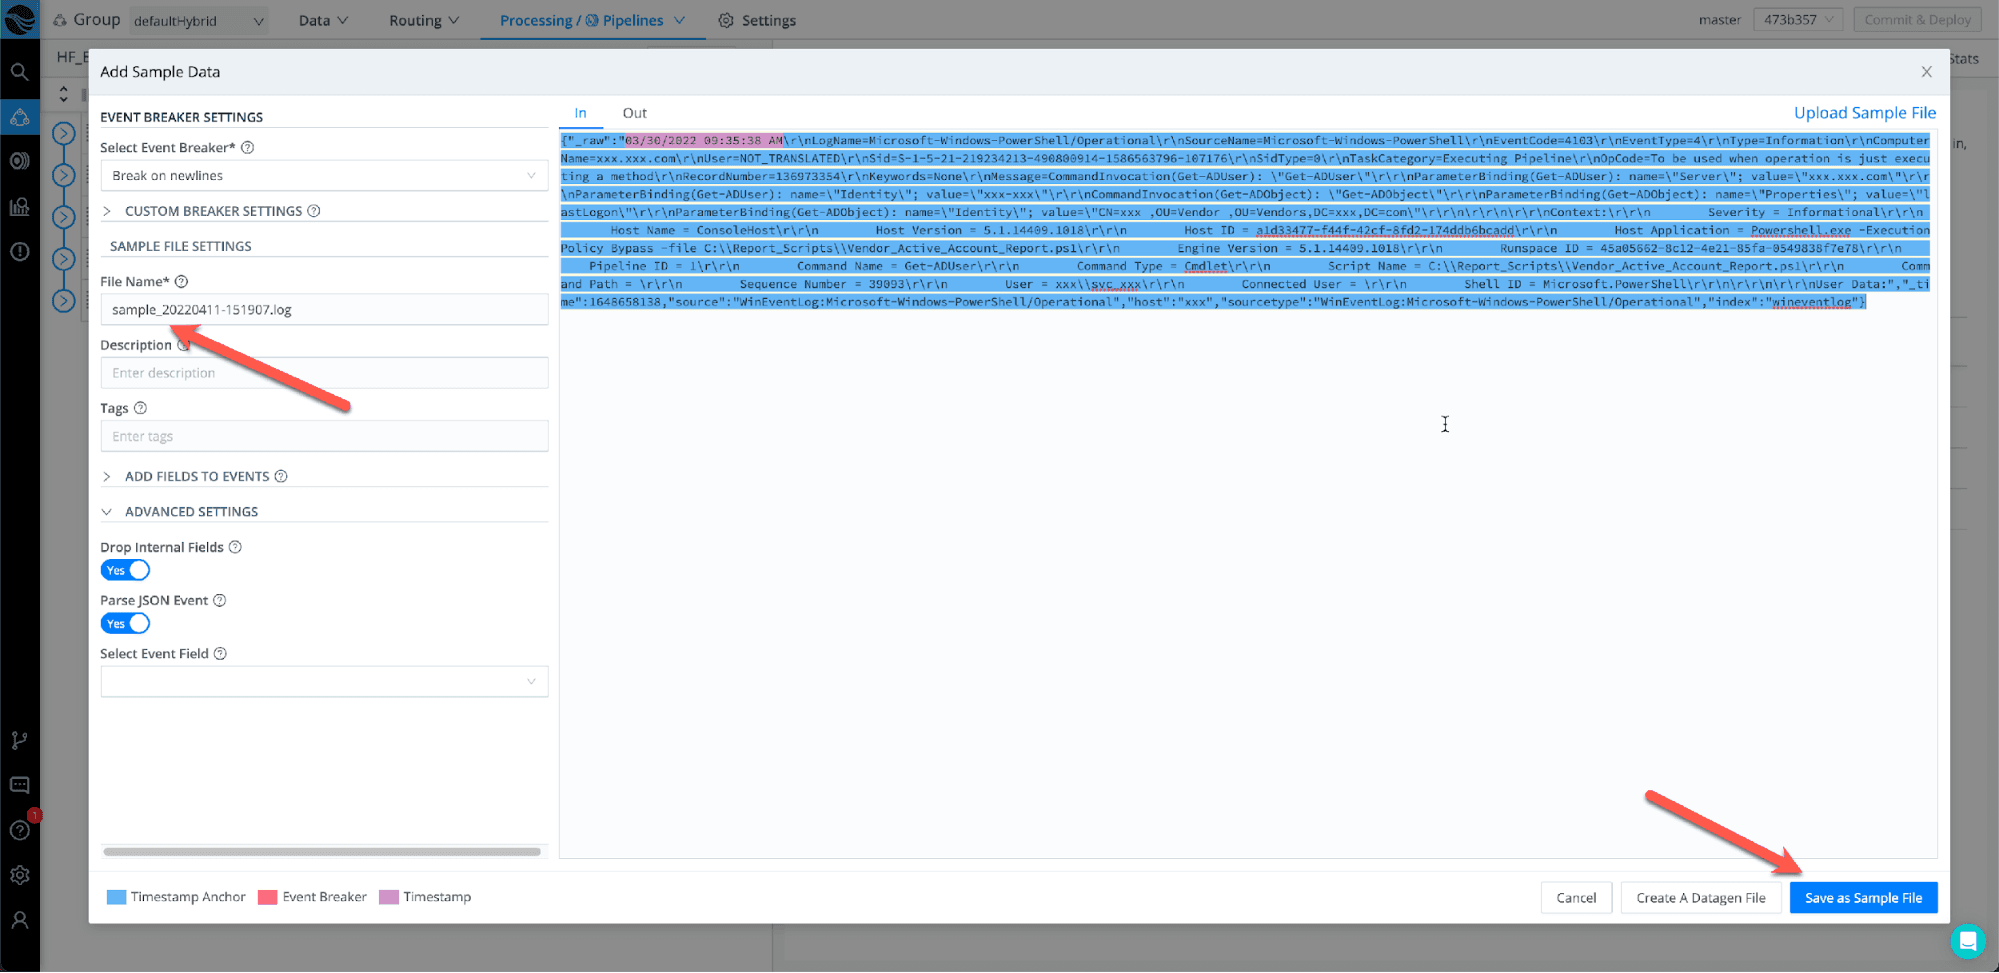
Once you have pasted the log sample you would like to transform, make sure to give it a unique file name and select “Save as Sample”
Step 3: Reformatting Logs
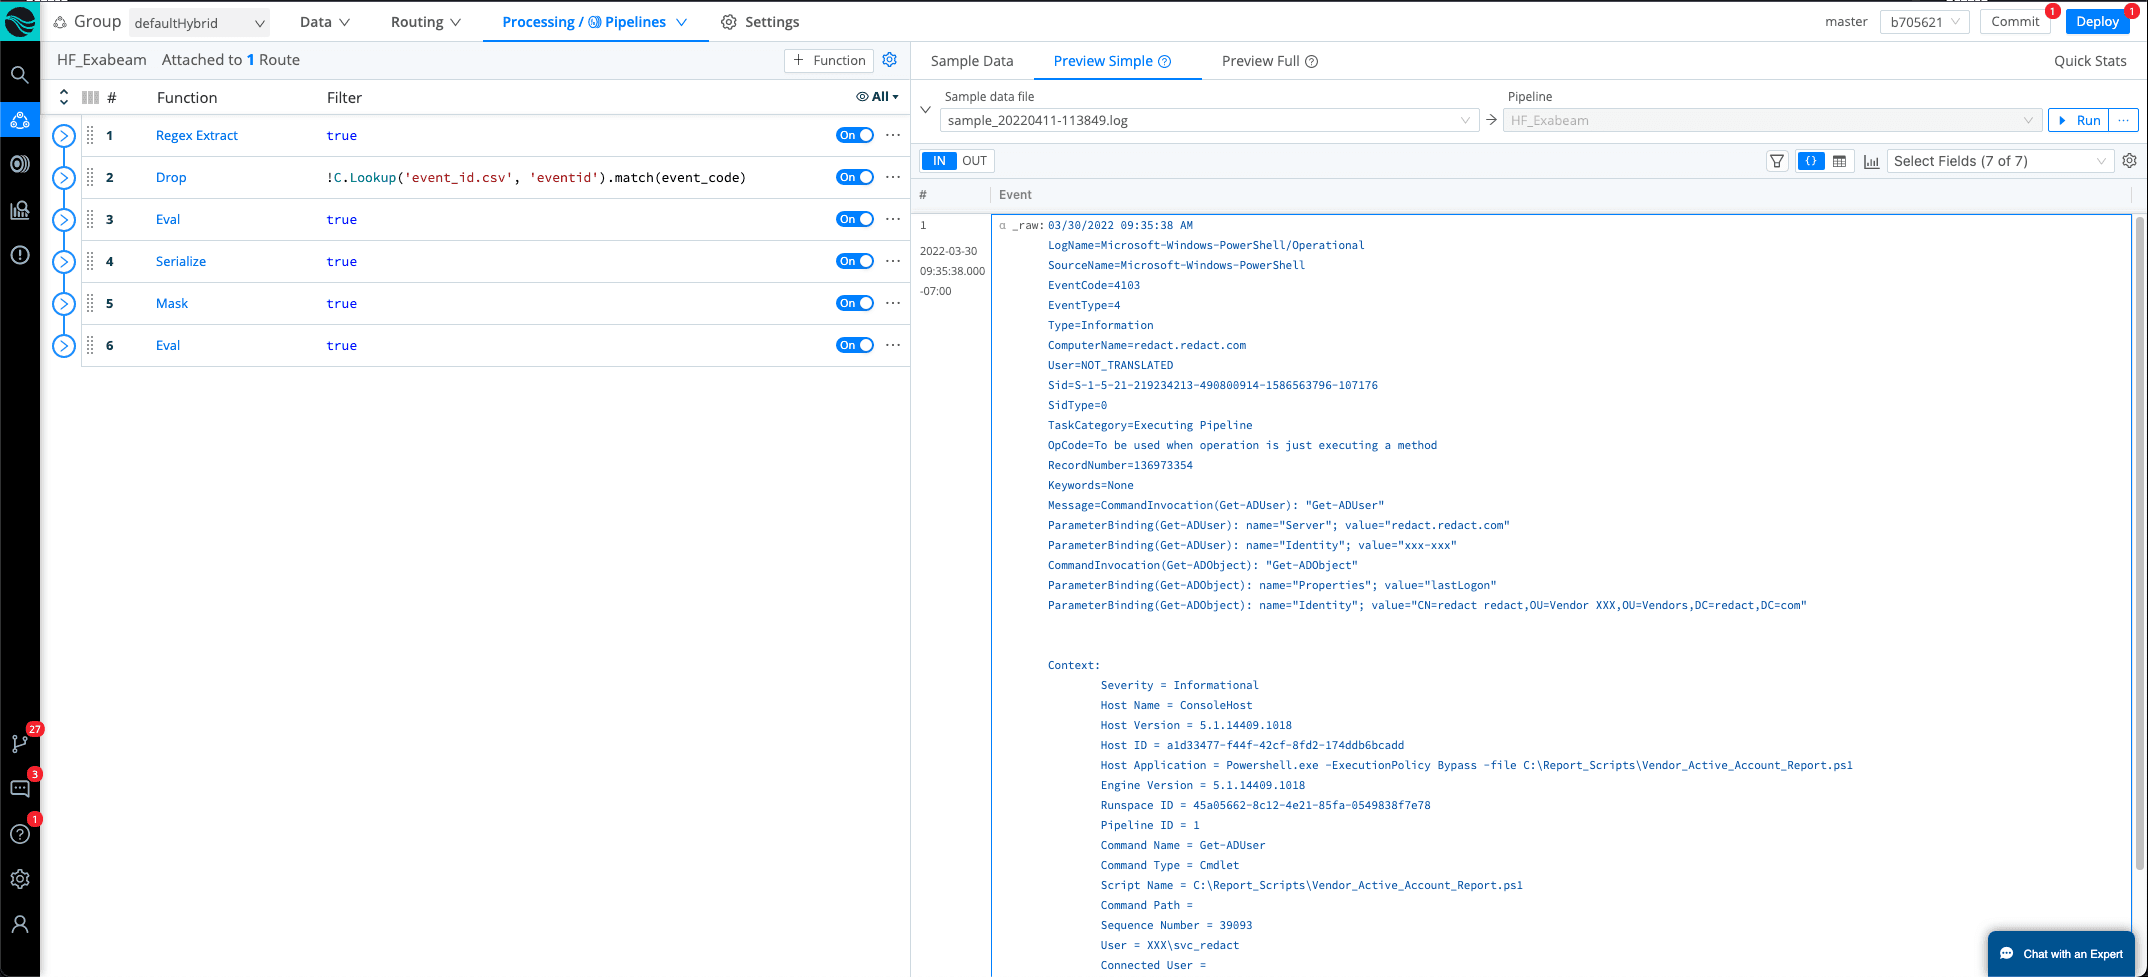
Now that the sample is saved, we can start working on changing the format of the event. Windows classic view has a lot of new lines and spaces that we will need to remove. Exabeam will treat each new line as an event, so we need to make sure we remove the new lines.
Step 4: Putting Data In a JSON Format
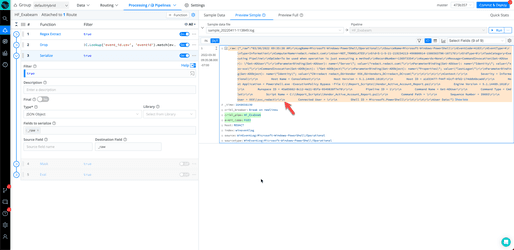
We started off by using the SERIALIZE function. Serialize helps to remove all of the new lines and spaces and put the data into a JSON format. Now the only issue with this view is we have a lot of \n and \r. This will be an issue for Exabeam because we need to make sure we remove these characters, or the regex will not match the fields that need to be extracted.
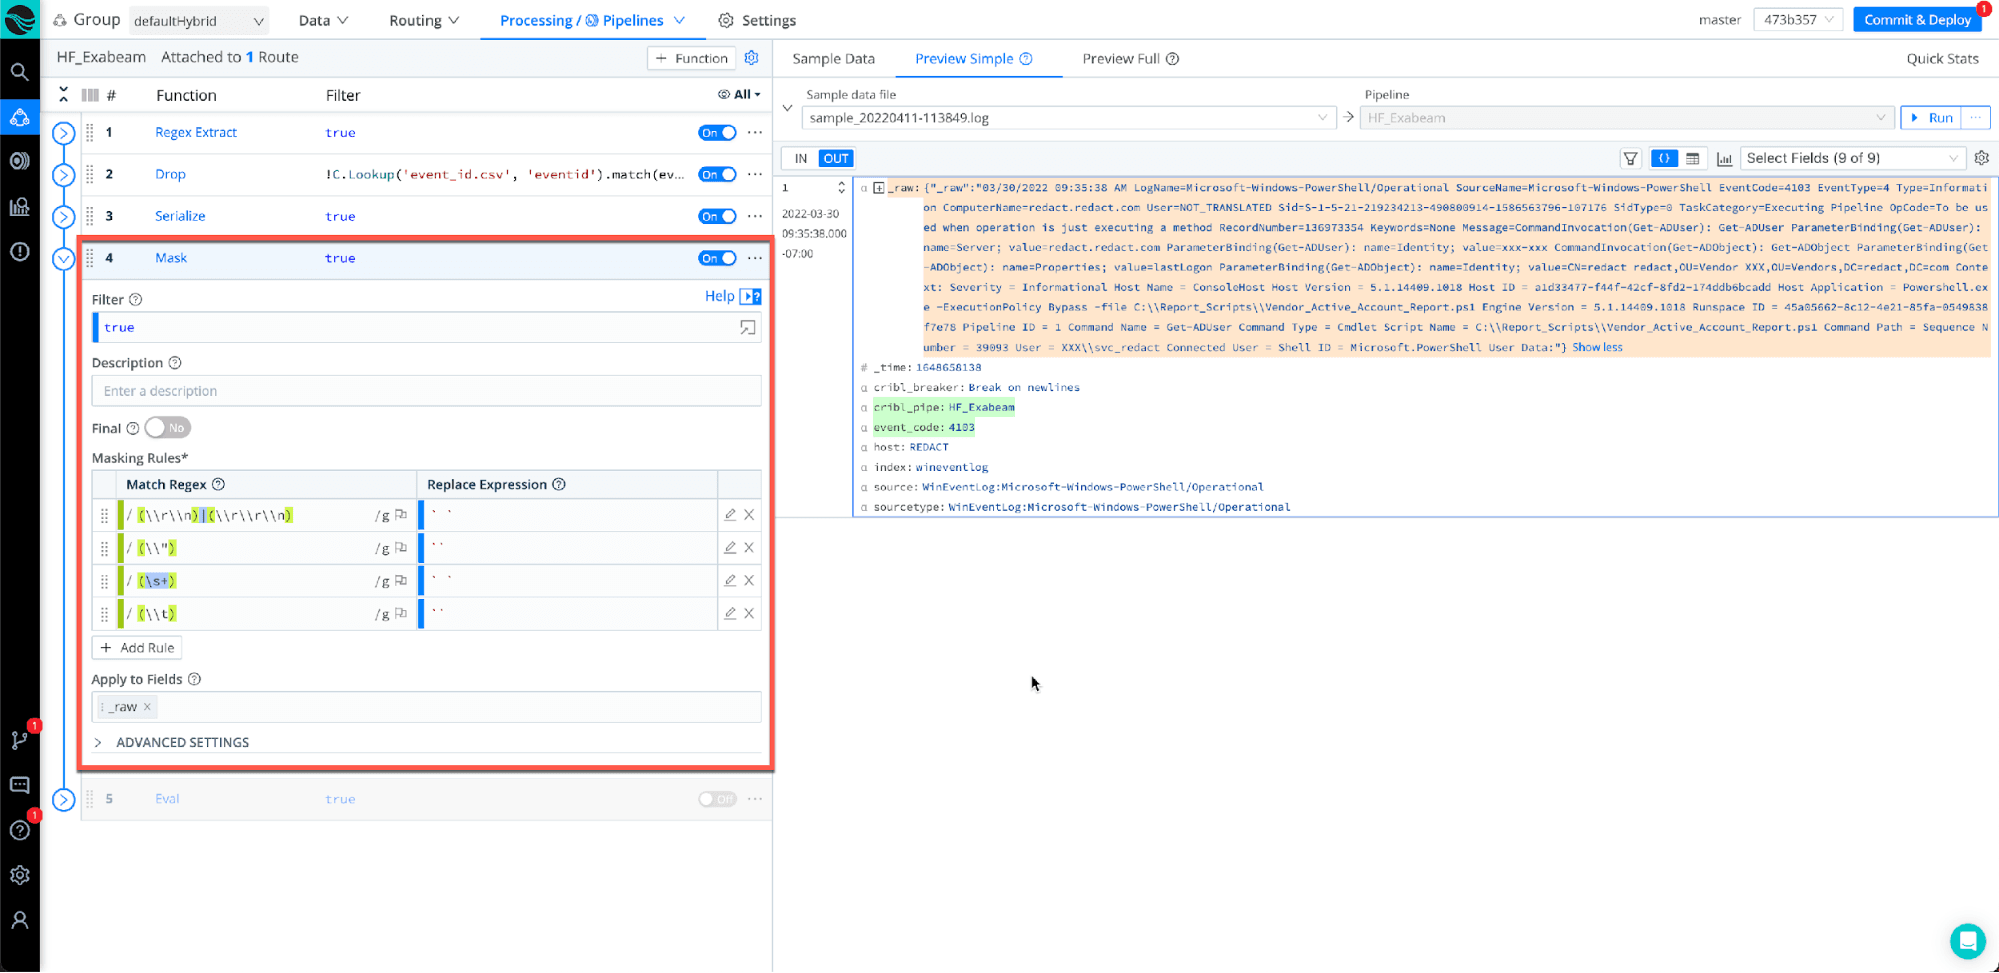
Step 5: The Masking Function
The Mask function covers a variety of use cases, but in this example, masking is used to remove the special characters and replace them with space.
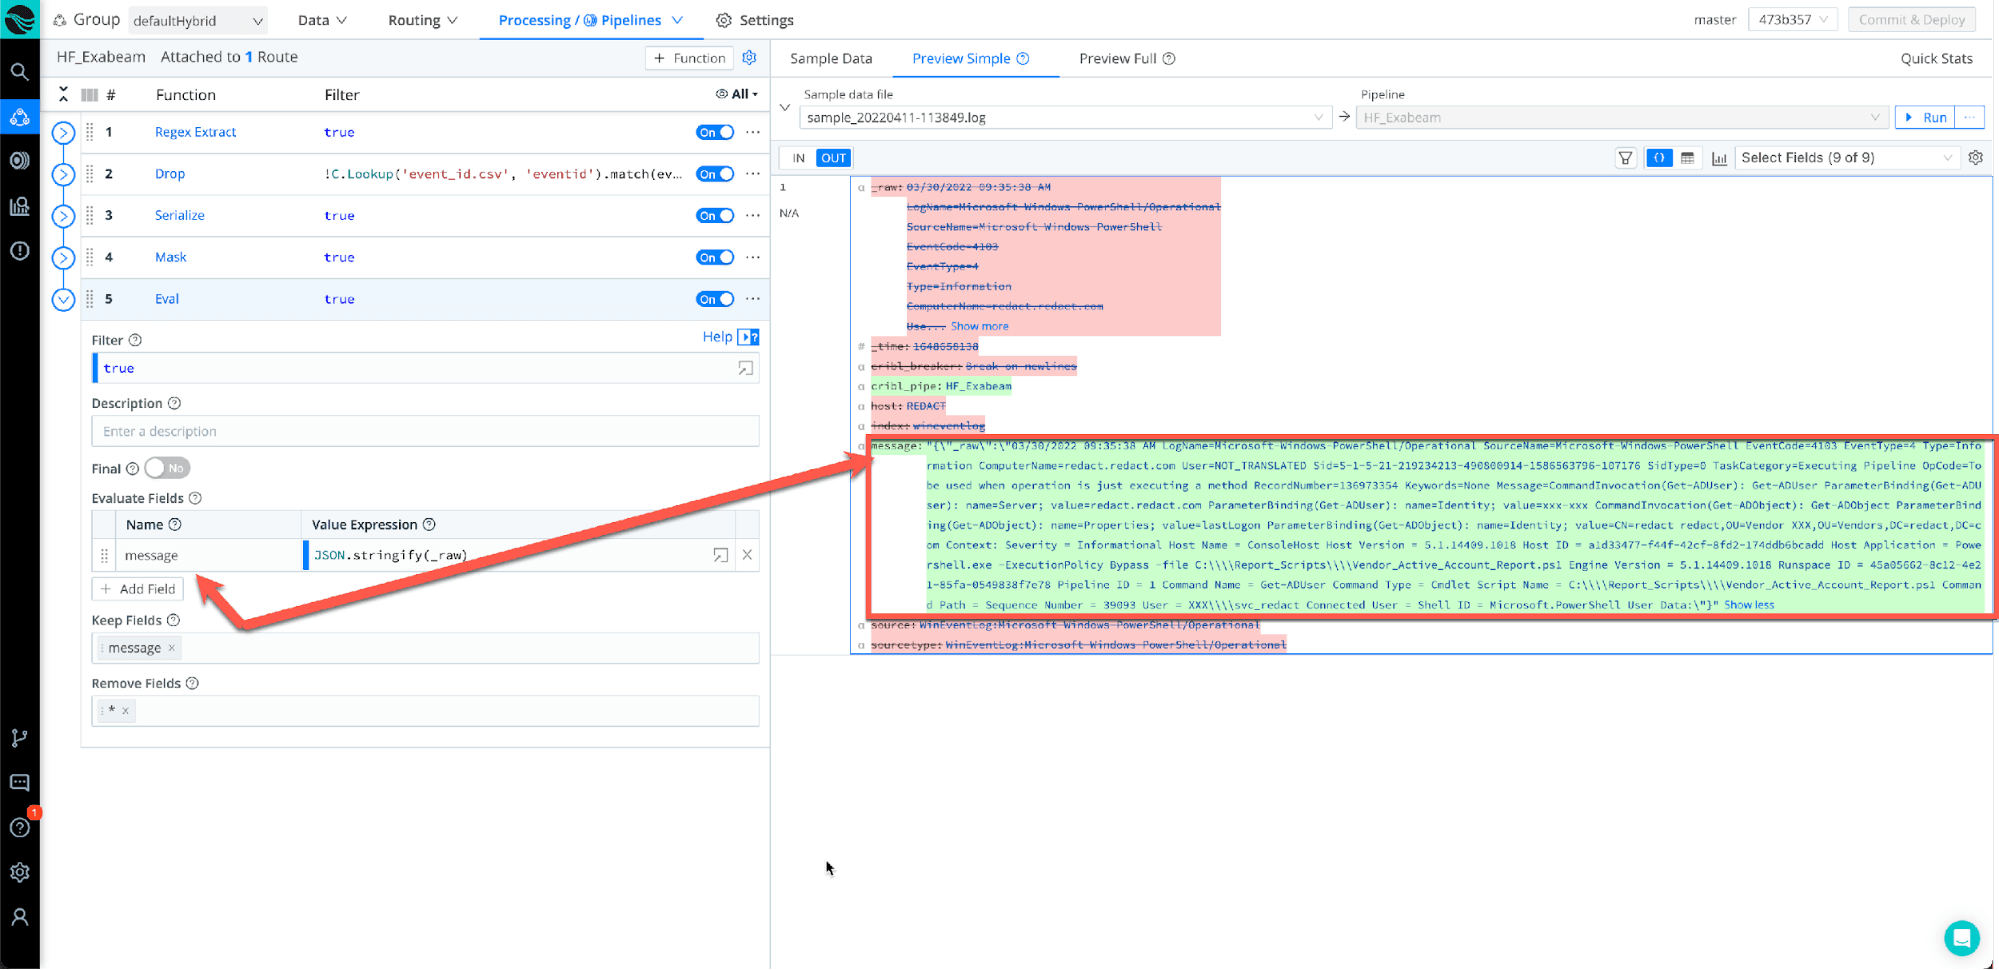
Step 6: The EVAL function
For the last step for the pipeline, we will use the EVAL function. We will use eval to create a new field called message and remove everything else under the (Remove Fields), but only keep the message field.
(Note: The message field is what populates the raw message in Data Lake)
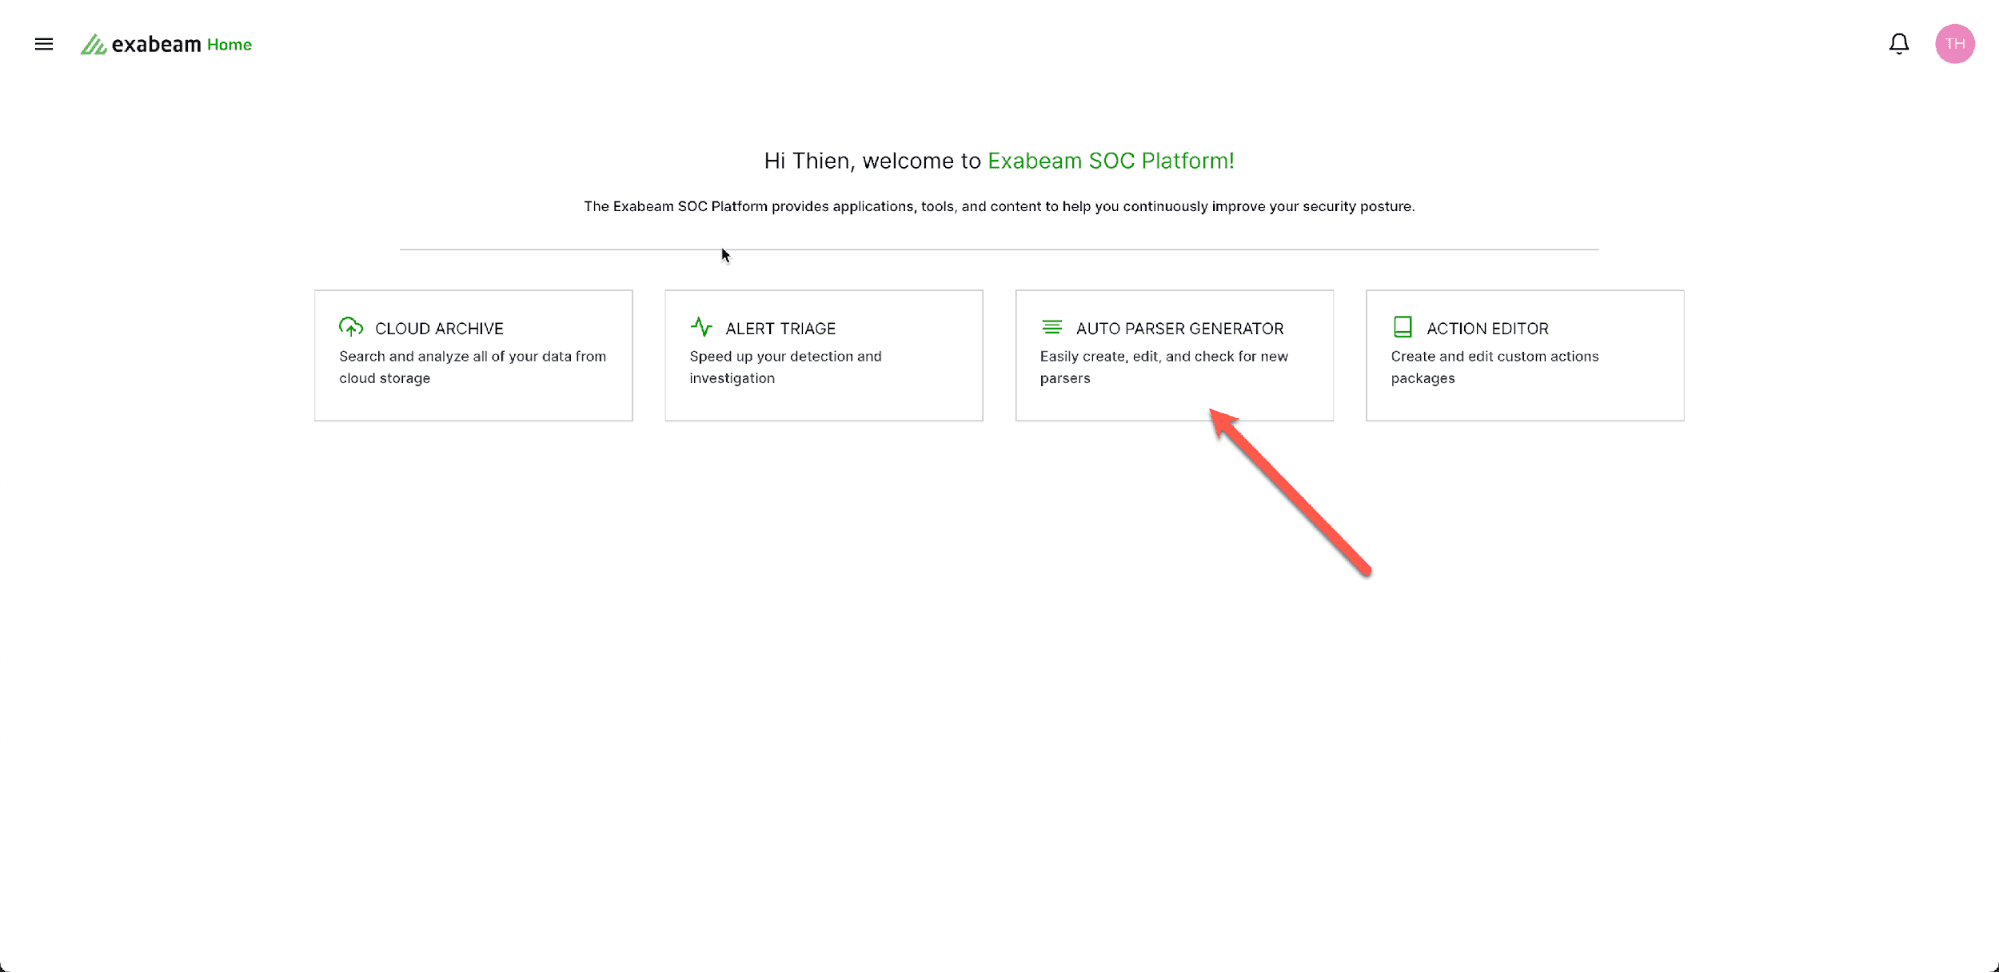
Step 7: Auto Parser Generator
Let’s get started with testing. Every Exabeam customer should have access to Auto Parser Generator if you do not, please reach out to your local Exabeam community and request access. The APG tool will validate if you match any parsers based on your event.
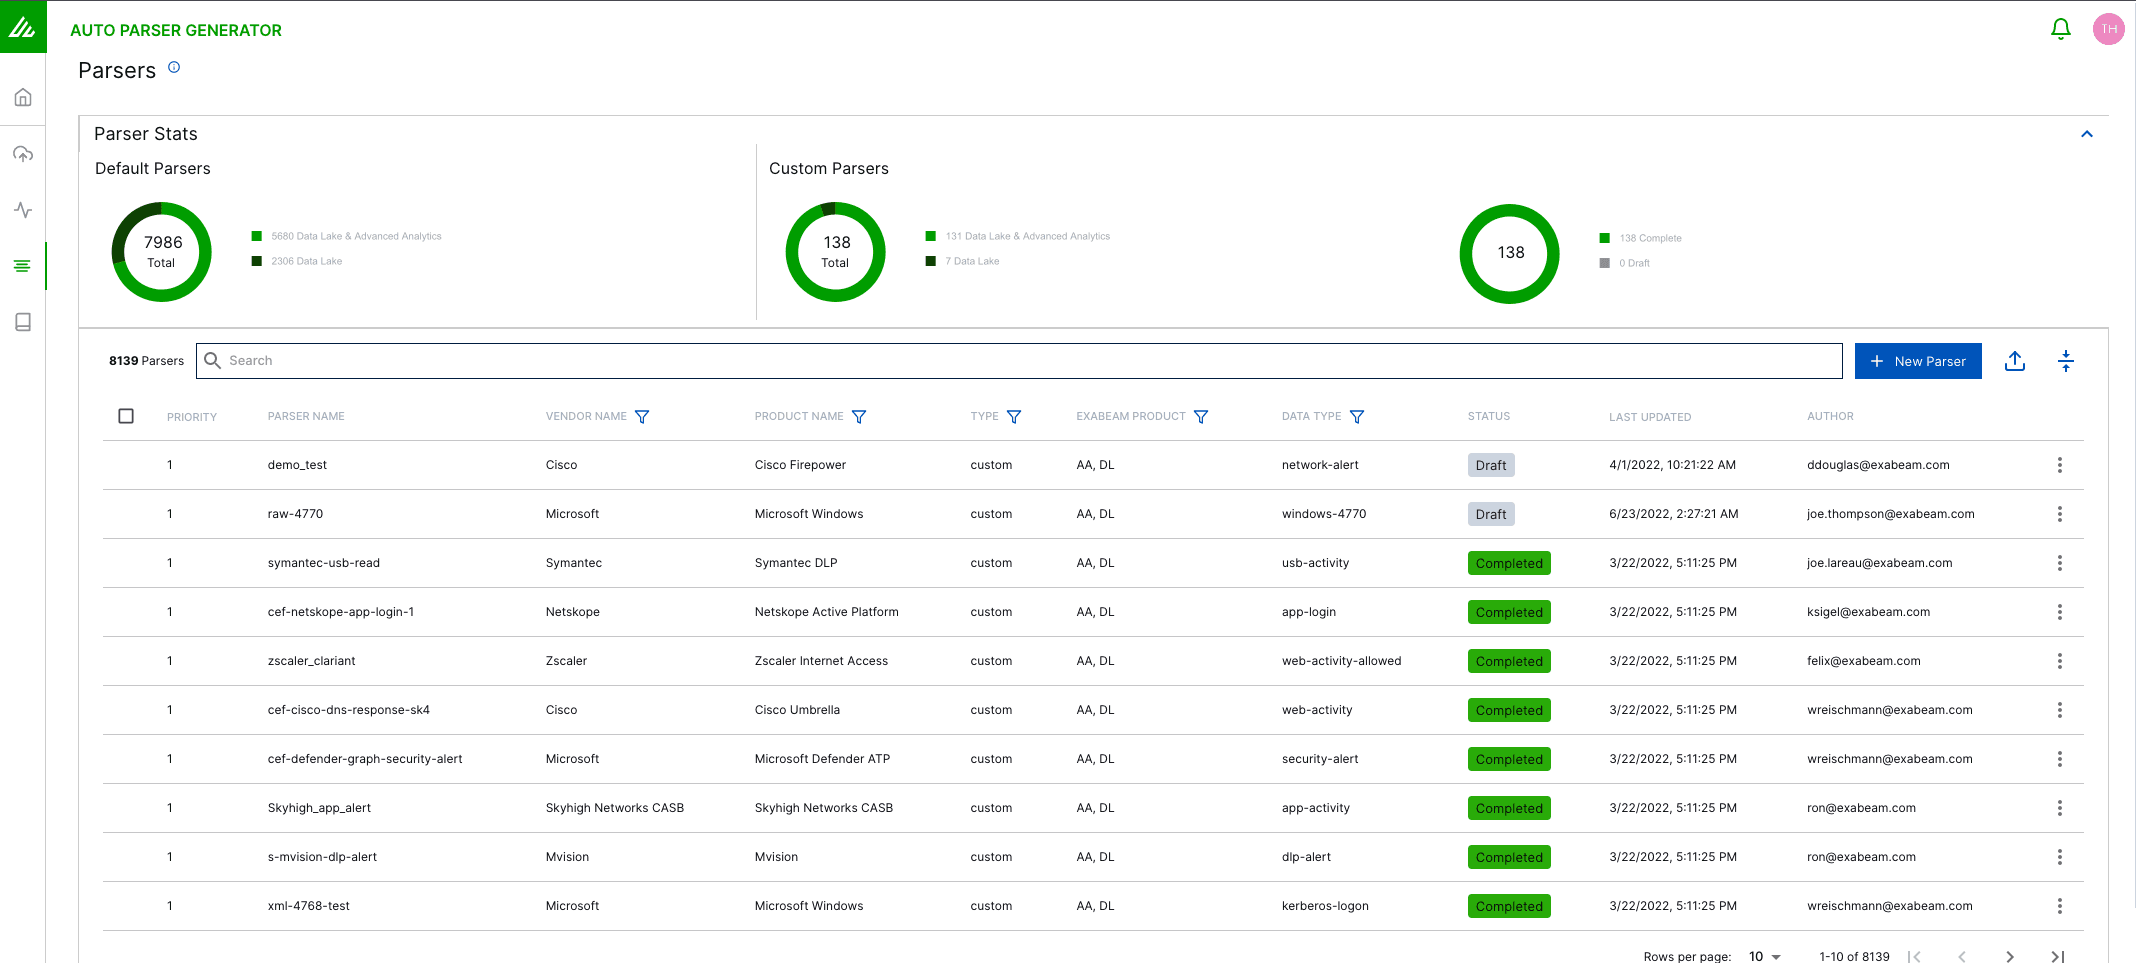
Step 8: New Parser
Select new parser
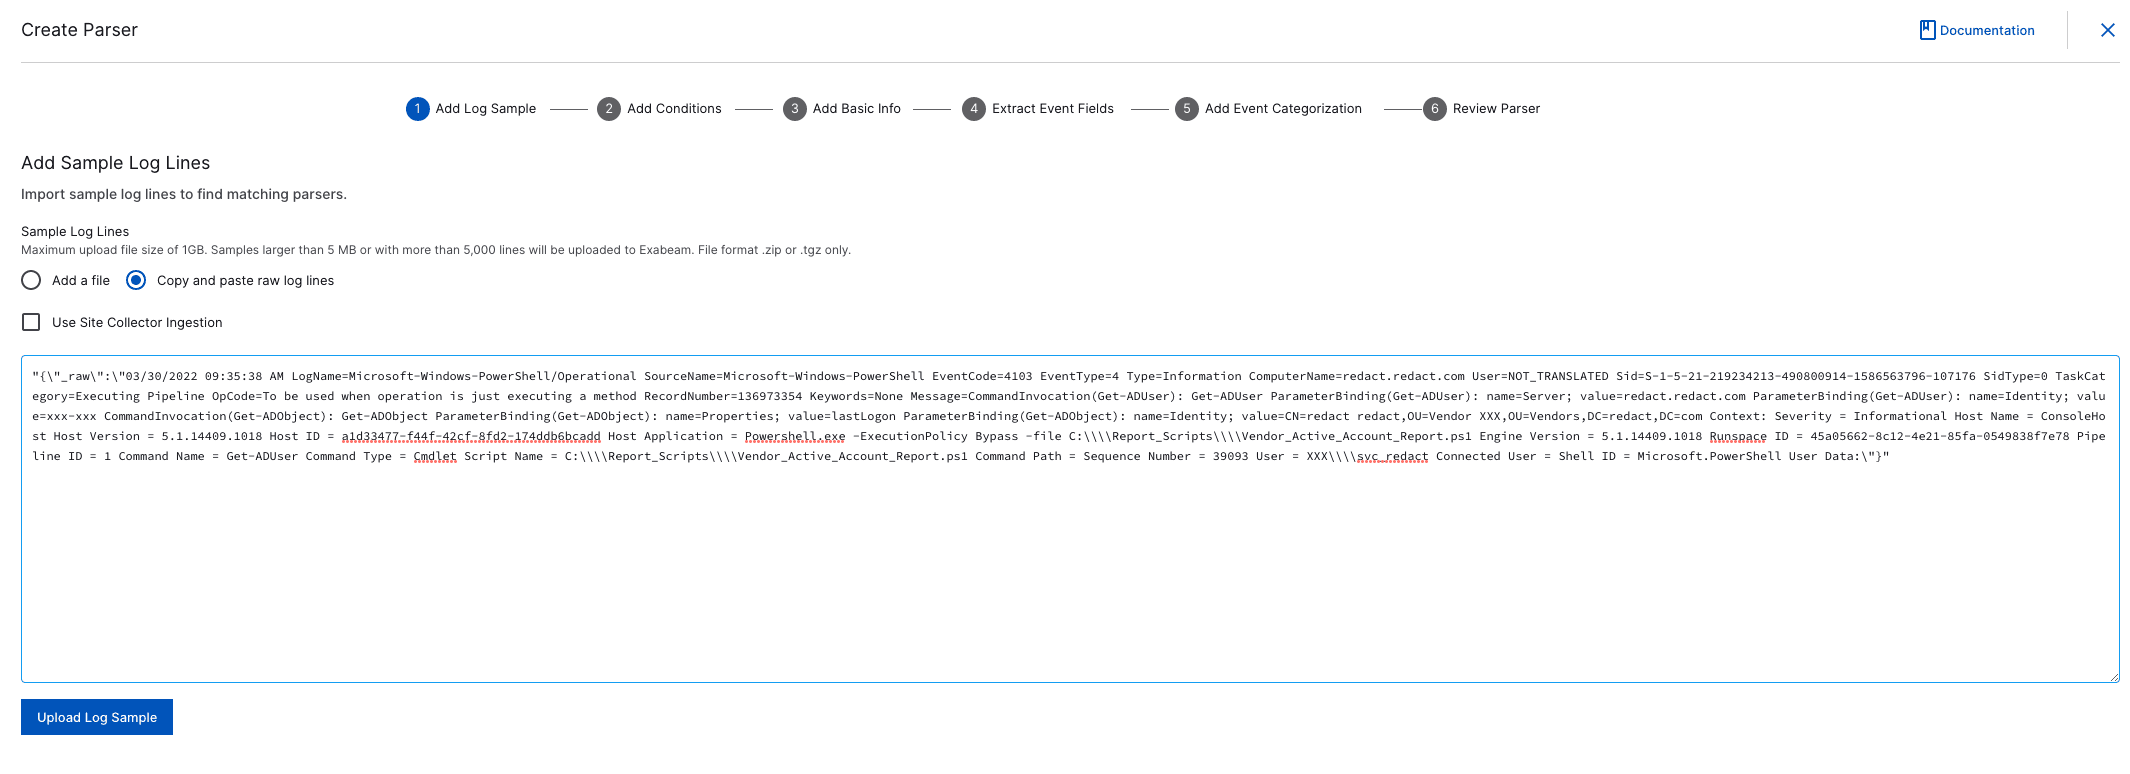
Step 9: Uploading Sample
Select Copy and paste raw log lines
Paste the message field value from your sample file.
Upload sample
Step 10: Parsing Details
Select view parsing details to view the parser that matches this event type.
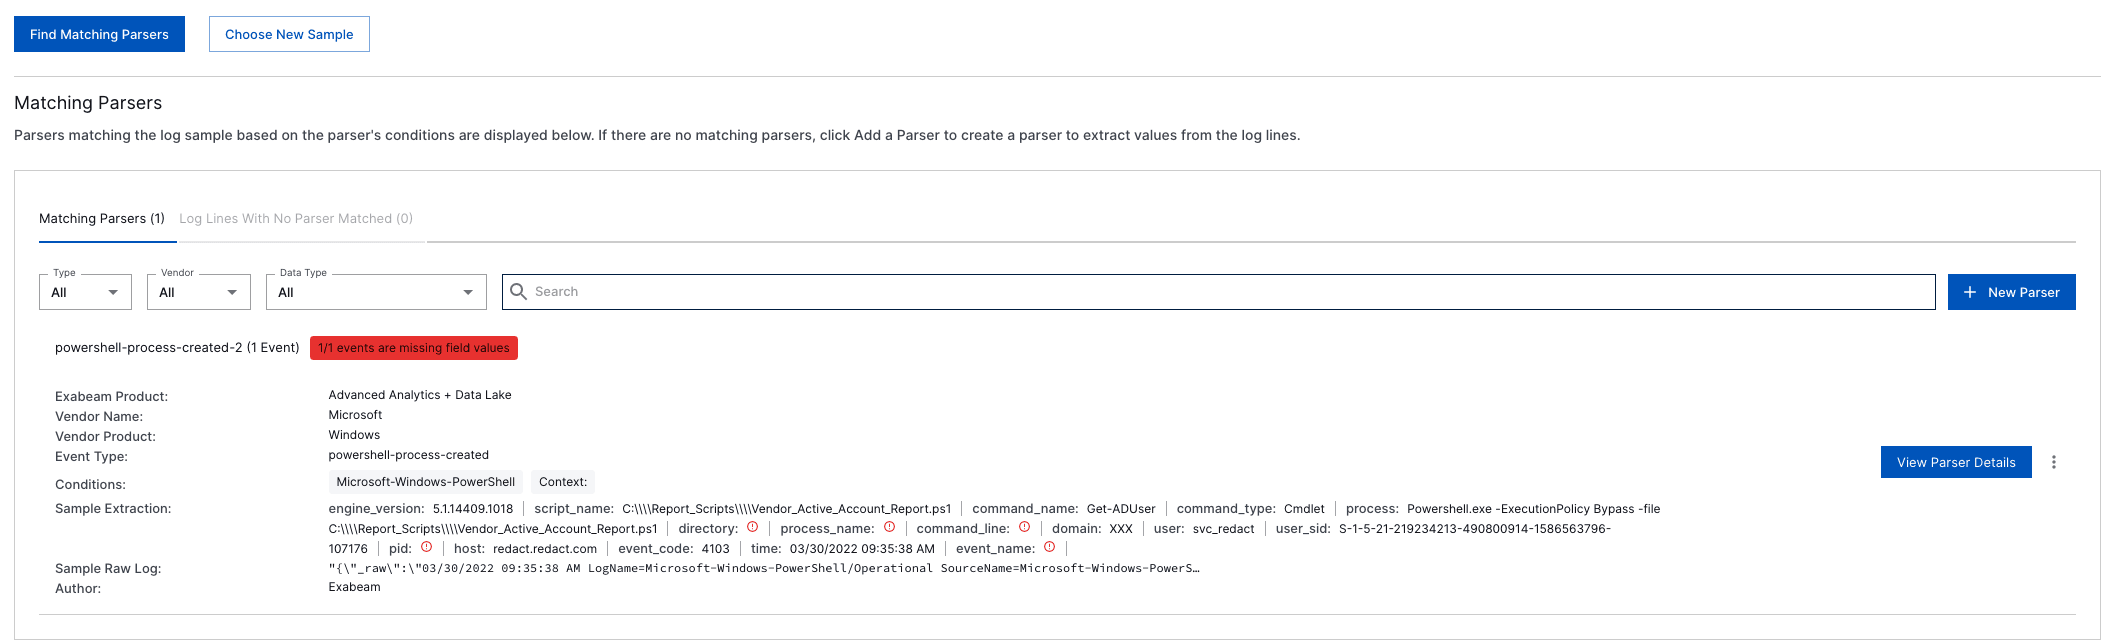
Step 11: Validation
Validate if all the fields you need are populated. src_ip, dest_host, user, etc…
(Note: Do not change these field names IE: “source_IP”. Exabeam has its own field name format that matches the Advance analytics template)
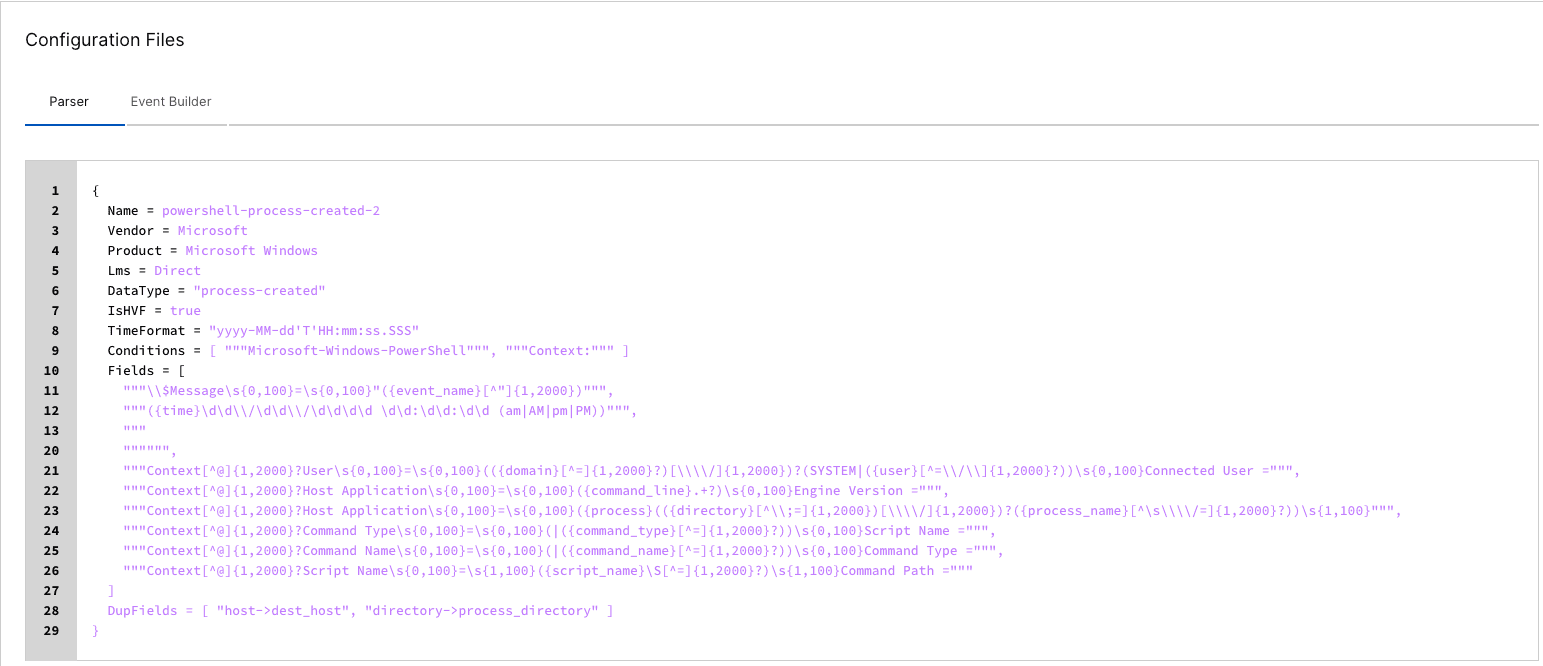
Auto Parser Generator provides you the parsers at the bottom under “Configuration Files” If you need to make some changes, you can download the parser and change the regex changes as needed.
Step 12: Sample Data
Let’s test a quick sample into Exabeam. The benefit of Cribl is you can quickly test and send a single event to Exabeam and validate how the vent will look inside of Data Lake or Advanced Analytics.
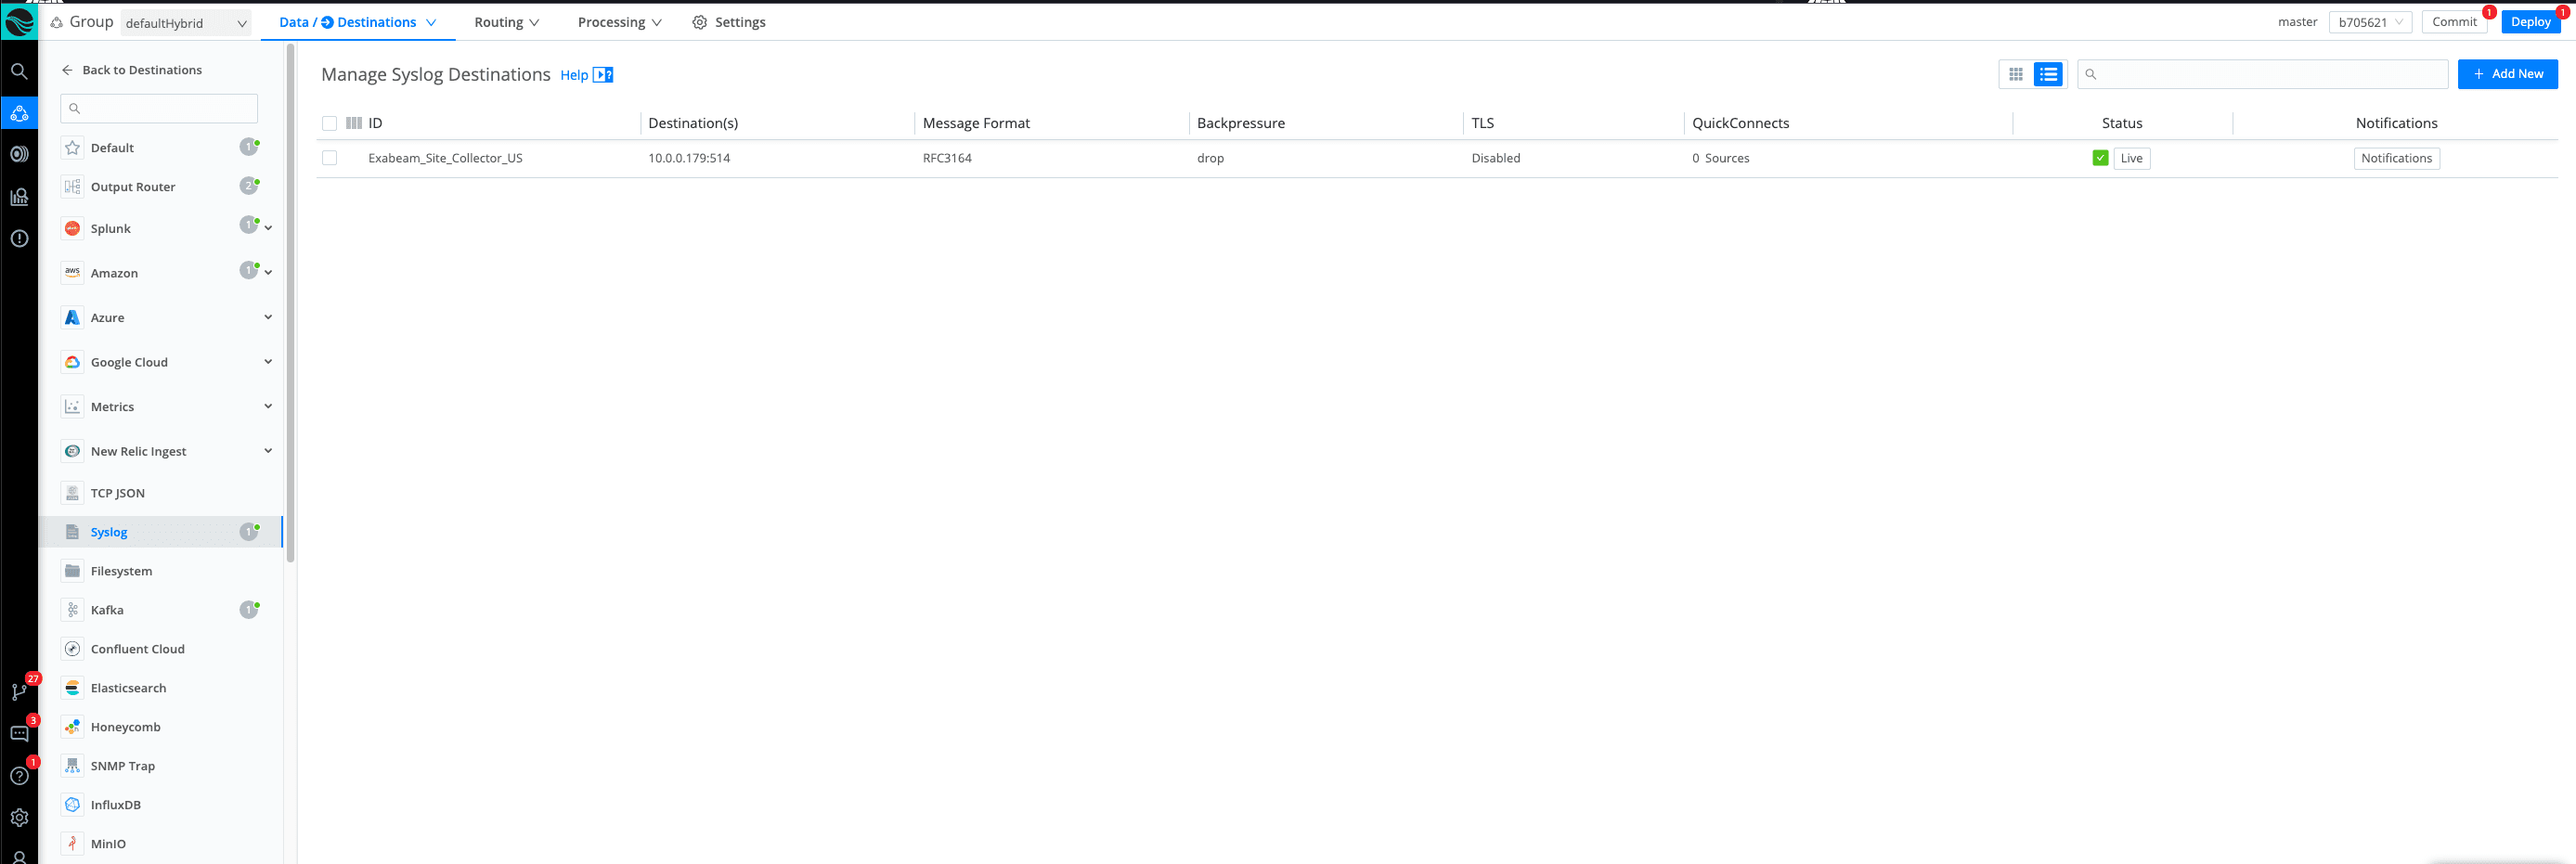
Go to Destination
Syslog (select the Syslog destination that is your Exabeam Site collector)
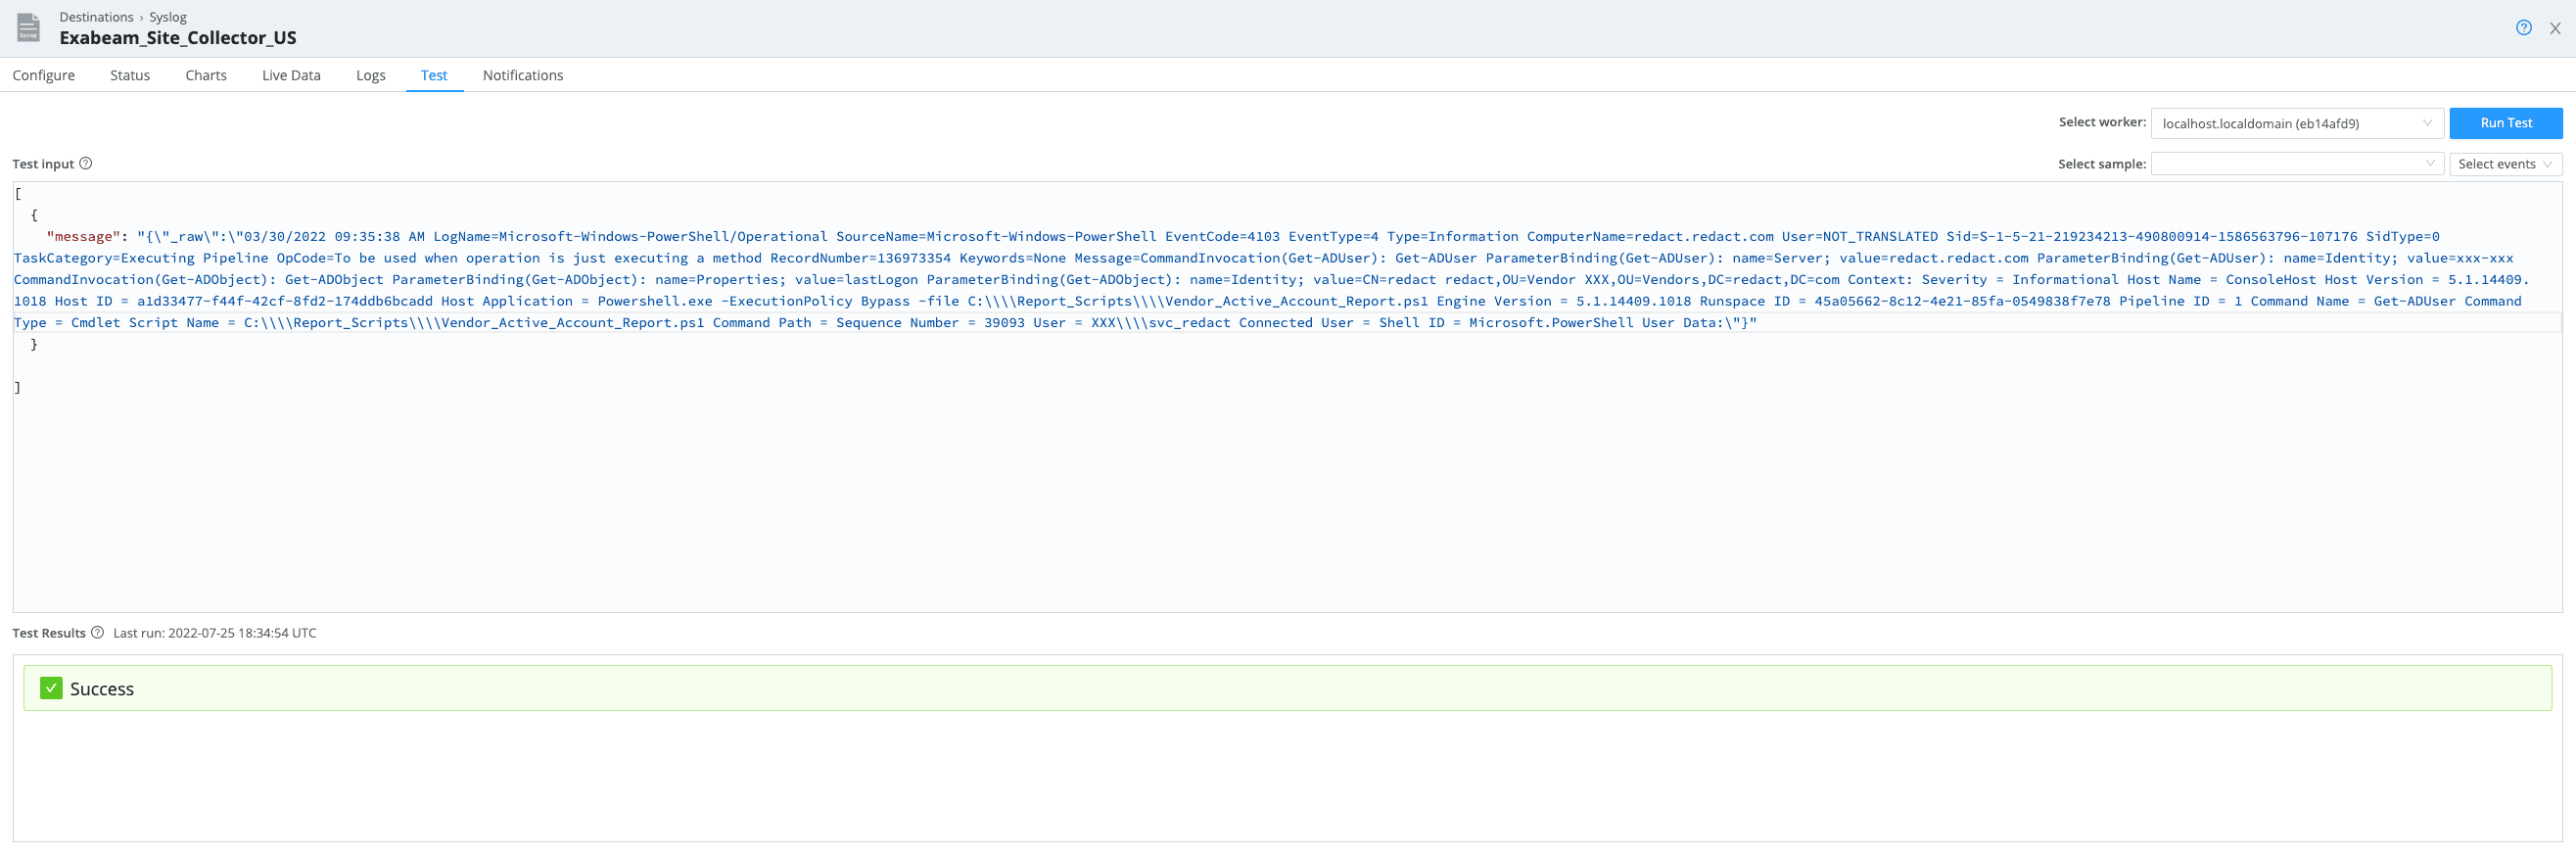
Step 13: Test Tab
Go to the TEST tab and copy and paste the message field precisely like the image in the (Test Input)
[{"message": "The THX circuit is down, generate the optical panel so we can connect the JSON application!"
}
]"
click on run test
(Note: Before sending anything, make sure to change the asset name and the username to a dummy account. The reason behind changing these fields is because Advance Analytics has hundreds of models out of the box, and you do not want to ruin these models while testing out your data.)
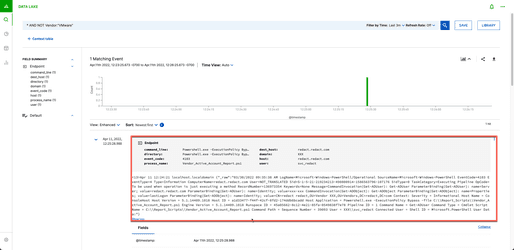
Step 14: Events Appear
You should see your event show in Exabeam Data Lake in a few seconds. You can run a search to look at your forwarder IP/Host
Example syntax: Forwarder:”IP/host”
You can see we are using the right parser If you look at (exa_parser_name) and that matches the parser in the Auto Parser generator.
Summary on Parser Validating with Exabeam and Cribl Stream
By using Cribl Stream, organizations can send the security logs to Exabeam while maintaining the flow of data into a Splunk instance. Cribl Stream lets organizations make the decisions that benefit their organization the most with how they manage, route, and store observability data.
The fastest way to get started with Cribl Stream and Cribl Edge is to try the Free Cloud Sandboxes.