

It’s been nearly ten years since “The Ultimate CPU Alert – Reloaded” and its Linux version were shared with the SolarWinds community. At that time, managing CPU data from 11,000 nodes, with updates every five minutes to a central MSSQL database, was a significant challenge. The goal was to develop alerting logic to identify when a server was experiencing high CPU usage accurately.
Reflecting on those initial, archived posts highlights the complexity involved in creating alert logic for both Windows and Linux systems. This work required a careful balance to ensure the database continued to operate smoothly, a task familiar to those who have found themselves in the role of a database administrator by accident, especially when dealing with specific types of database waits.
A recent insight, sparked by my move to Cribl, led to a simple yet impactful question: “Is your CPU under pressure, and how severe is it?” The approach laid out below analyzes and transforms operating system telemetry before it is stored in a timeseries database. Instead of analyzing millions of data points in every query, this method uses a distributed analysis model powered by Edge that improves query response times and makes performance insights more accessible for everyone, not just for IT operations experts.
If you’re interested in a straightforward way to understand CPU usage, this journey from past to present will showcase how Cribl Edge is making efficient and effective analysis a reality.
Revolutionizing Data Analysis: The Power of Cribl Edge
Cribl Edge represents a significant shift in how we collect and transform data across diverse environments like Linux, Windows, and Kubernetes. This innovative agent moves beyond the traditional methods of aggregating metrics, events, logs, and traces into a single, central database for analysis. Instead, Edge evaluates the data right at its source, determining its relevance before it’s even sent to a centralized time-series database. This process ensures that only meaningful telemetry data is processed and applied consistently across our Fleets of Edge Nodes. Updates are managed smoothly through a CI/CD Pipeline and are centrally overseen via Fleet Management.
Enhancing Alert Logic Through Cribl Edge
To appreciate the advancements Cribl Edge offers, it’s essential to consider the limitations of past practices, such as those found in SolarWinds Orion and other platforms that adhere to the store-then-analyze model. The drawbacks of this method become clear, especially when considering CPU data collection set at 600-second intervals—a compromise made to balance the database’s load. Our innovative solution, groundbreaking for the early 2010s, involved tagging each node with its logical processor count using a stored procedure. This minimized the frequency of heavy queries to a massive database table during alert checks that executed every 60 seconds. The alert now considered CPU core count, processing efficiency, and a standardized utilization threshold to provide better insights into CPU performance.
However, this method reveals a significant limitation upon closer examination. The alert system analyzes data collected at five-minute intervals (marked in green) every minute. As a result, the alert logic’s assessment for each interval is based on the first data point, ignoring any changes in CPU activity that occur afterward. Although this approach was practical initially, it ultimately delays our ability to promptly detect and respond to critical changes.

The Essence of Alert Timeliness
Picture this: we clock a sharp rise in CPU usage precisely at our scheduled data collection point every 5 minutes. There’s a deliberate 2-minute pause to avoid rash decisions before firing an alert. This delay helps us sidestep alarms about fleeting spikes that don’t pose real threats. Yet, it also risks slowing our response to genuine issues.
Why delay triggering an alert action? Alert fatigue is a well-known headache. It’s the barrage of alerts, many insignificant, that desensitizes us. While reducing the number of alerts seems easy, the real solution lies in enhancing the alert system’s intelligence. It’s about distinguishing genuine issues from everyday fluctuations more effectively. The adage “garbage in, garbage out” couldn’t be more apt.
Consider our current monitoring setup for CPU usage. If an issue occurs just after a data capture, it flies under our radar until the next cycle, nearly 5 minutes later. Add the system’s 2-minute caution, and it’s almost 7 minutes before we acknowledge the issue.
What’s the impact of this lag? For critical situations where the CPU is consistently overwhelmed, it means a nearly 7-minute wait before raising the alarm. Every second is precious given the typical response workflow—diagnosing the problem, identifying the cause, and implementing a solution. In urgent scenarios, a 7-minute delay is an eternity.
Solving the Data Dilemma
At first glance, the solution to closing data gaps might seem simple: gather more data. Modern observability platforms have deployed agents that capture telemetry much more frequently—in seconds rather than minutes. Imagine collecting a metric like { "_time": 1702762625.783, "host": "criblGOAT", "node_cpu_seconds_all_total": 13.48, "mode": "nice" } every 10 seconds as opposed to every 5 minutes. This change alone offers us 59 extra data points in the same timeframe, enriching our dataset significantly.
Yet, reducing the collection interval to 10 seconds translates into a sixtyfold increase in data volume. This surge demands considerably more storage and processing power, calls for more advanced databases and data structures, and may even require expanded network capacity. In essence, while more frequent data collection provides richer insights, it also introduces its own complexities without careful management and analysis.
And Now For Something Completely Different
Embracing a New Approach
Recall those decade-old posts we talked about earlier. There’s now a more streamlined way to tackle the question: “Can my server handle its workloads efficiently, even with CPU utilization above 90%?”
Cribl Edge: Power at the Edge
The data collection challenges of yesteryears, notably addressed by increasing frequency to every 10 seconds, inadvertently led organizations to deplete their observability budgets 60 times faster. Surely, there must be a smarter route. To paraphrase Robin Williams’ Genie from the Disney classic, Aladdin: “It’s all part and parcel, the whole Edge Node gig. Phenomenal cosmic powers! Itty bitty living space!” While he might have referred to a genie rather than an Edge Node, the sentiment resonates.
Cribl Edge is the smarter way by bringing the capabilities of Cribl Stream. This approach empowers us to collect, streamline, enrich, and standardize data right at the source. Regarding CPU performance metrics, we’re not just gathering data blindly; we’re asking the right questions upfront. This means we can filter and transmit only the most pertinent answers to our central database, where they can be integrated into alert definitions and visualizations, answering the critical question: “Is it the CPU?”
Get Your Fleets Ready!
Every Edge Node embarks as part of a Fleet, a concept central to managing configurations efficiently. Fleets synchronize settings like data sources, pathways, processing sequences, and final destinations. A single Fleet is your starting point for those on a Cribl Free license or plan. However, segregating your production Linux and Windows servers into distinct Fleets becomes crucial as you gear up for production.
PRO TIP:
You can configure the data granularity per Source. In Edge, you can use the same Source type (`System Metrics` for Linux and `Windows Metrics` for Windows) and change the Interval on the Source within your Fleet to match your service tier to collect telemetry at intervals aligned with your Service Level Agreements.
To illustrate, let’s consider a simplified scenario: I’ve crafted a singular Pipeline tailored to handle either Linux or Windows metrics, employing specific Functions for each. In a real-world production setting, a more refined approach might involve using Routes to channel Linux and Windows metrics into their respective Pipelines. Yet, in the streamlined world of an Edge Node—where the emphasis is on agility rather than the scale of a Stream Worker Group—linking a Source directly to a Pipeline via QuickConnect emerges as the most efficient approach for our testing.

Crafting a Pipeline of Insights
Our Pipeline is meticulously engineered to sift through vast amounts of telemetry data right at its source, ensuring that only key insights and necessary evidence are forwarded to an observability platform. They can be visualized, analyzed, and integrated into alert systems. Despite the differences between Windows and Linux operating systems, the core objectives remain consistent:
Identify the total number of CPUs,
Assess the workload on these CPUs, and
Evaluate the demand for CPU cycles.
To bring this complex data within reach of Subject Matter Experts (SMEs), we generate a node_cpu_congestion_status dimension for the CPU metrics. This dimension’s value—be it OK, INFO, WARN, or CRITICAL—is determined by predefined logic and is fully customizable to suit your specific scenarios.
While our Pipeline caters to both Windows and Linux platforms, it’s crucial to recognize that no solitary metric can unveil every nuance of resource constraints. For instance, a single-threaded application might max out one CPU core, indicating 100% utilization, yet the overall CPU load and process queue remain within acceptable limits. The digital landscape is fraught with potential snags, and our primary aim is not to provide an exhaustive solution to every possible problem but to significantly speed up both automated (via alerts) and manual diagnostic processes.
Before configuring this Pipeline for your Cribl Edge Fleets, let’s set realistic expectations on what the standard configuration delivers for Linux and Windows metrics.
Simplifying Linux Metrics Analysis
Our Linux Pipeline cleverly interprets critical metrics—such as the 1-minute load average and the total processor count—to establish a node_cpu_congestion_status dimension. This categorization is pivotal: INFO is triggered at a load average equal to or greater than the number of processors, WARN is set off at double that load, and CRITICAL at triple, all while the CPU’s utilization rate hovers above 90%. This nuanced approach sets our system apart, offering a precise measure of CPU strain.
In refining our data, we bypass the conventional load1, load5, and load15 metrics. Instead, the Pipeline innovates by calculating two essential metrics: node_cpu_active_pct and node_cpu_load_1m_max. These, coupled with the processor count and metric interval, serve as crucial supporting evidence in our analysis.
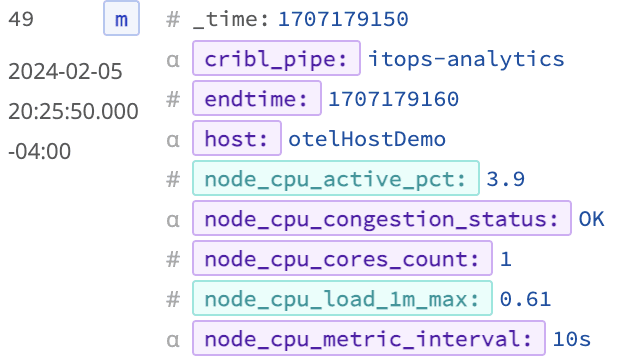
To see how this Pipeline improves the data volume overall, examine a sample of events in the right pane’s Simple Preview mode and click the Pipeline diagnostics icon.

What’s the takeaway from our efforts? We’ve achieved a staggering 60x boost in data granularity compared to traditional 5-minute polling intervals. Even with an increase in data points, we still achieve a 21% drop in the volume of telemetry data—measured in bytes—thanks to fewer events being transmitted overall. This dual achievement of enhanced granularity and reduced data transmission, especially with pre-analyzed, consistent data points for CPU congestion, crafts the ideal scenario.

While I can’t guarantee a decrease in the number of times platform owners will inquire, “Is it the CPU?”, I’m confident in saying this solution would have been a game-changer for me a decade ago. As an on-call Enterprise Monitoring Engineer for a Fortune 25 company, understanding the nuances of CPU performance assessment could have significantly eased my responsibilities.
Deciphering Windows Metrics
Transitioning to Windows OS unveils a distinct landscape for CPU performance monitoring. Unlike Linux, Windows does not provide a load average, but instead reveals the CPU queue length, which reflects the backlog of processes awaiting execution. Though the mathematics behind the scenes differ, our Pipeline’s goal remains steadfast: to simplify complexity and offer a straightforward node_cpu_congression_status of OK, INFO, WARN, or CRITICAL, using analogous criteria. Remembering the role of CPU utilization thresholds in this calculus is crucial.
As an illustration, the Pipeline not only calculates the familiar node_cpu_active_pct but also introduces node_queue_length. These metrics and the node_cpu_congression_status dimension encapsulate our refined approach to Windows telemetry.

This methodology still secures a 60x enhancement in data detail over the traditional 5-minute polling cycle. Additionally, Windows metrics, by their nature, benefit even more from pre-aggregation, leading to a more significant reduction in the overall data volume transmitted for visualization and alerts. Given the verbose nature of Windows telemetry compared to Linux, optimizing data at the source before it hits the observability platform yields even greater benefits.
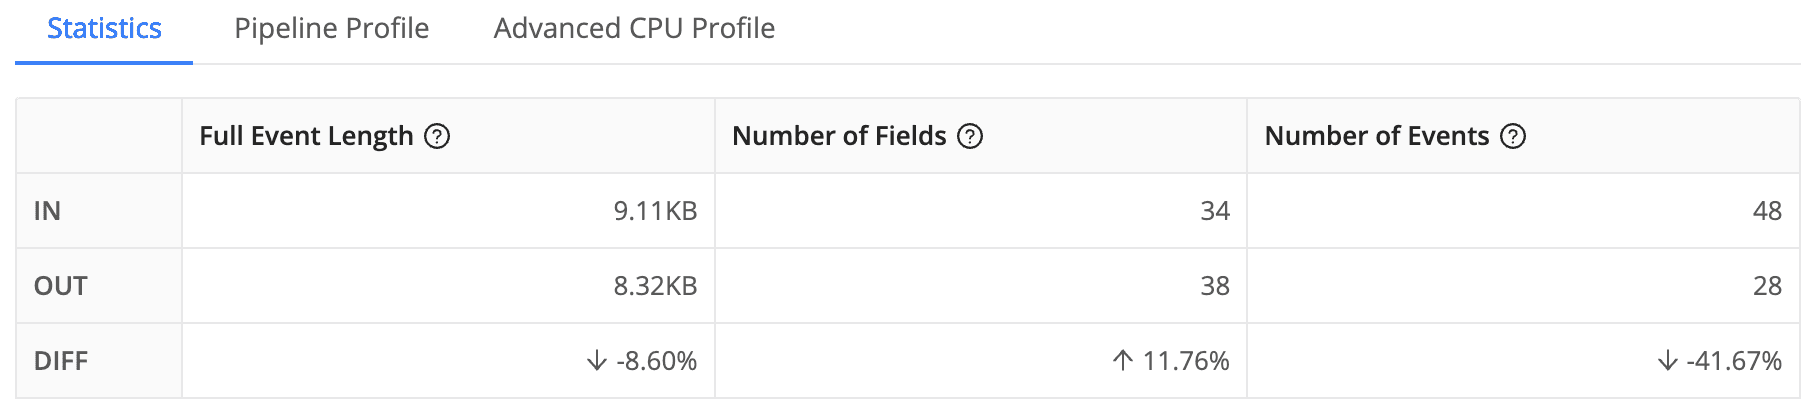
The impact of our Windows Pipeline is substantial, achieving a remarkable optimization in telemetry management. By reducing event size by 8.6% and the total number of events by 41.67%, we’ve managed a 47% decrease in the volume of metrics sent (measured in bytes). This level of efficiency not only streamlines the monitoring process but also delivers a straightforward, universally understandable response to the often-asked question, “Is the CPU usage too high?”
This significant reduction in data volume means Windows teams can enjoy a clearer, more concise view of CPU performance without sifting through excessive noise. The ability to provide a simple yet accurate assessment of CPU congestion status translates into faster decision-making and troubleshooting. These benefits are likely to earn appreciation from Windows administrators and teams alike.
Launching Your Pipeline Journey
Embarking on the construction of your own Pipeline marks the beginning of a transformative journey in data management. The methodology I’ve outlined above serves as a solid foundation for starting. I encourage you to embrace this framework initially, and then, as you become more familiar with its workings, feel free to adapt, enhance, and customize it to align perfectly with your unique environmental needs.
This process is not about strictly adhering to a set template but about understanding its principles and applying your creative tweaks. The goal is to tailor the Pipeline so that it not only addresses your specific challenges but also optimizes your data analysis and monitoring capabilities in ways that best suit your organizational context.

Start building a Pipeline by giving it a name and other details.

After clicking Save, you will be taken to the Pipeline configuration page, where you can click the gear in the upper right corner and then click the Manage as JSON button.

From this view, you can either copy and paste the complete JSON object listed in the Pipeline Configuration section below (easiest for our purposes) or import from a file, then click the next Save button. (If you called your Pipeline something other than ‘itops-analytics’, don’t forget to update the `id` field to match when you overwrite or import a file!)

From there, define your Source(s) and Destination(s), attaching them to the Pipeline. When you are done, you should have something that looks like this configuration below.

Make sure you click Commit & Deploy to get the Pipeline available on your Edge nodes.
What’s Next?
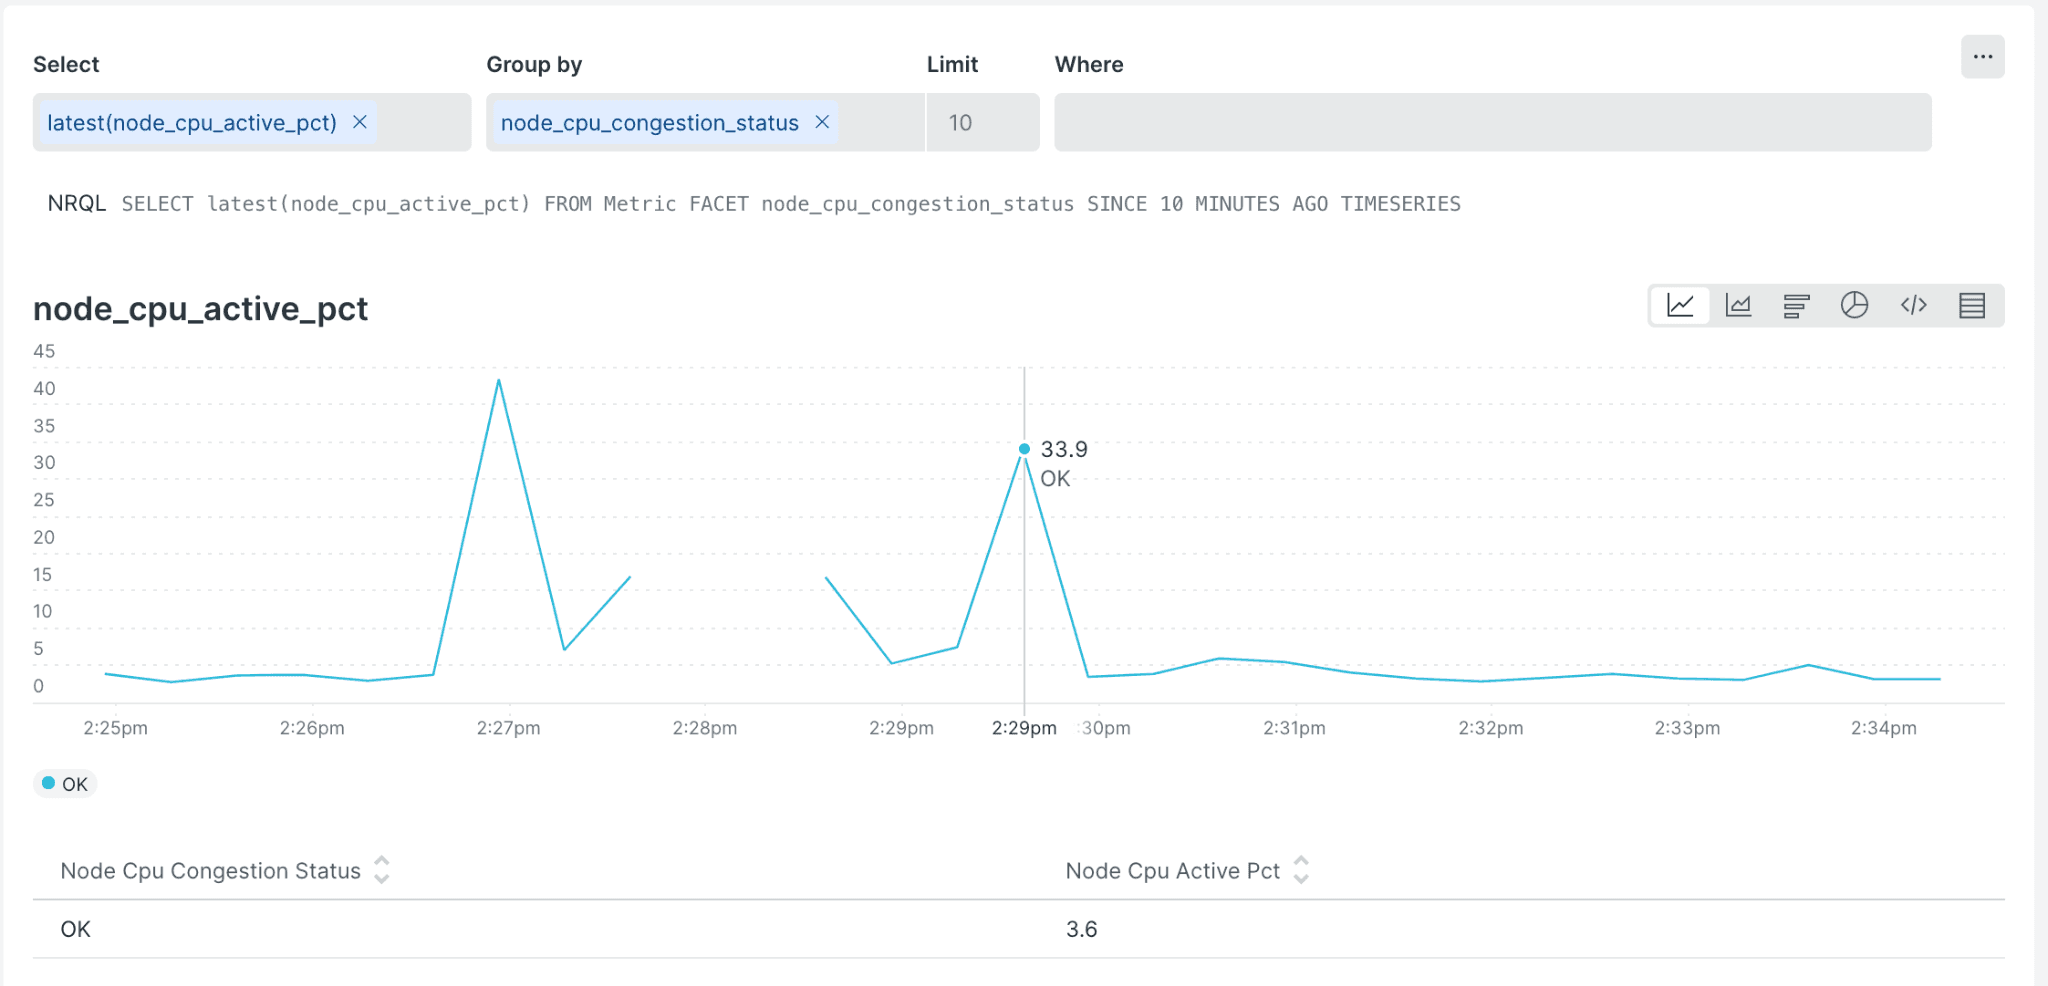
Sending these processed metrics to a downstream destination is destination-specific, but here is what it looks like when I send these metrics to my New Relic account. The chart below shows the latest node_cpu_active_pct metric calculated in the pipeline faceted by the node_cpu_congestion_status and we can explore a specific data point on the chart to answer “Was the server CPU congested at this point?”
Jump over to our Cribl Community and let us know how you adapted this pattern of analyzing telemetry streams for your environment.
Pipeline Configuration
{
  "id": "itops-analytics",
  "conf": {
    "output": "default",
    "streamtags": [
      "itops"
    ],
    "groups": {},
    "asyncFuncTimeout": 1000,
    "functions": [
      {
        "filter": "true",
        "conf": {
          "comment": "WINDOWS - Set CPU congestion status where CPU Queue Length > 3 * cores = \"CRITICAL\", 2 * cores = \"WARN\", 1 * cores = \"INFO\", ELSE \"OK\""
        },
        "id": "comment"
      },
      {
        "filter": "__metadata.os.os_id === \"windows\" && __inputId=='windows_metrics:in_windows_metrics'",
        "conf": {
          "passthrough": true,
          "preserveGroupBys": true,
          "sufficientStatsOnly": false,
          "metricsMode": false,
          "timeWindow": "10s",
          "aggregations": [
            "mode(windows_system_processor_queue_length).as(node_queue_length)",
            "mode(windows_cs_logical_processors).as(node_cpu_cores_count)",
            "sum(windows_cpu_percent_all_total).where(mode != 'idle').as(node_cpu_active_raw)"
          ],
          "cumulative": false,
          "flushOnInputClose": true,
          "groupbys": [
            "host"
          ],
          "add": [
            {
              "name": "node_cpu_congestion_status",
              "value": "( node_cpu_active_pct > 90 && node_queue_length > (node_cpu_cores_count * 3) ? \"CRITICAL\" : ( node_cpu_active_pct > 90 && node_queue_length > (node_cpu_cores_count * 2) ? \"WARN\" : ( node_cpu_active_pct > 90 && node_queue_length > (node_cpu_cores_count) ? \"INFO\" : \"OK\")))"
            },
            {
              "name": "node_cpu_metric_interval",
              "value": "'10s'"
            },
            {
              "name": "node_cpu_active_pct",
              "value": "node_cpu_active_raw.toFixed(1)"
            }
          ]
        },
        "id": "aggregation",
        "disabled": false,
        "description": "Evaluates CPU load via CPU queue length"
      },
      {
        "filter": "__metadata.os.os_id === \"windows\" && __inputId=='windows_metrics:in_windows_metrics' && windows_cpu_percent_all_total != null",
        "conf": {},
        "id": "drop",
        "description": "OPTIONAL: Drop cpu percent metrics in favor of the node_cpu_load_pct from the aggregations",
        "disabled": false
      },
      {
        "filter": "__metadata.os.os_id === \"windows\" || __criblEventType === 'stats'",
        "conf": {
          "remove": [
            "node_cpu_count_latest",
            "node_cpu_active_raw",
            "endtime"
          ]
        },
        "id": "eval",
        "disabled": false,
        "description": "Have fields/dimensions to drop? Do it here."
      },
      {
        "filter": "true",
        "conf": {
          "comment": "LINUX - Set CPU congestion status where Load Average 1 minute > 3 * cores = \"CRITICAL\", 2 * cores = \"WARN\", 1 * cores = \"INFO\", ELSE \"OK\""
        },
        "id": "comment"
      },
      {
        "filter": "__metadata.os.platform === \"linux\" && __inputId=='system_metrics:in_system_metrics'",
        "conf": {
          "passthrough": true,
          "preserveGroupBys": true,
          "sufficientStatsOnly": false,
          "metricsMode": false,
          "timeWindow": "10s",
          "aggregations": [
            "max(node_load1).as(node_cpu_load_1m_max)",
            "mode(node_cpu_count).as(node_cpu_cores_count)",
            "mode(node_cpu_percent_active_all).where(mode != 'idle').as(node_cpu_active_pct)"
          ],
          "cumulative": false,
          "flushOnInputClose": true,
          "groupbys": [
            "host"
          ],
          "add": [
            {
              "name": "node_cpu_congestion_status",
              "value": "(node_cpu_active_pct > 90 && load1_max > (node_cpu_cores_count * 3) ? \"CRITICAL\" : (node_cpu_active_pct > 90 && load1_max > (node_cpu_cores_count * 2) ? \"WARN\" : (node_cpu_active_pct > 90 && load1_max > (node_cpu_cores_count) ? \"INFO\" : \"OK\")))"
            },
            {
              "name": "node_cpu_metric_interval",
              "value": "'10s'"
            },
            {
              "name": "cpu_load_1m",
              "value": "load1_max"
            }
          ]
        },
        "id": "aggregation",
        "disabled": false,
        "description": "Use 1 minute load average + cpu cores to measure CPU congestion"
      },
      {
        "conf": {},
        "filter": "__metadata.os.platform === \"linux\" && __inputId=='system_metrics:in_system_metrics' && (node_load1 != null || node_load5 != null || node_load15 != null || node_cpu_percent_all != null)",
        "id": "drop",
        "disabled": false
      },
      {
        "filter": "__metadata.os.platform === \"linux\" || __criblEventType === 'stats'",
        "conf": {
          "remove": [
            "cribl_host",
            "starttime"
          ]
        },
        "id": "eval",
        "disabled": false
      },
      {
        "filter": "true",
        "conf": {
          "comment": "Publish node_cpu_active_pct metrics with congestion_status"
        },
        "id": "comment"
      },
      {
        "filter": "true",
        "conf": {
          "overwrite": false,
          "dimensions": [
            "!_*",
            "*"
          ],
          "removeMetrics": [],
          "removeDimensions": [],
          "fields": [
            {
              "metricType": "gauge",
              "inFieldName": "node_cpu_active_pct"
            },
            {
              "metricType": "gauge",
              "inFieldName": "node_cpu_load_1m_max"
            },
            {
              "metricType": "gauge",
              "inFieldName": "node_queue_length"
            }
          ]
        },
        "id": "publish_metrics"
      }
    ],
    "description": "ITOps metrics Pipeline for analyzing complex metrics scenarios"
  }
}