
Postgres, like many database applications, has a robust dynamic trace capability. Combined with a highly configurable log facility, it’s quite possible to track database activity. But as with most attempts at observability, it isn’t quite that simple.
Logs provide high-level views into a Postgres service, emitting details describing errors, connections, checkpoints, and duration. A trace capability allows an external utility to be called at specific points in the code, enabling execution trace. This is based on probes inserted into Postgres source code. The standard external utility supported is Dtrace. Supporting other dynamic tracing utilities is theoretically possible.
One of the first issues you encounter when combining Postgres probes with a trace capability is that the probes are not configured by default. There are several reasons for this, including tracing’s potential to impose a non-trivial performance penalty. It’s generally something that is enabled only in a development environment. From the Postgres docs: By default the probes are not compiled into PostgreSQL; the user needs to explicitly tell the configure script to make the probes available.
AppScope has the ability to track all SQL activity associated with a Postgres service. This type of observability is not intended as a development tool. It should be useful to administrators and SREs without the need to modify Postgres source code. The observability detail can be readily enabled and disabled, in dynamic fashion, by updating AppScope config. More on dynamic config in a different post.
It’s relatively easy to enable. The biggest limitation is that the database must be restarted to allow it to be “scoped.” We expect to alleviate this limitation in future releases.
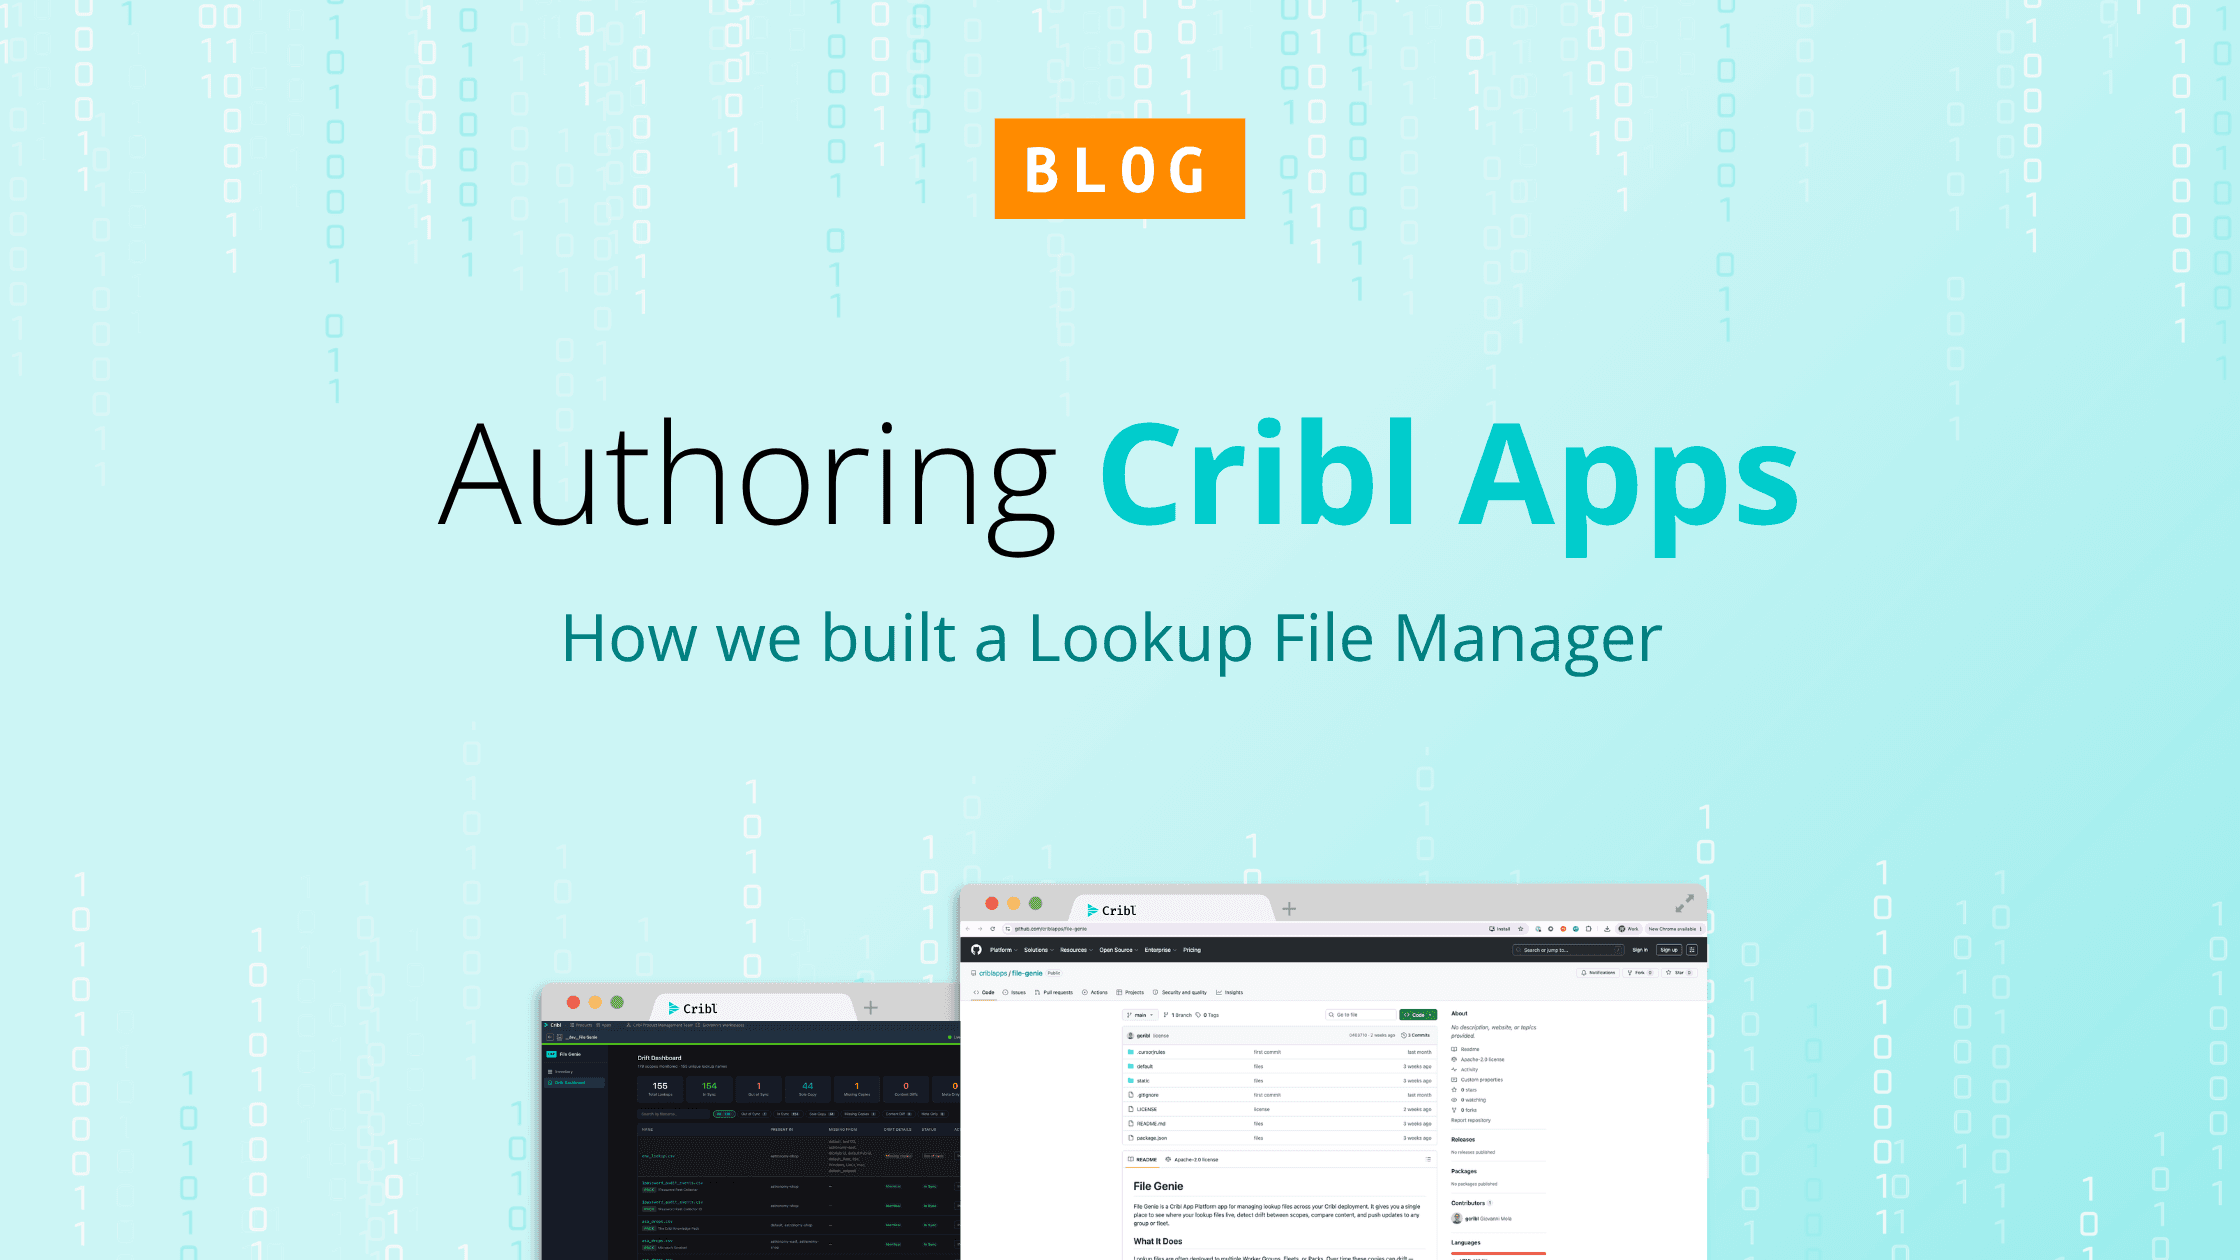
Scope Postgres
The Postgres service is “scoped” by causing the libscope library to be loaded when the service starts. The example below uses the libscope library directly. It’s also possible to use the ldscope application in lieu of a direct library load.
You can enable payload activity by using a config file, or by means of environment variables. The example below points to a config file, scope.yml, in /etc/scope.
$ sudo -u postgres LD_PRELOAD=/usr/lib/libscope.so SCOPE_HOME=/etc/scope /usr/lib/postgresql/10/bin/postgres -D /var/lib/postgresql/10/main -c config_file=/etc/postgresql/10/main/postgresql.conf
Client Activity
Connect to the Postgres service and perform whatever activity is needed.
$ sudo -u postgres psql -h 127.0.0.1
View Commands
Commands sent to the Postgres service will be emitted in the configured payload dir (/tmp by default) with the filename suffix *.in. The filename uses the pattern pid_localIP:port_remoteIP:port.in. Where IP addresses are not available, asin some SSL instances, the filename pattern replaces IP:port with tlsrx or netrx to indicate how the payload was extracted.
Given a binary data format, it’s convenient to use hexdump to observe the detail.
$ hd -v 27270_tlsrx:0_tlsrx:0.in
View Responses
Responses sent from a Postgres service are emitted as *.out files. As described above, they are written to the configured payload dir, and utilize the same filename pattern.
$ hd -v 27270_tlstx:0_tlstx:0.out
In Conclusion
While AppScope makes no attempt to provide an execution trace for Postgres, you can use AppScope to track all payloads sent and received by a Postgres service. Normally, payload capture of this sort is not very useful, due to encryption. However, AppScope can access payloads before they are encrypted, and after they are decrypted. This means that you can readily observe every command received, and every response returned. There is no need to enable probes, modify source code, or incur a severe performance penalty to track all SQL activity.
The ability to observe all SQL activity creates a unique concern. There can be details that qualify as PII (Personally Identifiable Information) in the SQL statements and/or responses. Recognizable PII will usually need to be redacted. The details about performing such redaction are beyond the scope of this post. Check out Cribl LogStream for reference.
While the prospect of observing any and all SQL traffic may not be new or unique, this prospect offers the ability to answer a number of difficult questions. Questions such as: when did that admin have access to the DB; was a specific table modified; what tables have been accessed; which remote clients have had access, and to which databases? You get the idea.
AppScope is available today. Check out the website, and get started by downloading it. Try it yourself by playing in our AppScope Fundamentals sandbox, which will walk you through how to use AppScope in an interactive shell right from your browser. Star us on GitHub and share what you’re doing with AppScope in our #appscope channel on the Cribl Community Slack!