
We’re currently evaluating the use of AWS Lambda as a way to execute diag Bots whenever the underlying dataset or the Bot itself changes. Before jumping into the implementation we wanted to understand the physics of the service – it’s not that we don’t trust the marketing materials, it’s just that they’re usually a bit light on details, you know 🙂
AWS Lambda gives you only one knob you can control – the amount of memory preallocated your function and the charges are linearly proportional to it. From a getting started and/or service point of view that is fantastic … however, computing (or functions) rarely depend on a single resource, usually some mix of CPU/RAM/IO is at interplay for most functions.
This is what the AWS states on their site about proportional resource allocation, (emphasis mine)
AWS Lambda allocates CPU power proportional to the memory by using the same ratio as a *general purpose* Amazon EC2 instance type, such as an M3 type. For example, if you allocate 256 MB memory, your Lambda function will receive twice the CPU share than if you allocated only 128 MB.
In our case we want to understand the performance/allocation of:
network – ’cause we need to process data that lives on S3
CPU – ’cause data analysis can be CPU intensive (decompression, searching etc)
Over the following dimensions
Concurrency – we need to have 100s or 1000s of bots to execute concurrently
RAM allocation – this is what we’ll be charged on, so … $$
Findings
The RAM knob, controls other resources as well, some better than others – e.g. CPU is controlled better than, say network. Concurrency does not matter, at least up to 1000.
Less words more charts please …
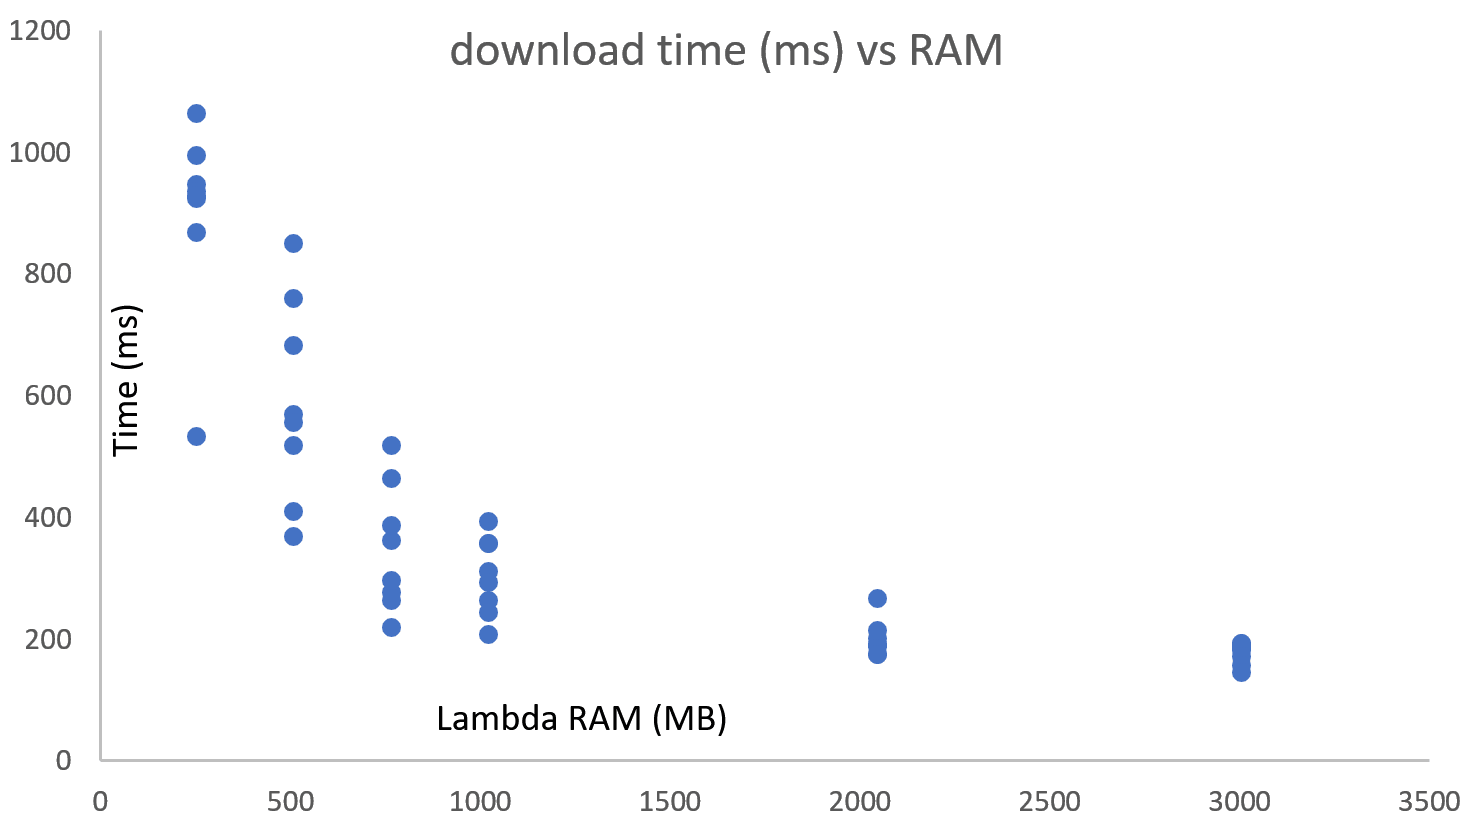
Network performance improves as more RAM is allocated, performance variability is higher on the low end.
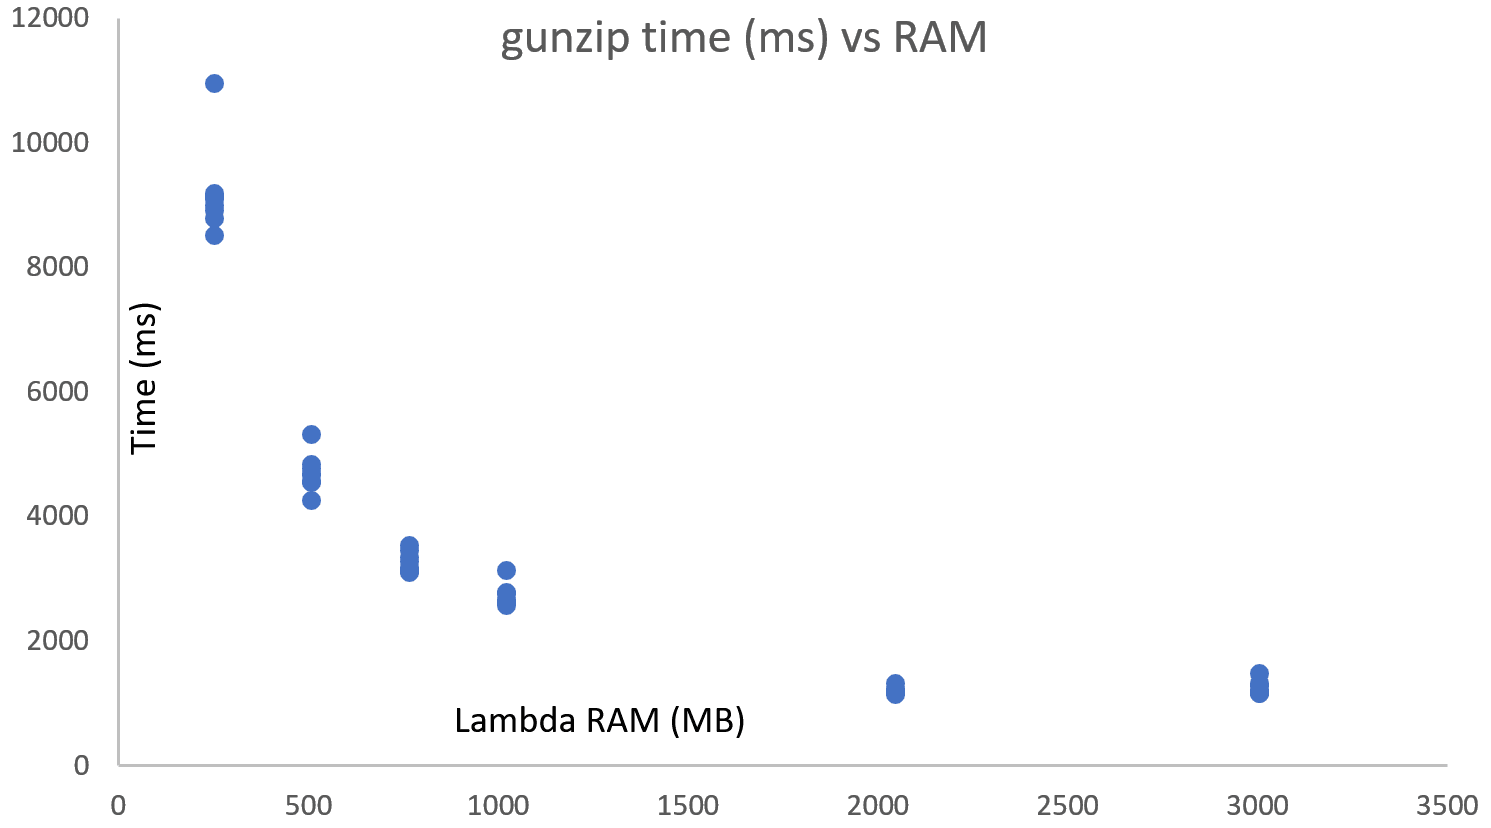
CPU performance also improves with RAM, variability in performance improves, but it is pretty low to start with. Seems like somewhere between 1-2GB is where a full core is allocated. This seems to be consistent with what OpsGenie folks found out as well (great read, wish I had found the link before doing the tests)
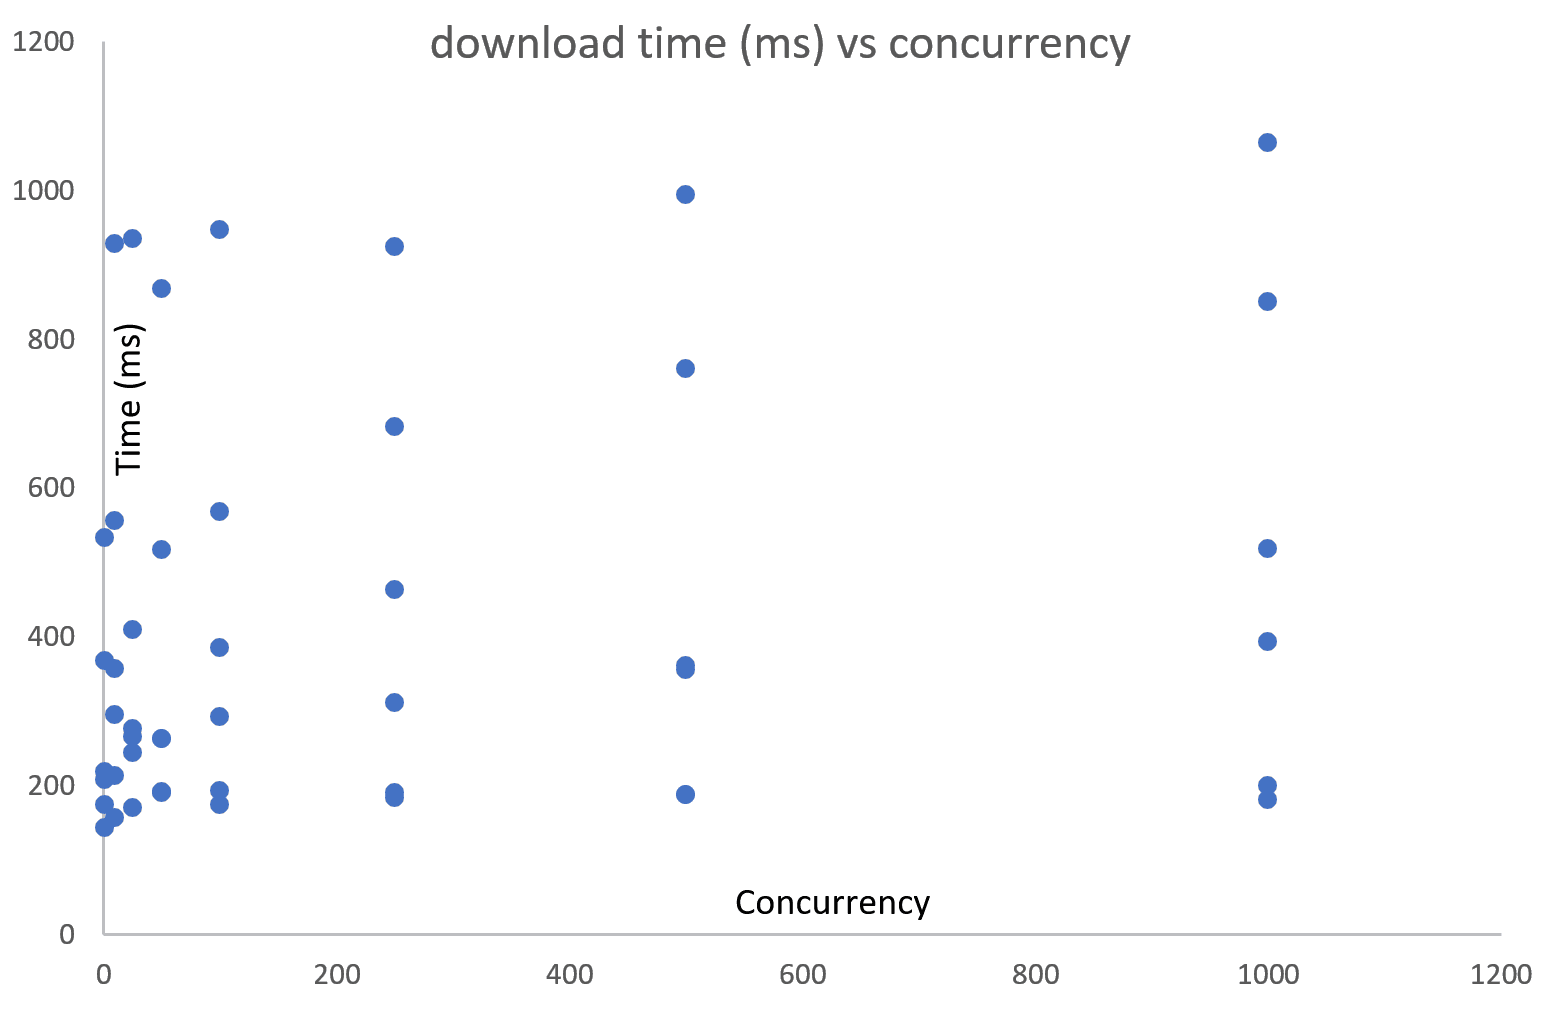
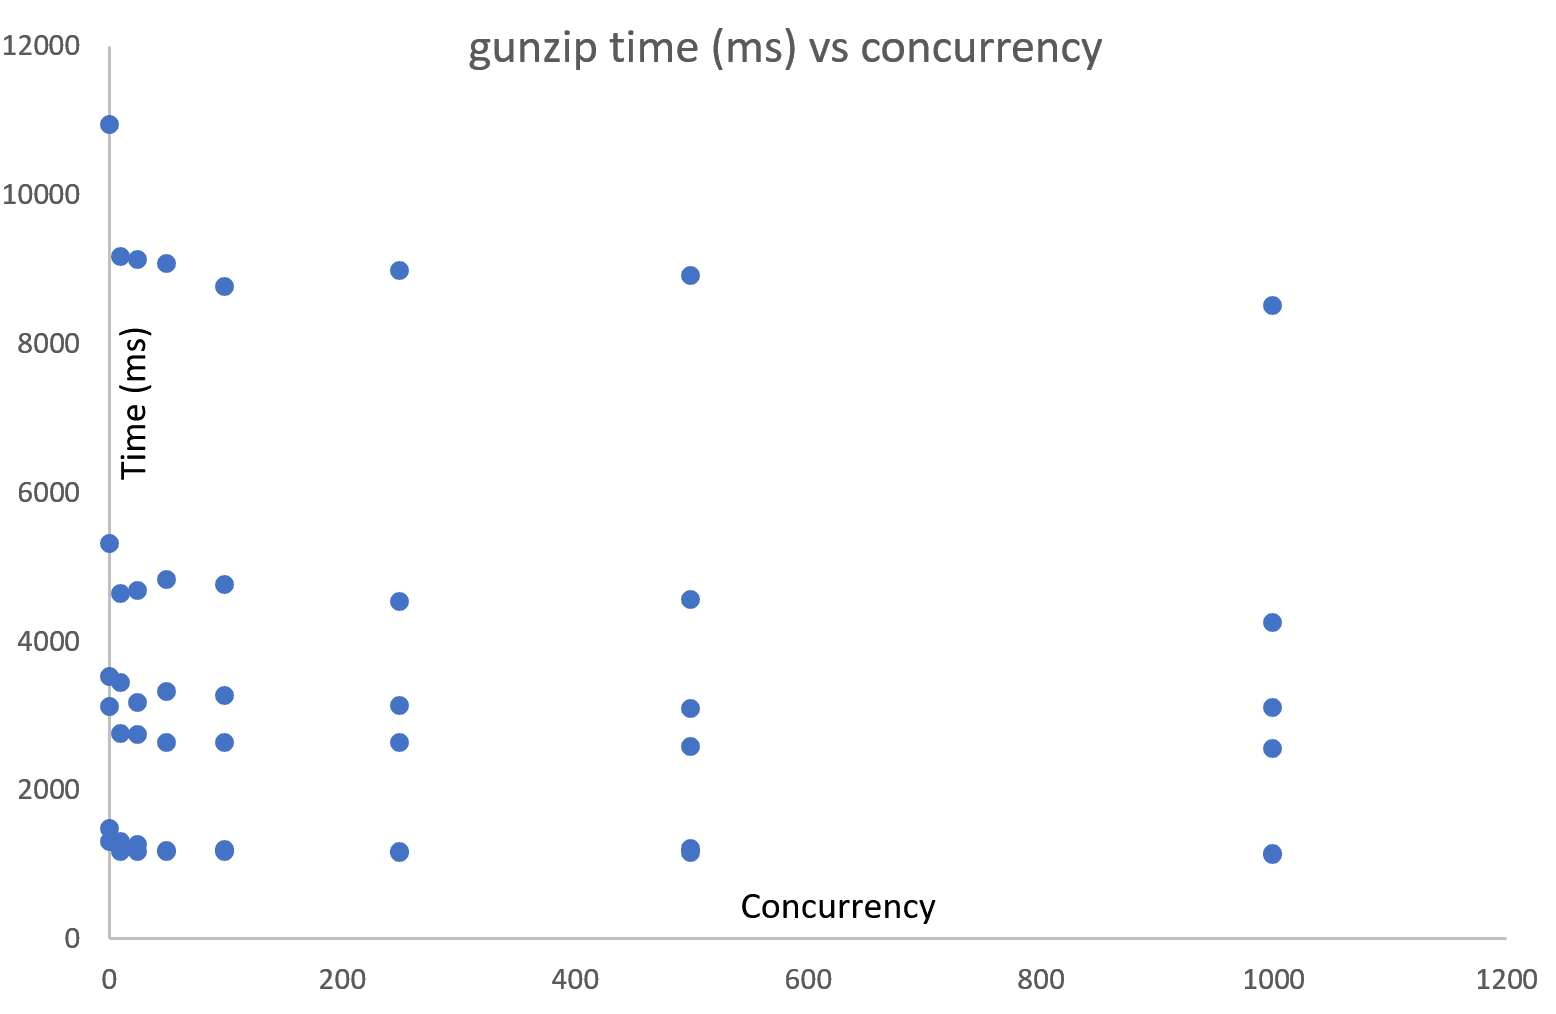
The following two charts show download and gunzip vs concurrency, showing no correlation – (thought you might ask, log scale on either axis does not make a difference)
Conclusion
We now know, that in order to get a full CPU we need to allocate somewhere in the 1-2GB of RAM, we shouldn’t be too conservative when it comes to RAM as it isn’t the constraining resource. By AWS’ own admission seems like Lambda was build for “general purpose” computing, which might not be exactly what one might need for “compute intensive” workloads. We’ll investigate Fargate which gives you a little bit more control about what resources you allocate to your function.
If you find this type of work interesting, drop me a line: ledion at cribl.io or @ledbit … we’re hiring!!
Want to play with the data yourself? We love dogfooding
Test methodology
We registered a lambda function in US-West-2 that was capable for running in 3 different modes:
download – tests network
download + decompress (gunzip) – tests CPU, single threaded
download + decompress + utf8 decode + scan for a needle (grep) (not presented here)
The code works in a streaming fashion, ie any downloaded chunk of data is pushed through the decompression and then to “grep” – this means that the actual RAM needs of the function are very low – Lambda itself reports usage in the 70MB range. The lambda function measured and reported the times the work took – therefore the numbers do not include scheduling and startup time. Note, to measure CPU performance we’re using decompression, gunzip single threaded, want to find out where is a full core allocated to a Lambda function.
We used the following test dimensions:
Concurrency: 1000, 500, 250, 100, 50, 25, 10, 1RAM: 256MB, 512MB, 768MB, 1GB, 2GB, 3GB
The tests were executed in increasing RAM allocations and decreasing concurrency – ie
RAM: 256MB , concurrency: 1000, 1000, 500, ….RAM: 512MB , concurrency: 1000, 1000, 500, ….….
You’ll note that concurrency of 1000 is ran twice – we did this to ensure that the Lambda function was “warm” in all places where it needed to be scheduled. We designed the test to run in decreasing concurrency for this exact reason as well.
The lambda function reports the number of bytes processed, number of matches found and the amount of time elapsed – therefore we could easily check for correctness and gather performance numbers.