
TL;DR:
Node.js sends synchronous requests like DNS lookups to a pool of worker threads, which by default is number of cores / 2 which can be overloaded by many requests to a DNS name which does not resolve, indefinitely blocking connections to legitimate names which will resolve. Beware of your application making many requests to names which do not resolve. This is the story of how I found this condition and diagnosing the root cause using common tools like tcpdump, strace, and gdb. I learned quite a bit during this process, and hopefully this troubleshooting process will help someone in the future.
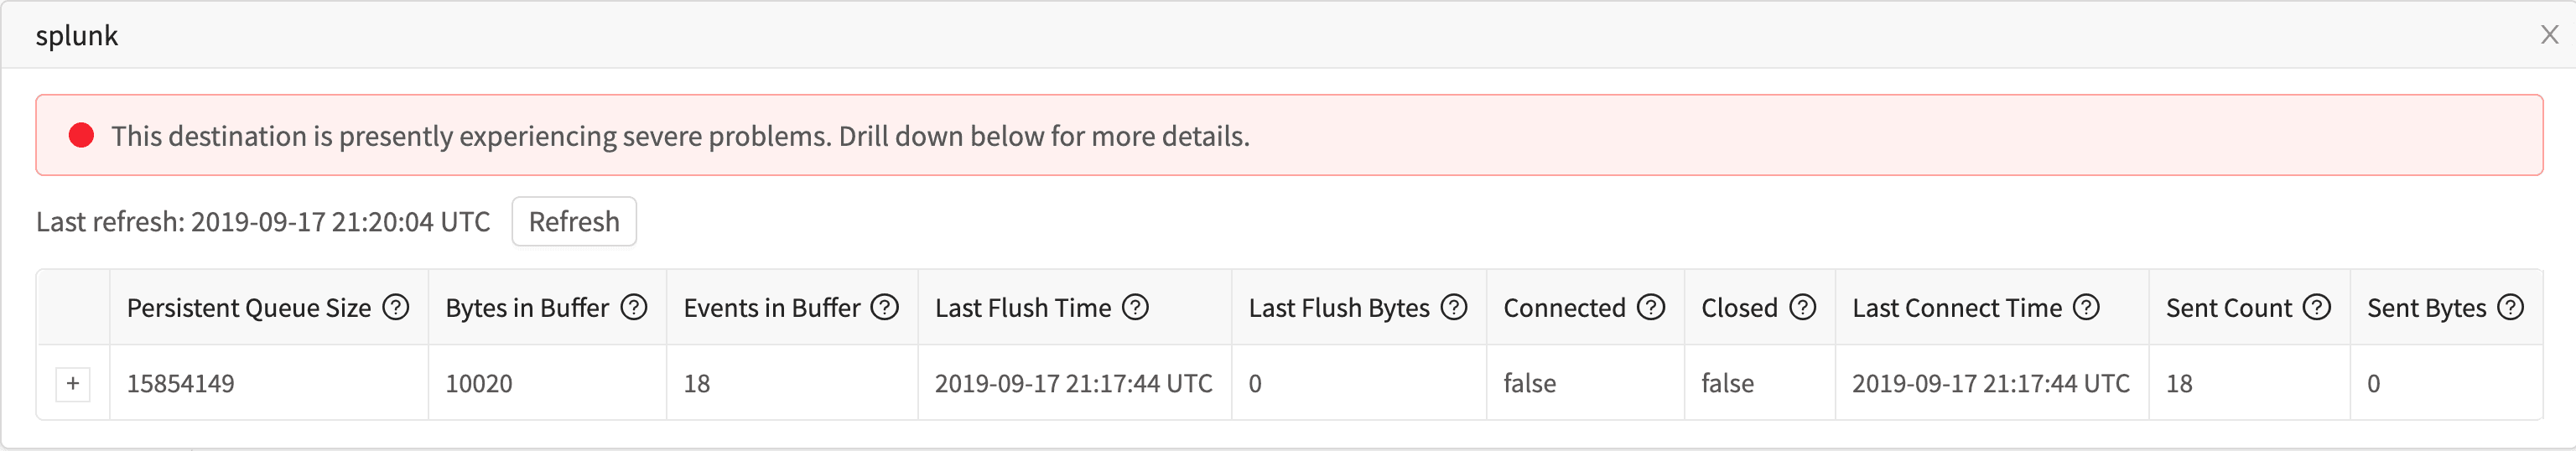
I maintain our docker based demo environment. I encourage you to check it out; it’s super easy to get up and running and it allows you to interact with Cribl LogStream in a real environment with Splunk, Elasticsearch, Kibana, Graphite, Grafana, Kafka, and more. Unfortunately, running all 6 of those systems on my laptop can sometimes be a bit taxing. Most of the time I’m just in LogStream, or maybe Splunk for some queries. To trim down the environment, I used the approach in this Stack Overflow answer to turn the other containers off, and then set our outputs to those destinations to drop on backpressure. This worked fine initially, but I noticed sometimes we couldn’t send data to Splunk and we’d start hitting the persistent queue.
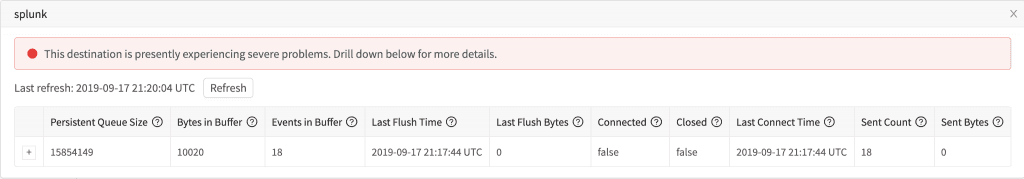
In Cribl’s UI, you can easily navigate to our internal logs. These logs also go out stdout in our Docker container, so I ran docker-compose logs cribl | grep splunk and saw us attempting to connect and failing:
{"time":"2019-09-17T21:21:02.226Z","channel":"output:splunk","level":"info","message":"attempting to connect"}
{"time":"2019-09-17T21:21:03.227Z","channel":"output:splunk","level":"warn","message":"sending is blocked","since":1568755066340,"elapsed":196887,"endpoint":{"host":"splunk","port":9997,"tls":false}}
{"time":"2019-09-17T21:21:05.227Z","channel":"output:splunk","level":"warn","message":"sending is blocked","since":1568755066340,"elapsed":198887,"endpoint":{"host":"splunk","port":9997,"tls":false}}
{"time":"2019-09-17T21:21:07.227Z","channel":"output:splunk","level":"error","message":"connection error","error":{"message":"connection timeout, dst=splunk:9997","stack":"Error: connection timeout, dst=splunk:9997\n    at Socket.<anonymous> (/opt/cribl/bin/cribl.js:12:373813)\n    at Socket.emit (events.js:198:13)\n    at Socket.EventEmitter.emit (domain.js:448:20)\n    at Socket._onTimeout (net.js:442:8)\n    at ontimeout (timers.js:436:11)\n    at tryOnTimeout (timers.js:300:5)\n    at listOnTimeout (timers.js:263:5)\n    at Timer.processTimers (timers.js:223:10)"}}
We’ve clearly timed out. At this point, I needed to start digging around in the container and see what was going on.
Interrogating the environment: host, nc, tcpdump
As Ledion will tell you, my favorite tool is tcpdump. It’s always my first goto tool, especially for this type of issue. First things first though, I needed to inspect the environment and try to reproduce the connectivity issue I was seeing from LogStream. I used docker-compose exec cribl bash to get a shell in the container. From my shell, I installed a bunch of CLI packages, then used host and nc to ensure I could actually connect to the host splunk which was configured.
apt-get update && apt-get install -y net-tools inetutils-ping lsof tcpdump netcat strace dnsutils

root@0f1f2b815321:/# host splunk
splunk has address 192.168.144.12

root@0f1f2b815321:/# nc splunk 9997
asdf
root@0f1f2b815321:/#
Note, on nc I’m just trying to validate it doesn’t timeout or get a connection reset. asdf is just me sending some input and having the remote side hang up because it’s not valid input for that port.
Next, I used tcpdump to see if we were trying to connect and why the connection wasn’t succeeding. But, I never saw LogStream even try to connect.
root@0f1f2b815321:/# tcpdump port 9997
tcpdump: verbose output suppressed, use -v or -vv for full protocol decode
listening on eth0, link-type EN10MB (Ethernet), capture size 262144 bytes
^C
0 packets captured
0 packets received by filter
0 packets dropped by kernel
My next step was perhaps DNS wasn’t resolving, even though it worked from host. I ran tcpdump again to look for DNS queries.
root@0f1f2b815321:/# tcpdump -tttt port 53
tcpdump: verbose output suppressed, use -v or -vv for full protocol decode
listening on eth0, link-type EN10MB (Ethernet), capture size 262144 bytes
2019-09-17 22:08:41.447362 IP 0f1f2b815321.46567 > ip-192-168-65-1.us-west-2.compute.internal.domain: 6387+ A? elasticsearch. (31)
2019-09-17 22:08:41.448535 IP 0f1f2b815321.42650 > ip-192-168-65-1.us-west-2.compute.internal.domain: 34028+ PTR? 1.65.168.192.in-addr.arpa. (43)
2019-09-17 22:08:41.487990 IP ip-192-168-65-1.us-west-2.compute.internal.domain > 0f1f2b815321.42650: 34028 1/0/0 PTR ip-192-168-65-1.us-west-2.compute.internal. (99)
2019-09-17 22:08:41.583949 IP 0f1f2b815321.34799 > ip-192-168-65-1.us-west-2.compute.internal.domain: 12064+ A? graphite. (26)
2019-09-17 22:08:46.588461 IP 0f1f2b815321.56956 > ip-192-168-65-1.us-west-2.compute.internal.domain: 12064+ A? graphite. (26)
2019-09-17 22:08:46.623660 IP 0f1f2b815321.40947 > ip-192-168-65-1.us-west-2.compute.internal.domain: 58456+ A? elasticsearch. (31)
2019-09-17 22:08:51.627423 IP 0f1f2b815321.51155 > ip-192-168-65-1.us-west-2.compute.internal.domain: 58456+ A? elasticsearch. (31)
2019-09-17 22:08:51.839217 IP 0f1f2b815321.55180 > ip-192-168-65-1.us-west-2.compute.internal.domain: 26796+ A? elasticsearch. (31)
2019-09-17 22:08:56.841580 IP 0f1f2b815321.36587 > ip-192-168-65-1.us-west-2.compute.internal.domain: 26796+ A? elasticsearch. (31)
2019-09-17 22:08:56.918732 IP 0f1f2b815321.43796 > ip-192-168-65-1.us-west-2.compute.internal.domain: 42488+ A? elasticsearch. (31)
2019-09-17 22:09:01.924076 IP 0f1f2b815321.45636 > ip-192-168-65-1.us-west-2.compute.internal.domain: 42488+ A? elasticsearch. (31)
2019-09-17 22:09:02.089549 IP 0f1f2b815321.32877 > ip-192-168-65-1.us-west-2.compute.internal.domain: 53533+ A? elasticsearch. (31)
2019-09-17 22:09:07.096617 IP 0f1f2b815321.60797 > ip-192-168-65-1.us-west-2.compute.internal.domain: 53533+ A? elasticsearch. (31)
2019-09-17 22:09:07.200726 IP 0f1f2b815321.38639 > ip-192-168-65-1.us-west-2.compute.internal.domain: 13457+ A? elasticsearch. (31)
2019-09-17 22:09:12.202478 IP 0f1f2b815321.49121 > ip-192-168-65-1.us-west-2.compute.internal.domain: 13457+ A? elasticsearch. (31)
2019-09-17 22:09:12.417174 IP 0f1f2b815321.49136 > ip-192-168-65-1.us-west-2.compute.internal.domain: 58907+ A? elasticsearch. (31)
^C
18 packets captured
18 packets received by filter
0 packets dropped by kernelI know we’re going to be trying to resolve elasticsearch and graphite and failing because I had disabled those containers. I also knew that without shutting down those containers it worked, so my next theory was that something might be breaking with name resolution that wasn’t happening on the wire. Recent versions of Linux have really changed the way name resolution works, and I was guessing perhaps it was happening over a unix socket or somewhere I couldn’t see.
Fun with strace
The best way I could think to see if something weird might be happening before the network would be to see if it was even trying to resolve the name or make the network connection through any mechanism. I ran strace against the running process. Note, from docker, this needs to be a privileged container to run strace. Another thing to note, the -f flag to strace is super important, as Node.js spawns new threads, called Light Weight Processes or LWP in strace and gdb, to handle DNS resolution and without strace -f then it won’t by default follow new threads or processes. (I had never heard of a Light Weight Process or that threads actually get a pid you don’t see from ps).
root@0f1f2b815321:/# strace -f -p 6 -e connect > strace.log 2>&1
^C
root@0f1f2b815321:/# grep splunk strace.log
root@0f1f2b815321:/# grep 9997 strace.log
root@0f1f2b815321:/# cat strace.log | sort | uniq -c
...
      1 [pid    13] connect(41, {sa_family=AF_INET, sin_port=htons(53), sin_addr=inet_addr("127.0.0.11")}, 16) = 0
...
      2 [pid 14] connect(42, {sa_family=AF_INET, sin_port=htons(53), sin_addr=inet_addr("127.0.0.11")}, 16) = 0
...
      6 [pid    14] connect(32, {sa_family=AF_UNIX, sun_path="/var/run/nscd/socket"}, 110) = -1 ENOENT (No such file or directory)
      7 [pid    14] connect(41, {sa_family=AF_INET, sin_port=htons(0), sin_addr=inet_addr("127.0.0.1")}, 16) = 0
      1 [pid    14] connect(41, {sa_family=AF_UNIX, sun_path="/var/run/nscd/socket"}, 110) = -1 ENOENT (No such file or directory)
   1431 [pid    14] connect(42, {sa_family=AF_INET, sin_port=htons(0), sin_addr=inet_addr("127.0.0.1")}, 16) = 0

     14 [pid    14] connect(42, {sa_family=AF_UNIX, sun_path="/var/run/nscd/socket"}, 110) = -1 ENOENT (No such file or directory)
    235 [pid    14] connect(46, {sa_family=AF_INET, sin_port=htons(0), sin_addr=inet_addr("127.0.0.1")}, 16) = 0
      2 [pid    14] connect(46, {sa_family=AF_UNIX, sun_path="/var/run/nscd/socket"}, 110) = -1 ENOENT (No such file or directory)
    413 [pid    14] connect(47, {sa_family=AF_INET, sin_port=htons(0), sin_addr=inet_addr("127.0.0.1")}, 16) = 0
      4 [pid    14] connect(47, {sa_family=AF_UNIX, sun_path="/var/run/nscd/socket"}, 110) = -1 ENOENT (No such file or directory)
    453 [pid    14] connect(48, {sa_family=AF_INET, sin_port=htons(0), sin_addr=inet_addr("127.0.0.1")}, 16) = 0
      4 [pid    14] connect(48, {sa_family=AF_UNIX, sun_path="/var/run/nscd/socket"}, 110) = -1 ENOENT (No such file or directory)
     67 [pid    14] connect(51, {sa_family=AF_INET, sin_port=htons(0), sin_addr=inet_addr("127.0.0.1")}, 16) = 0
      1 [pid    14] connect(51, {sa_family=AF_UNIX, sun_path="/var/run/nscd/socket"}, 110) = -1 ENOENT (No such file or directory)
...I piped the output of strace -f -p 6 -e connect to a log, where I grep for splunk and 9997 which shows me it’s not connecting at all. Lastly, I took the output of strace and piped it through sort and uniq -c to get a view on popular messages in the file. I can see from the output that we are connecting to 127.0.0.11 on port 53, which matches with my tcpdump. (Note: I also learned DNS gets proxied locally to systemd-resolved. Someone please convince me modern Linux isn’t NT 4.0). I see some unix socket stuff failing to /var/run/nscd/socket, which is super interesting but not particularly relevant.
What’s most interesting in this output, is that one LWP, pid 13, and another, pid 14, are the only things connecting on port 53 and there aren’t particularly many of these queries. However, I didn’t learn particularly much from strace. At this point, I was pretty stumped, so I reached out Ledion, who advised that I try to see what Node.js was doing in gdb.
gdb is super cool
I have not historically spent much time in gdb. Most languages I have spent much time in have poor debuggers (JavaScript/Typescript being the exceptions). But, nothing compares to gdb. I’ve used it a lot in the last few weeks helping our engineers diagnose problems in my test environments. In this case, the use case is pretty simple for gdb, can we just poke into a stack trace of every running thread in Node.js to see what’s doing? In gdb, I attached to the running process and then ran thread apply all backtrace. The command is pretty straightforward to read. It’s telling gdb to run backtrace against all threads.
root@0f1f2b815321:/# gdb -p 6
GNU gdb (Ubuntu 8.1-0ubuntu3) 8.1.0.20180409-git
Copyright (C) 2018 Free Software Foundation, Inc.
License GPLv3+: GNU GPL version 3 or later <http://gnu.org/licenses/gpl.html>
This is free software: you are free to change and redistribute it.
There is NO WARRANTY, to the extent permitted by law.  Type "show copying"
and "show warranty" for details.
This GDB was configured as "x86_64-linux-gnu".
Type "show configuration" for configuration details.
For bug reporting instructions, please see:
<http://www.gnu.org/software/gdb/bugs/>.
Find the GDB manual and other documentation resources online at:
<http://www.gnu.org/software/gdb/documentation/>.
For help, type "help".
Type "apropos word" to search for commands related to "word".
Attaching to process 6
[New LWP 7]
[New LWP 8]
[New LWP 9]
[New LWP 10]
[New LWP 11]
[New LWP 12]
[New LWP 13]
[New LWP 14]
[New LWP 15]
[New LWP 16]
[New LWP 32]
[Thread debugging using libthread_db enabled]
Using host libthread_db library "/lib/x86_64-linux-gnu/libthread_db.so.1".
0x00007ffccadbdd61 in gettimeofday ()
(gdb) thread apply all bt

Thread 10 (Thread 0x7f4cd17fa700 (LWP 15)):
#0  0x00007f4cd9aafbf9 in __GI___poll (fds=fds@entry=0x7f4cd17f8038, nfds=nfds@entry=1, timeout=5000, timeout@entry=<error reading variable: That operation is not available on integers of more than 8 bytes.>)
    at ../sysdeps/unix/sysv/linux/poll.c:29
#1  0x00007f4cd05e7bf8 in send_dg (ansp2_malloced=0x0, resplen2=0x0, anssizp2=0x0, ansp2=0x0, anscp=0x7f4cd17f90e8, gotsomewhere=<synthetic pointer>, v_circuit=<synthetic pointer>, ns=0, terrno=0x7f4cd17f8018, anssizp=0x7f4cd17f8150,
    ansp=0x7f4cd17f8008, buflen2=0, buf2=0x0, buflen=31, buf=0x7f4cd17f8180 "d\212\001", statp=<optimized out>) at res_send.c:1110
#2  __res_context_send (ctx=ctx@entry=0x7f4cc0009ec0, buf=buf@entry=0x7f4cd17f8180 "d\212\001", buflen=buflen@entry=31, buf2=buf2@entry=0x0, buflen2=buflen2@entry=0, ans=<optimized out>, ans@entry=0x7f4cd17f8c90 "0\217\177\320L\177",
    anssiz=<optimized out>, ansp=<optimized out>, ansp2=<optimized out>, nansp2=<optimized out>, resplen2=<optimized out>, ansp2_malloced=<optimized out>) at res_send.c:517
#3  0x00007f4cd05e54d1 in __GI___res_context_query (ctx=ctx@entry=0x7f4cc0009ec0, name=name@entry=0x48f4530 "elasticsearch", class=class@entry=1, type=type@entry=1, answer=answer@entry=0x7f4cd17f8c90 "0\217\177\320L\177",
    anslen=anslen@entry=1024, answerp=0x7f4cd17f90e8, answerp2=0x0, nanswerp2=0x0, resplen2=0x0, answerp2_malloced=0x0) at res_query.c:216
#4  0x00007f4cd05e628d in __res_context_querydomain (domain=0x0, answerp2_malloced=0x0, resplen2=0x0, nanswerp2=0x0, answerp2=0x0, answerp=0x7f4cd17f90e8, anslen=1024, answer=0x7f4cd17f8c90 "0\217\177\320L\177", type=1, class=1,
    name=0x48f4530 "elasticsearch", ctx=0x7f4cc0009ec0) at res_query.c:601
#5  __GI___res_context_search (ctx=ctx@entry=0x7f4cc0009ec0, name=name@entry=0x48f4530 "elasticsearch", class=class@entry=1, type=type@entry=1, answer=answer@entry=0x7f4cd17f8c90 "0\217\177\320L\177", anslen=anslen@entry=1024,
    answerp=0x7f4cd17f90e8, answerp2=0x0, nanswerp2=0x0, resplen2=0x0, answerp2_malloced=0x0) at res_query.c:370
#6  0x00007f4cd8173f0c in gethostbyname3_context (ctx=ctx@entry=0x7f4cc0009ec0, name=name@entry=0x48f4530 "elasticsearch", af=af@entry=2, result=result@entry=0x7f4cd17f97c0, buffer=buffer@entry=0x7f4cd17f9a30 "\300\250\220\b",
    buflen=buflen@entry=1024, errnop=0x7f4cd17fa658, h_errnop=0x7f4cd17fa6bc, ttlp=0x0, canonp=0x0) at nss_dns/dns-host.c:218
#7  0x00007f4cd8174928 in _nss_dns_gethostbyname3_r (name=0x48f4530 "elasticsearch", af=2, result=0x7f4cd17f97c0, buffer=0x7f4cd17f9a30 "\300\250\220\b", buflen=1024, errnop=0x7f4cd17fa658, h_errnop=0x7f4cd17fa6bc, ttlp=0x0, canonp=0x0)
    at nss_dns/dns-host.c:164
#8  0x00007f4cd8174981 in _nss_dns_gethostbyname2_r (name=<optimized out>, af=<optimized out>, result=<optimized out>, buffer=<optimized out>, buflen=<optimized out>, errnop=<optimized out>, h_errnop=0x7f4cd17fa6bc)
    at nss_dns/dns-host.c:282
#9  0x00007f4cd9ad0e3d in __gethostbyname2_r (name=name@entry=0x48f4530 "elasticsearch", af=af@entry=2, resbuf=resbuf@entry=0x7f4cd17f97c0, buffer=<optimized out>, buflen=1024, result=result@entry=0x7f4cd17f97b8, h_errnop=0x7f4cd17fa6bc)
    at ../nss/getXXbyYY_r.c:315
#10 0x00007f4cd9aa1054 in gaih_inet (name=name@entry=0x48f4530 "elasticsearch", service=<optimized out>, req=req@entry=0x7f4cd17f99f0, pai=pai@entry=0x7f4cd17f99b8, naddrs=naddrs@entry=0x7f4cd17f99b4, tmpbuf=tmpbuf@entry=0x7f4cd17f9a20)
    at ../sysdeps/posix/getaddrinfo.c:591
#11 0x00007f4cd9aa2ce4 in __GI_getaddrinfo (name=<optimized out>, service=<optimized out>, hints=0x7f4cd17f99f0, pai=0x4eb8ff8) at ../sysdeps/posix/getaddrinfo.c:2300
#12 0x00007f4cdad0cb3d in getaddrinfo (node=0x48f4530 "elasticsearch", service=0x0, hints=0x48f4500, res=0x4eb8ff8) at src/wrap.c:3458
#13 0x0000000000a876a1 in uv__getaddrinfo_work (w=0x4eb8fb0) at ../deps/uv/src/unix/getaddrinfo.c:106
#14 0x0000000000a7ba7e in worker (arg=0x0) at ../deps/uv/src/threadpool.c:122
#15 0x00007f4cd9d936db in start_thread (arg=0x7f4cd17fa700) at pthread_create.c:463
#16 0x00007f4cd9abc88f in clone () at ../sysdeps/unix/sysv/linux/x86_64/clone.S:95

Thread 9 (Thread 0x7f4cd1ffb700 (LWP 14)):
#0  0x00007f4cd9aafbf9 in __GI___poll (fds=fds@entry=0x7f4cd1ff9038, nfds=nfds@entry=1, timeout=5000, timeout@entry=<error reading variable: That operation is not available on integers of more than 8 bytes.>)
    at ../sysdeps/unix/sysv/linux/poll.c:29
#1  0x00007f4cd05e7bf8 in send_dg (ansp2_malloced=0x0, resplen2=0x0, anssizp2=0x0, ansp2=0x0, anscp=0x7f4cd1ffa0e8, gotsomewhere=<synthetic pointer>, v_circuit=<synthetic pointer>, ns=0, terrno=0x7f4cd1ff9018, anssizp=0x7f4cd1ff9150,
    ansp=0x7f4cd1ff9008, buflen2=0, buf2=0x0, buflen=31, buf=0x7f4cd1ff9180 "\210\305\001", statp=<optimized out>) at res_send.c:1110
#2  __res_context_send (ctx=ctx@entry=0x7f4cb8009b40, buf=buf@entry=0x7f4cd1ff9180 "\210\305\001", buflen=buflen@entry=31, buf2=buf2@entry=0x0, buflen2=buflen2@entry=0, ans=<optimized out>, ans@entry=0x7f4cd1ff9c90 "0\237\377\320L\177",
    anssiz=<optimized out>, ansp=<optimized out>, ansp2=<optimized out>, nansp2=<optimized out>, resplen2=<optimized out>, ansp2_malloced=<optimized out>) at res_send.c:517
#3  0x00007f4cd05e54d1 in __GI___res_context_query (ctx=ctx@entry=0x7f4cb8009b40, name=name@entry=0x9a14290 "elasticsearch", class=class@entry=1, type=type@entry=1, answer=answer@entry=0x7f4cd1ff9c90 "0\237\377\320L\177",
    anslen=anslen@entry=1024, answerp=0x7f4cd1ffa0e8, answerp2=0x0, nanswerp2=0x0, resplen2=0x0, answerp2_malloced=0x0) at res_query.c:216
#4  0x00007f4cd05e628d in __res_context_querydomain (domain=0x0, answerp2_malloced=0x0, resplen2=0x0, nanswerp2=0x0, answerp2=0x0, answerp=0x7f4cd1ffa0e8, anslen=1024, answer=0x7f4cd1ff9c90 "0\237\377\320L\177", type=1, class=1,
    name=0x9a14290 "elasticsearch", ctx=0x7f4cb8009b40) at res_query.c:601
#5  __GI___res_context_search (ctx=ctx@entry=0x7f4cb8009b40, name=name@entry=0x9a14290 "elasticsearch", class=class@entry=1, type=type@entry=1, answer=answer@entry=0x7f4cd1ff9c90 "0\237\377\320L\177", anslen=anslen@entry=1024,
    answerp=0x7f4cd1ffa0e8, answerp2=0x0, nanswerp2=0x0, resplen2=0x0, answerp2_malloced=0x0) at res_query.c:370
#6  0x00007f4cd8173f0c in gethostbyname3_context (ctx=ctx@entry=0x7f4cb8009b40, name=name@entry=0x9a14290 "elasticsearch", af=af@entry=2, result=result@entry=0x7f4cd1ffa7c0, buffer=buffer@entry=0x7f4cd1ffaa30 "\300\250\220\b",
    buflen=buflen@entry=1024, errnop=0x7f4cd1ffb658, h_errnop=0x7f4cd1ffb6bc, ttlp=0x0, canonp=0x0) at nss_dns/dns-host.c:218
#7  0x00007f4cd8174928 in _nss_dns_gethostbyname3_r (name=0x9a14290 "elasticsearch", af=2, result=0x7f4cd1ffa7c0, buffer=0x7f4cd1ffaa30 "\300\250\220\b", buflen=1024, errnop=0x7f4cd1ffb658, h_errnop=0x7f4cd1ffb6bc, ttlp=0x0, canonp=0x0)
    at nss_dns/dns-host.c:164
#8  0x00007f4cd8174981 in _nss_dns_gethostbyname2_r (name=<optimized out>, af=<optimized out>, result=<optimized out>, buffer=<optimized out>, buflen=<optimized out>, errnop=<optimized out>, h_errnop=0x7f4cd1ffb6bc)
---Type <return> to continue, or q <return> to quit---
    at nss_dns/dns-host.c:282
#9  0x00007f4cd9ad0e3d in __gethostbyname2_r (name=name@entry=0x9a14290 "elasticsearch", af=af@entry=2, resbuf=resbuf@entry=0x7f4cd1ffa7c0, buffer=<optimized out>, buflen=1024, result=result@entry=0x7f4cd1ffa7b8, h_errnop=0x7f4cd1ffb6bc)
    at ../nss/getXXbyYY_r.c:315
#10 0x00007f4cd9aa1054 in gaih_inet (name=name@entry=0x9a14290 "elasticsearch", service=<optimized out>, req=req@entry=0x7f4cd1ffa9f0, pai=pai@entry=0x7f4cd1ffa9b8, naddrs=naddrs@entry=0x7f4cd1ffa9b4, tmpbuf=tmpbuf@entry=0x7f4cd1ffaa20)
    at ../sysdeps/posix/getaddrinfo.c:591
#11 0x00007f4cd9aa2ce4 in __GI_getaddrinfo (name=<optimized out>, service=<optimized out>, hints=0x7f4cd1ffa9f0, pai=0x5c223c8) at ../sysdeps/posix/getaddrinfo.c:2300
#12 0x00007f4cdad0cb3d in getaddrinfo (node=0x9a14290 "elasticsearch", service=0x0, hints=0x9a14260, res=0x5c223c8) at src/wrap.c:3458
#13 0x0000000000a876a1 in uv__getaddrinfo_work (w=0x5c22380) at ../deps/uv/src/unix/getaddrinfo.c:106
#14 0x0000000000a7ba7e in worker (arg=0x0) at ../deps/uv/src/threadpool.c:122
#15 0x00007f4cd9d936db in start_thread (arg=0x7f4cd1ffb700) at pthread_create.c:463
#16 0x00007f4cd9abc88f in clone () at ../sysdeps/unix/sysv/linux/x86_64/clone.S:95
This produces quite a bit of output, but I’ve kept only the two threads that were particularly relevant. From this purview, it’s pretty easy to see what’s going on. Node has two threads looking up the name elasticsearch, which matches with what we saw with tcpdump. At this point, I started googling around trying to find why Node.js might timeout, when I stumbled on this StackOverflow post, which lead to this more important post on dns.lookup() versus dns.resolve*() .
Root cause and workaround
From my readings, root cause was pretty clear. Because I had shut down Elasticsearch and Graphite, attempting to connect to those destinations was exhausting the capacity of the thread pool waiting on DNS requests for those names. With this theory, I added some extra hosts to docker-compose.yml with fake RFC1918 IPs which allowed DNS to succeed but the connection attempts fail which resolved my issue. Key finding from this was to be careful in your Node.js application, as many connection attempts to names which will not resolve can easily starve connection attempts to legitimate working names.
I didn’t have time to look into Node.js and see what happens in the case of this congestion scenario with requests. Based on the evidence I saw, it will never attempt to connect properly to the hostname that will resolve, even after many minutes, so my guess is we are initiating so many connection attempts that the backlog never clears. It would be nice to know if they eventually drop requests out of the queue or what happens with backpressure.
For future versions of Cribl LogStream, we’ll make some changes how we resolve names to guard against this potential DoS scenario.