

The main purpose of load balancing is to prevent any single server from getting overloaded and possibly breaking down. In other words, load balancing improves service availability and helps prevent downtimes. This blog will talk about how Stream can load balance the data coming in and out of it.
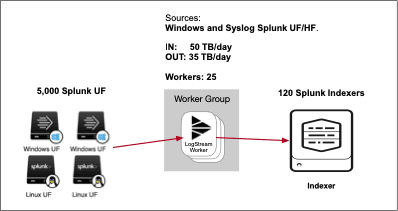
The example follows a real-world architecture in which we have the following configuration:
Input: 5,000 Splunk Universal Forwarders sending 50TB daily stream of data to Stream
Processing: 34 Worker Processes in each of our 25 Stream Worker Nodes with 36 vCPU each to process the data
Output: Stream does its data reduction, and the output is 35TB that we send to 120 Splunk Indexers
Load Balance In
Setup Load Balance among the Worker Nodes
First, we need to set up and Load Balanced the traffic coming from 5,000 Splunk UF to the 25 Worker Nodes. To do this, we were able to take advantage of Splunk UF’s built-in Load Balance.
What did the Configurations from Splunk Forwarder to Stream Worker Nodes Look Like?
Configuration example of Splunk Forwarder outputs.conf showing Load Balancing among Stream Worker Nodes: splunkforwarder/etc/system/local/outputs.conf:
[tcpout]
disabled = false
defaultGroup = cribl

[tcpout:cribl]
server = workernode1:9997, workernode2:9997, .., workernode25:9997
sendCookedData = true
negotiateProtocolLevel = 0
Load Balance Inside the Worker Nodes and Among the Worker Processes
For the next step, we load balance the traffic among the available 34 Worker Processes in each of our 25 Worker Nodes. Using the Stream sizing guide, we estimate 200GB per day for each Worker Processes. In our case, we needed to process 50TB per day incoming + 35TB per day outgoing. Therefore, we calculated that 14 nodes with 34 Worker Processes could handle the load. However, to count for the spike in load and to allow us to restart some of the workers with new configurations, we decided to increase our total number of nodes to 25.
How Does Load Balancing Inside Stream Work?
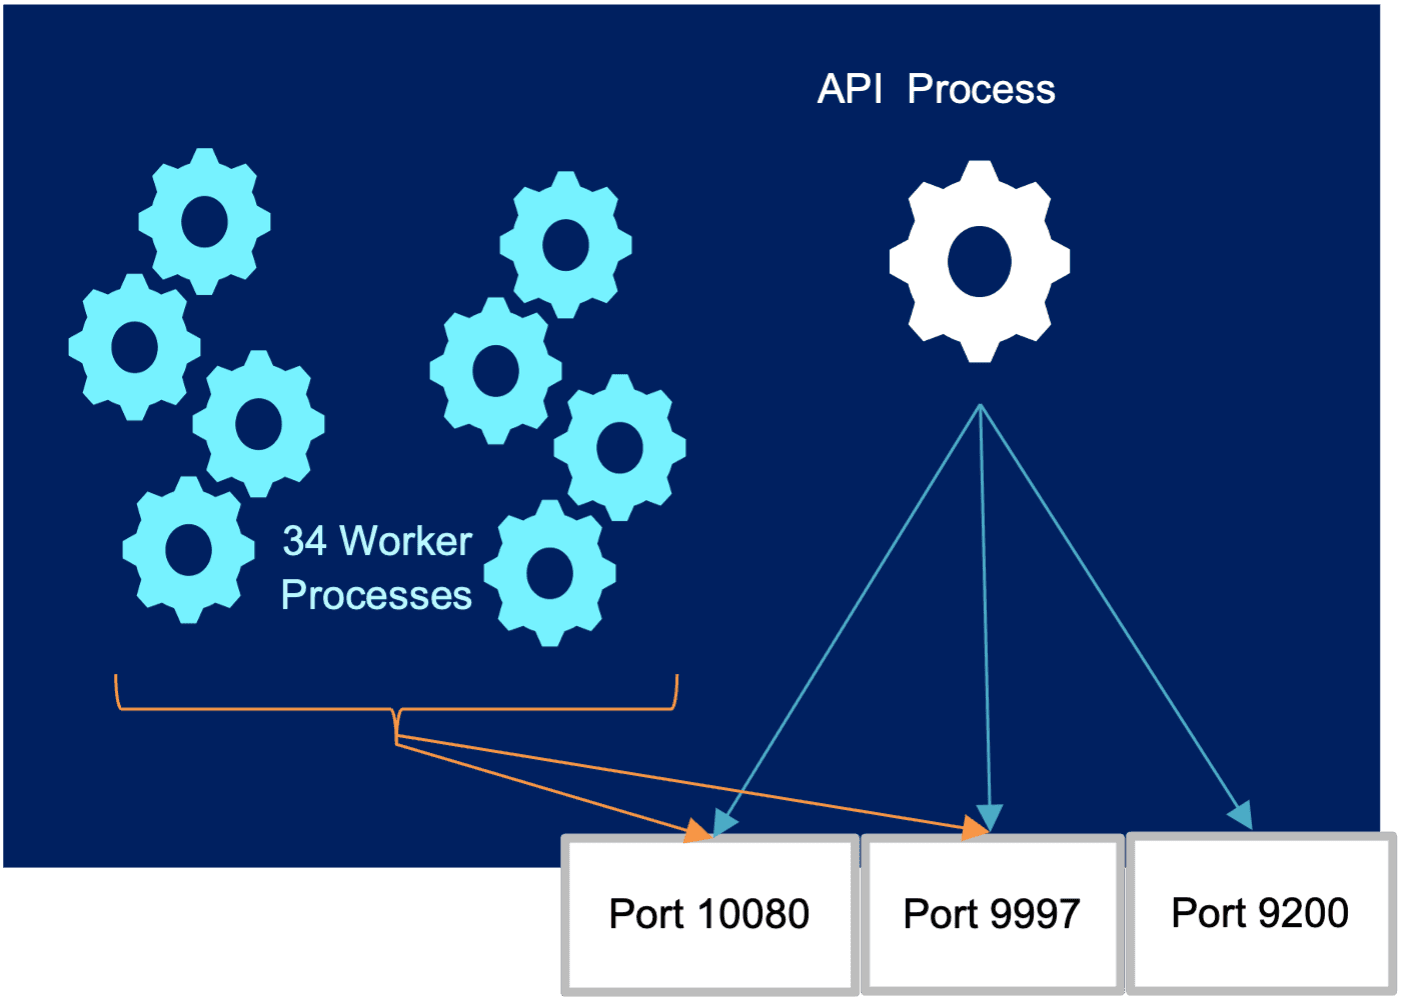
Under the hood, Stream uses the Node.JS Cluster Module. The worker processes are spawned and communicate with the parent API Process via IPC. As a Splunk UF sends a TCP connection to the Worker Node, the Worker Node parent API Process distributes the incoming connections to the Worker Processes.
The primary process (Stream API Process) listens to the configured ports (e.g. ports 9997, 9200, and 10080), accepts new connections, and distributes them across the workers. The first connection for a specific port is distributed in a round-robin fashion. Each additional connection for that specific port will be allocated to the next worker process in an incrementing fashion.
Example for port 9997: In our case, we have 34 Worker Processes in each one of our 25 Worker Nodes. The first connection for port 9997 will be allocated (as we mentioned) using a round-robin, for example, to Worker Process (WP) 17. Then, the next connection will be incremented and allocated to WP 18, then WP 19, etc. At that same time, if we get a new connection for port 10080, the first connection will be allocated, again using a round-robin, to WP 8, the next connection will be allocated to WP 9, then to 10, etc.
25 Worker Nodes, each with 34 Worker Processes.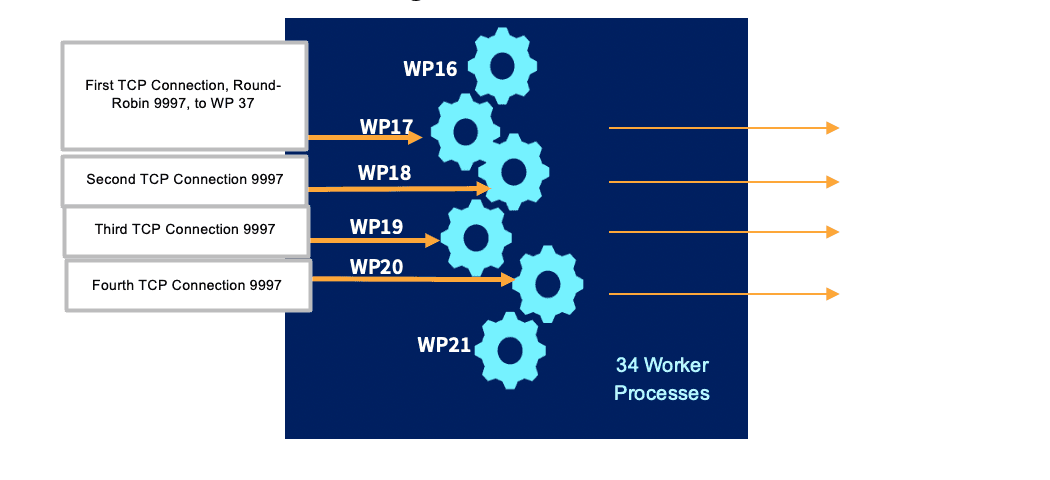
25 Worker Nodes, each with 34 Worker Processes Processing TCP Connections, Port 9997.How do we handle failed inbound connections?
The Worker Nodes and Worker Processes are stateless. Therefore, if one of them died, the Splunk Forwarder will be notified that the TCP connection died, and it will resubmit the request to the next available one. Furthermore, to increase the system’s resiliency, the leader process also acts as a watchdog for worker processes, restarting any that exit or crash.
Load Balance Out
For the third step, we load balanced the traffic from the 25 Worker Nodes and 34 Worker Processes in each Worker node among the available 120 Splunk Indexers.
How Do We Make Sure That the Load Is Distributed Evenly Among the Splunk Indexers?
Using Stream Destination Splunk Load Balance, Cribl Stream’s approach to Load Balancing is much better compared to the Splunk UF’s approach. Stream uses a combo of Time + Volume to make sure all indexers get an even distribution of load. Data is sent by all worker processes to all receivers simultaneously, and the amount sent to each receiver depends on these parameters:
Destination weight
Destination historical data. By default, historical data is tracked for 300s.
Stream uses this data to influence the traffic sent to each destination, to ensure that differences decay over time, and to verify that those total ratios converge towards configured weights. Over the subsequent intervals, the difference becomes exponentially less pronounced and eventually insignificant. Thus, the load gets balanced fairly.
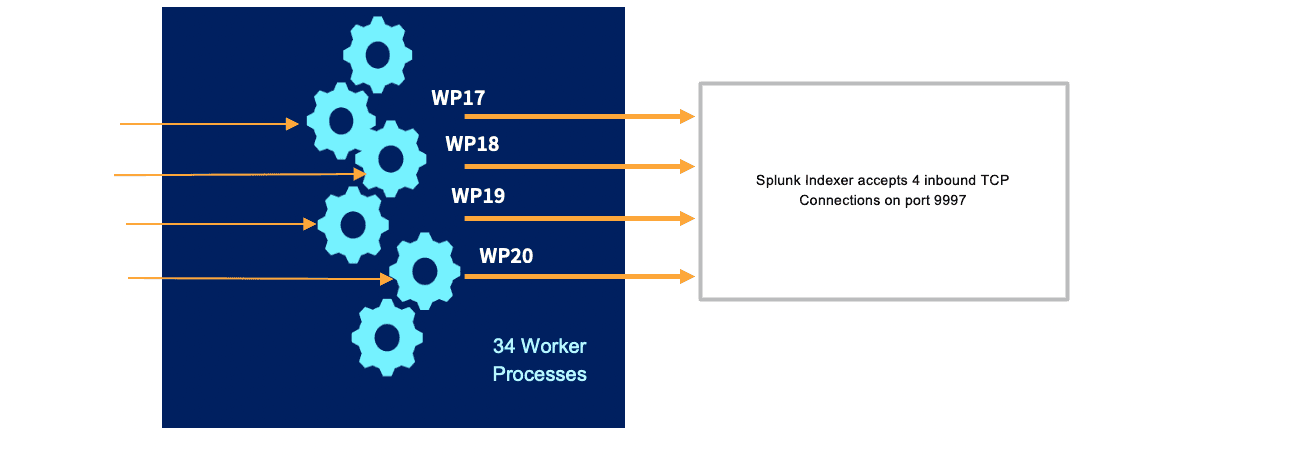
25 Worker Nodes, each with 34 Worker Processes Sending to 120 Splunk Indexers in ParallelIf at any given point, out of our available 34 Worker Processes, 4 Worker Processes are handling TCP traffic and configured with a Splunk output, then the Splunk Destination will see 4 inbound connections.
What did the Configurations to Splunk Indexers look like?
In our case, we used Splunk Indexer Discovery to obtain the 120 unique IPs. This option allows Stream to get the list of all the Splunk Indexer IPs from the Splunk Cluster Manager and it uses load balancing to forward to all Indexers in the list.
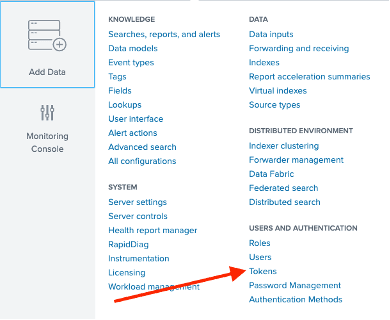
To configure this option, we first logged into Splunk Cluster Manager and generated a new Token. In Splunk, this option is available under Settings -> Tokens.
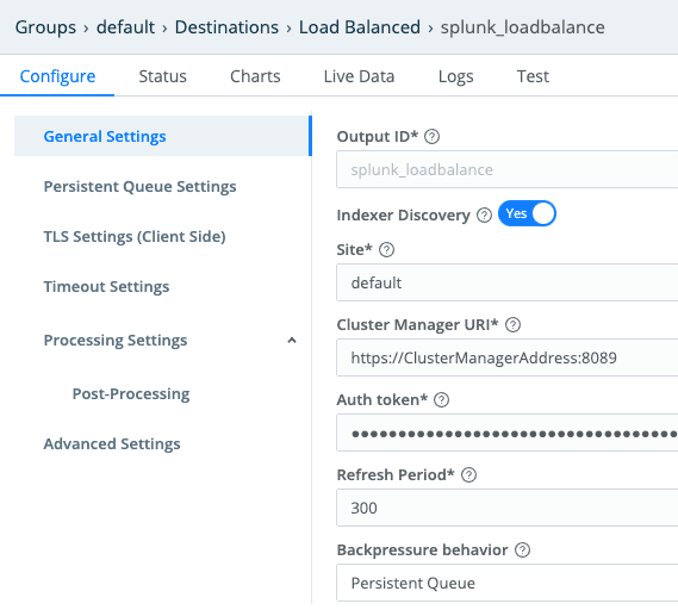
Once we generated the Splunk Token, in Stream Leader Node under Destinations we created a Splunk Load Balanced destination with these configurations:
Indexer Discover = Yes
Site = In our case we did not use indexer discovery in a multisite cluster. So, we left the site flag as default.
Cluster Manager URI
Auth token from Splunk
Backpressure behavior = Persistent Queue
How Do We Handle Failed Outbound Connections?
Stream’s persistent queuing (PQ) feature helps minimize data loss if a downstream receiver is unreachable. PQ provides durability by writing data to disk for the duration of the outage and forwarding it upon recovery. When a Splunk Indexer goes offline, Stream automatically gets the updated list of Splunk Indexers from the Splunk Cluster Manager node.
Summary
In this post, we showed how Stream can take advantage of Load Balancing end to end to prevent any single server from getting overloaded and possibly breaking down.
The example follows a real-world architecture in which we have 5,000 Splunk UF, sending a 50TB daily stream of data to 25 Cribl Stream Worker Nodes, and finally going to 120 Splunk Indexers. If you want to try out a free, hosted instance of Cribl Stream with canned data, check out the LogStream Sandbox.
The fastest way to get started with Cribl Stream is to sign-up at Cribl.Cloud. You can process up to 1 TB of throughput per day at no cost. Sign-up and start using Stream within a few minutes.