We’re extremely excited to announce the availability of Cribl Beta!
As mentioned in the other post, Cribl gives full access to the data in motion to lookup, enrich, redact, encrypt, transform, or sample data before indexing. This Beta release is focused on a tight integration with Splunk. It allows for net new, and previously prohibitive use cases; bringing in highly-sensitive events via flexible redaction/obfuscation, smart sampling of hugely voluminous data sources, and ease of adding index-time fields for super fast querying via tstats. With Cribl, Splunk admins are now in full control to make logs contextual, safe and optimized.
Get the Beta sandbox now!
What is in the sandbox?
The Beta experience is a complete, all-inclusive Splunk + Cribl system. It is all pre-configured and ready to work with out of the box. It also ships with a Splunk app, very creatively named Cribl Demo, which contains a walkthrough and various dashboards for each use-case.
How does Cribl Work?
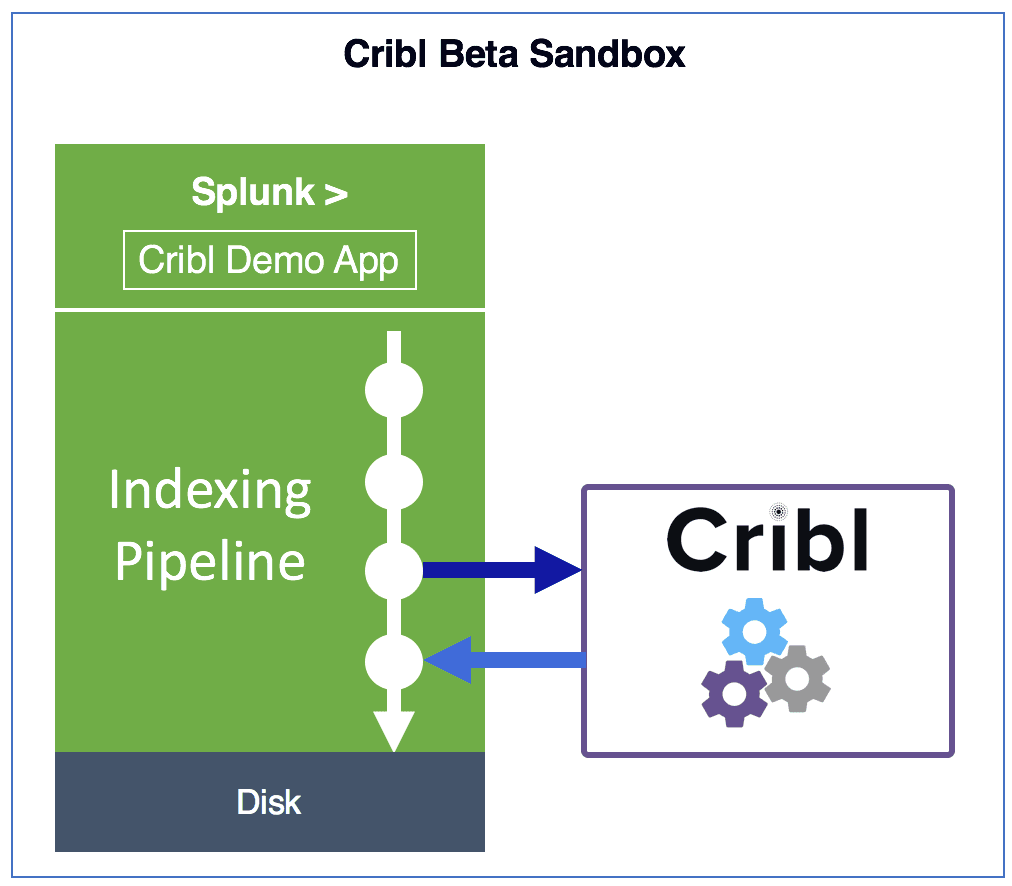
As events are received from a source*, such as Splunk, Cribl passes them through routes which match events to the appropriate processing pipelines. Pipelines are composed of of fully programmable functions that operate (transform, enrich, process etc.) on events inline as they travel though a pipeline. Upon exiting, events are sent back to Splunk* to continue their journey thru to the indexing processor. [*other sources & destinations are coming soon]
Routes: A route finds the right pipeline to send events to.
Pipelines: A pipeline is a series of functions executed in order.
Functions: A function is code that processes an event.
In the case of the Beta sandbox, data is generated in real-time by a generator that runs on the background.
Example use cases
There are various dashboards in the sandbox that encapsulate use-cases that the Beta covers, and more, including among others:
Smart PII Obfuscation
(Stratified Systematic) Sampling
Adding/Removing Index-time Fields
Hashing
Field-level Encryption (with role-based Decryption)
Index-time Lookups
Once you’re in the sandbox, begin your exploration via the default Start view.
How to work with Cribl
Cribl in the sandbox is accessible at :9000 with the same credentials that you used to authenticate in Splunk. There are several routes that are used to clone the data needed for the Cribl Demo App. All of them deliver data to a pipeline called Demo, which has over 10 functions that transform the incoming data in real-time. There is also a route called Main, connected to a main pipeline, which serves as a catchall for all events, and adds a index-time field: cribl::yes to all of them.
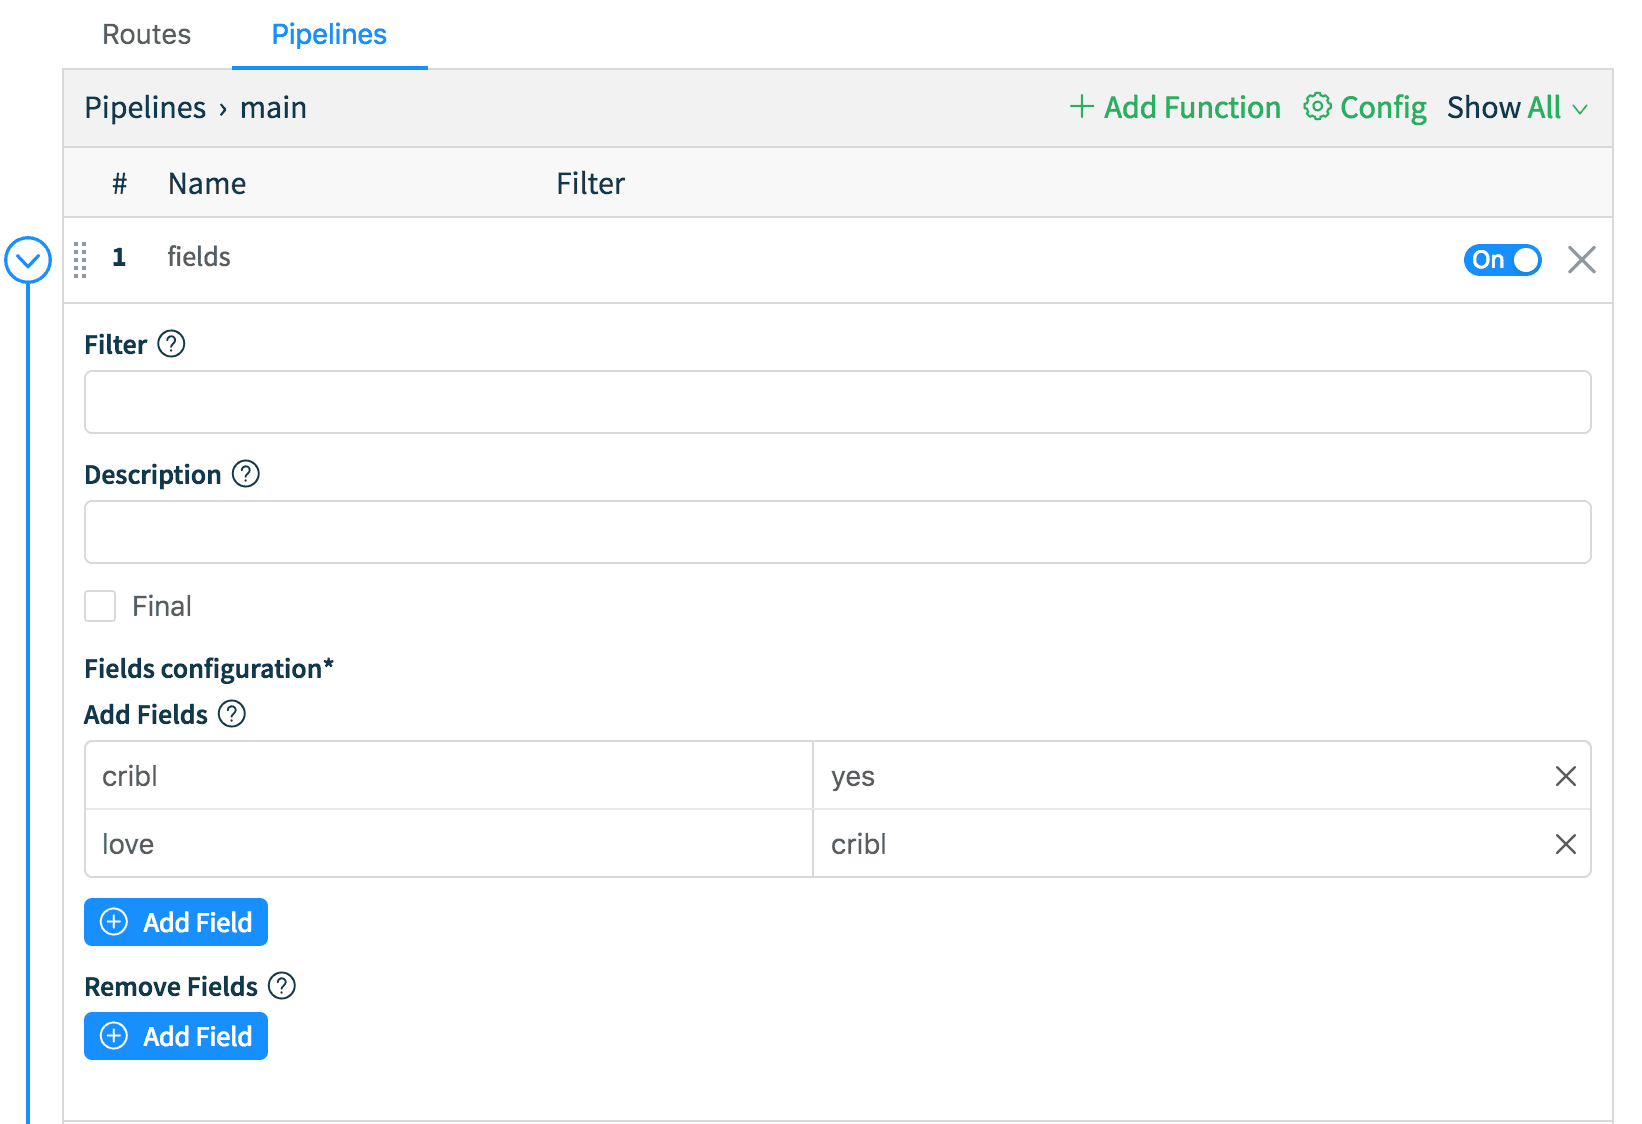
To better understand how flexible and useful Cribl is, let’s try to add an index-time field to all events. Let’s go to Pipelines tab, find main, and click on the Edit icon on the right. Next, expand the fields function, and in the Add Fields section let’s add a new kv pair. For example, key name love, key value cribl. Hit Save. Now, go back to the Splunk tab and run this search: index=cribl* earliest=0 love::cribl and notice that you see events immediately. Voilà!
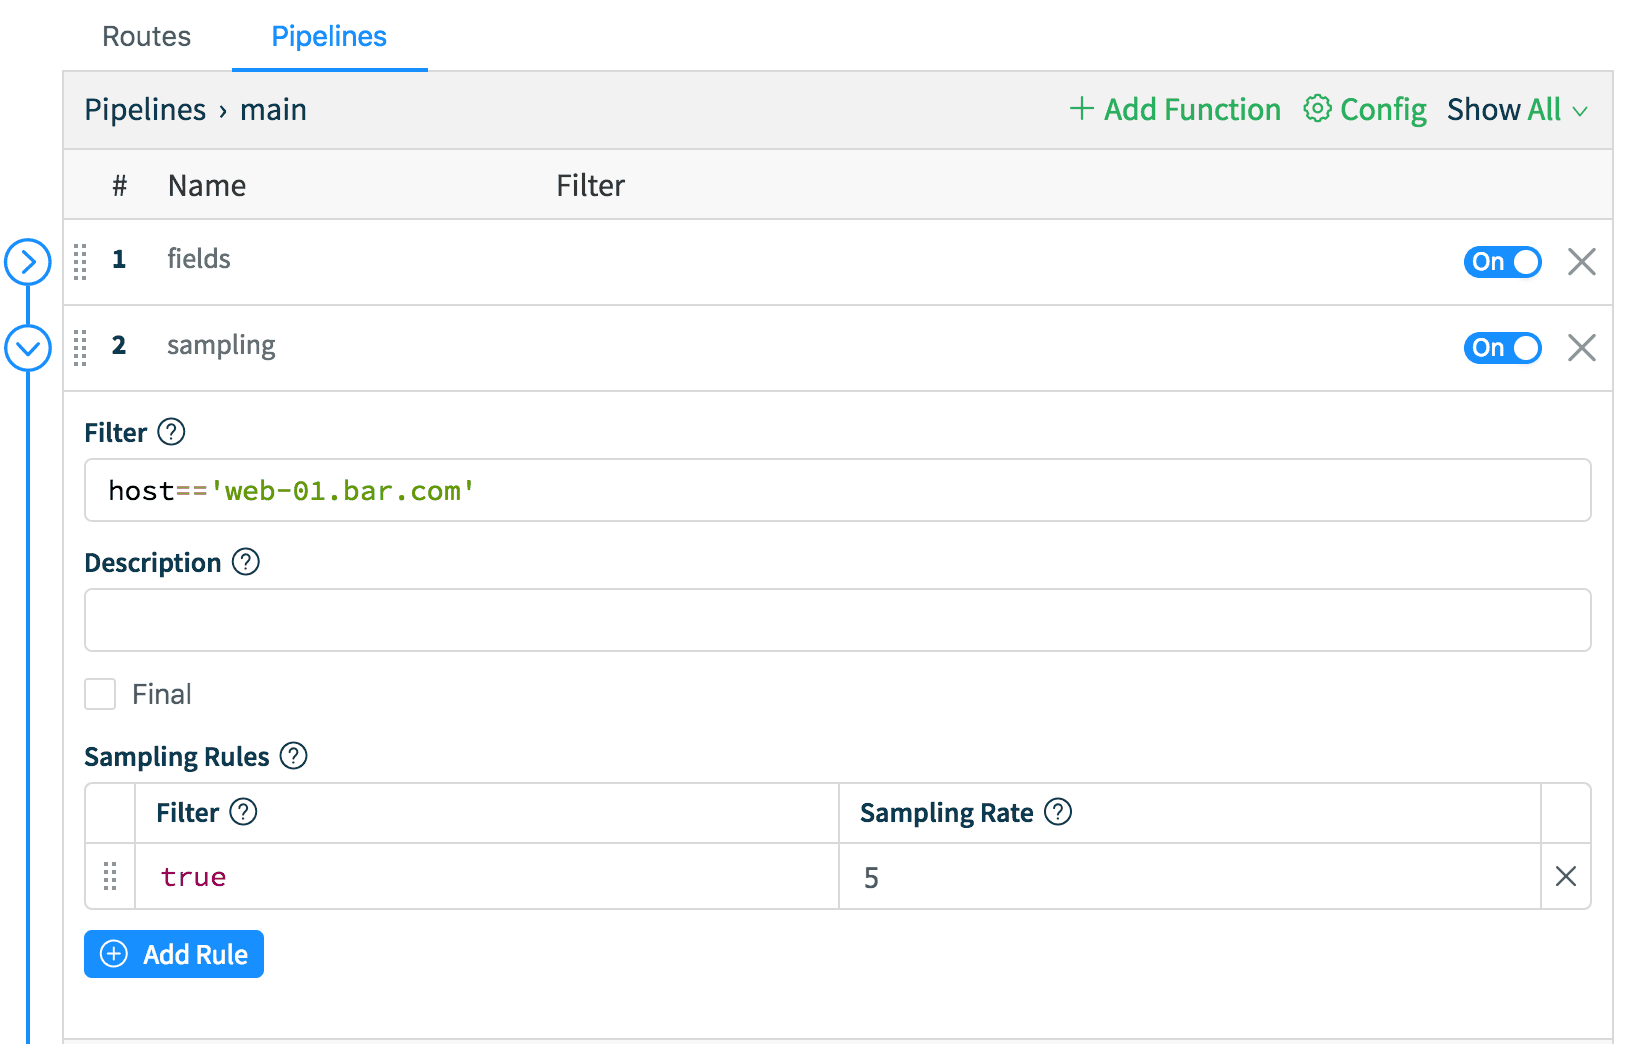
Let’s do another one – let’s sample all events from host web-01.bar.com at a rate of 5:1. While in the main pipeline, click Add Function and select Sampling. Let’s keep the conditions simple here; in Filter enter: host=='web-01.bar.com' and in the Sampling Rules section, enter true on the left (Filter) and 5 as the Sampling Rate. Back to Splunk tab run this search: index=cribl host=web* earliest=-15m | timechart count by host and notice the drop in event count for web-01.bar.com. Done – No restarts!
Now that you know how to modify pipelines, add functions and manipulate events in real-time, feel free to poke around and go to town – the sandbox is all yours! If you get stuck, please join us in Slack #cribl, or skim over Cribl Docs.
If you are excited about what we’re doing, or have any questions, please join us in Slack #cribl, tweet at us @cribl_io, or contact us via hello@cribl.io. We’d love to hear your feedback!
Enjoy it! — The Cribl Team!
Get the Beta sandbox now!

