Has this ever happened to you: ‘I have too many agents to help me collect data for processing into separate SIEMs. It’s a pain to make any changes to their configuration!’ Or perhaps this one: ‘I have a large kubernetes deployment, but I just can’t seem to get metrics and logs out of it and into my SIEM or TSDB!’ Fear not, weary administrators, Cribl Edge is here!
For more about the why and what, our CEO Clint Sharp wrote a great blog discussing the background behind Edge. What we’re here for is the nitty gritty. The How-To. The good stuff. The juicy – never mind.
Cribl Edge is an agent built for the modern era, and as such, enables you to:
Auto-discover log files, so you always know which ones need to be monitored and exactly where they are
Automagically gather both host and container metrics for shipping anywhere
Centrally manage hundreds of Edge nodes using the same style as Cribl Stream
Utilize a single-node UX for a fun troubleshooting experience (if you’re into that)
The Forest and the Trees: Auto-Discover Logs and Automatically Gather Host and Container Metrics
A lot of the current agent landscape is made up of config files and restarts. Cribl Edge allows for the same great experience found in Stream, allowing administrators to see and interact with data as they configure. No more ‘cross your fingers and restart’ when adding sources or destinations.
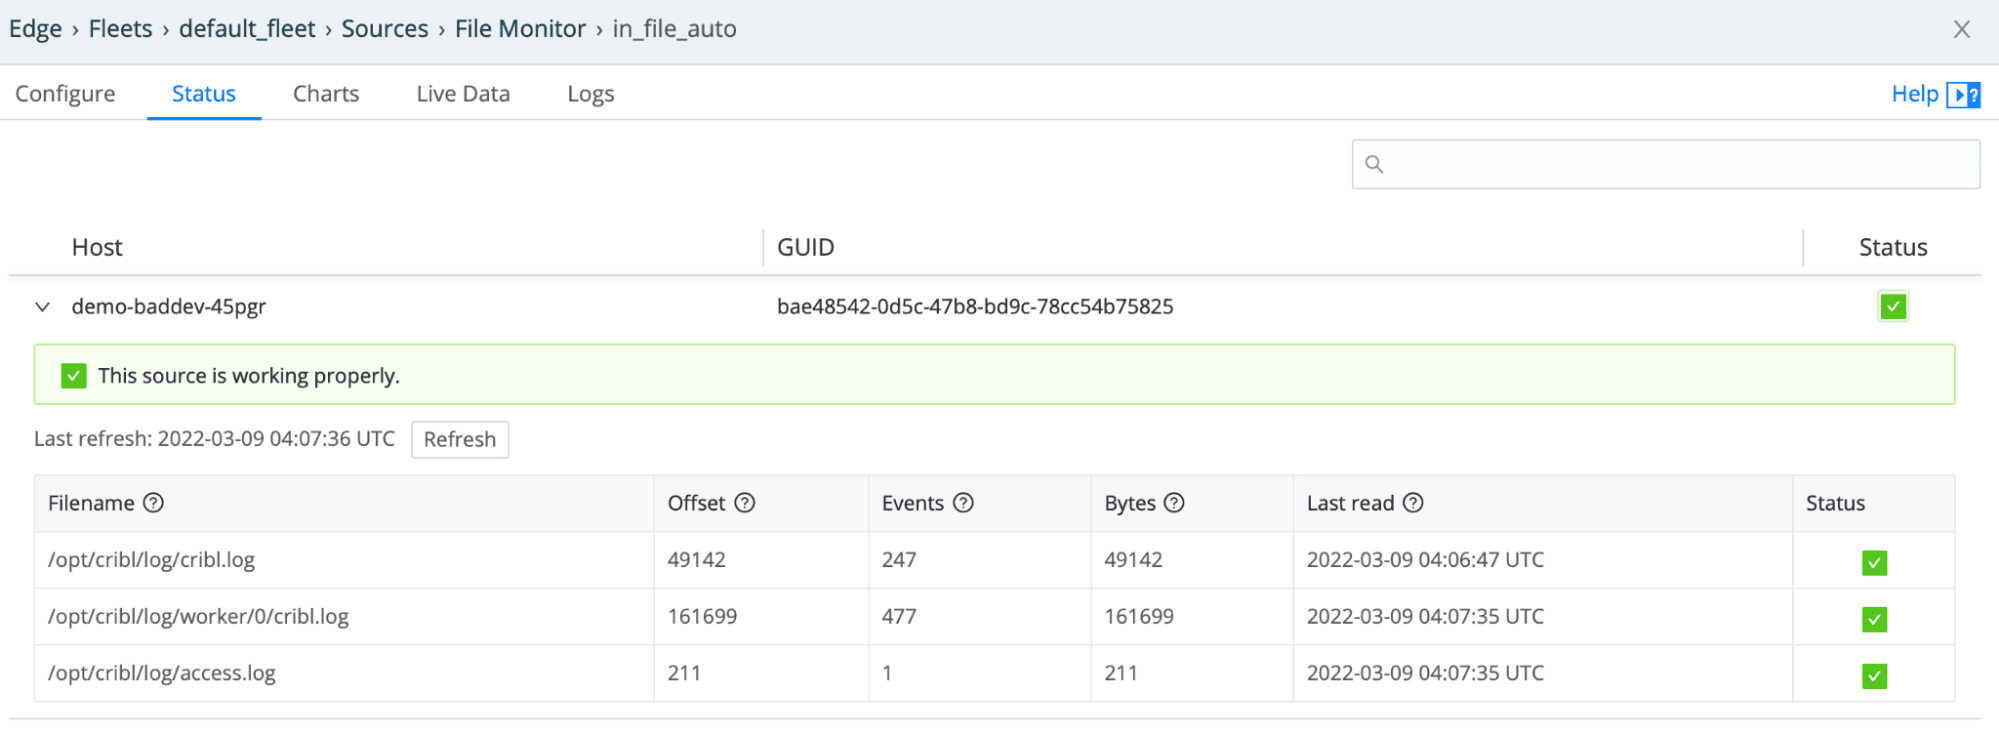
More than that, however, Edge automatically discovers log files used by running processes and tails them. You can stop guessing at what files need to be monitored. Or hoping that your developers documented the right location for that one log file keeping track of the specific error you’re looking for at three in the morning because the back-end went down 12 hours ago and people are breathing down your neck for a fix before they lose any more money. Oh wait, is that just me?
These files are monitored as part of the all-new Source added to Edge: File Monitor.
While we’re discussing new sources – Edge also comes with a System Metrics source. As the name implies, said source gathers metrics data from the current system AND container runtime (if Edge has been given access to the runtime socket). System metrics are also readily published in an Open Metrics format. This means they are ready to be ingested by analytics tools like Prometheus. However, since Edge runs on the Stream code stack – reformatting data is easy peasy (especially when there is a Pack for that).
By default, Edge has all system metrics enabled and basic container metrics. Utilizing QuickConnect, configuring these metrics to be shipped off is rather, well, quick!
Something Old, Something New: Management and Troubleshooting
Cribl Edge is managed and configured in the same style as Cribl Stream. This means management happens centrally in order to simplify your workflow. A minor difference is that groups of Edge nodes are not called ‘Worker Groups’ but rather ‘Fleets’. Besides that, they function the same: Create a fleet, bootstrap an Edge node, and off you pop.
The big difference between centralized Stream and Edge management, however, derives down to purpose: Edge was built to help discover data and troubleshoot interactively. Navigating to a specific node in a fleet exposes the running processes on said node. This comes with a plethora of information. See for yourself in the screenshots below.
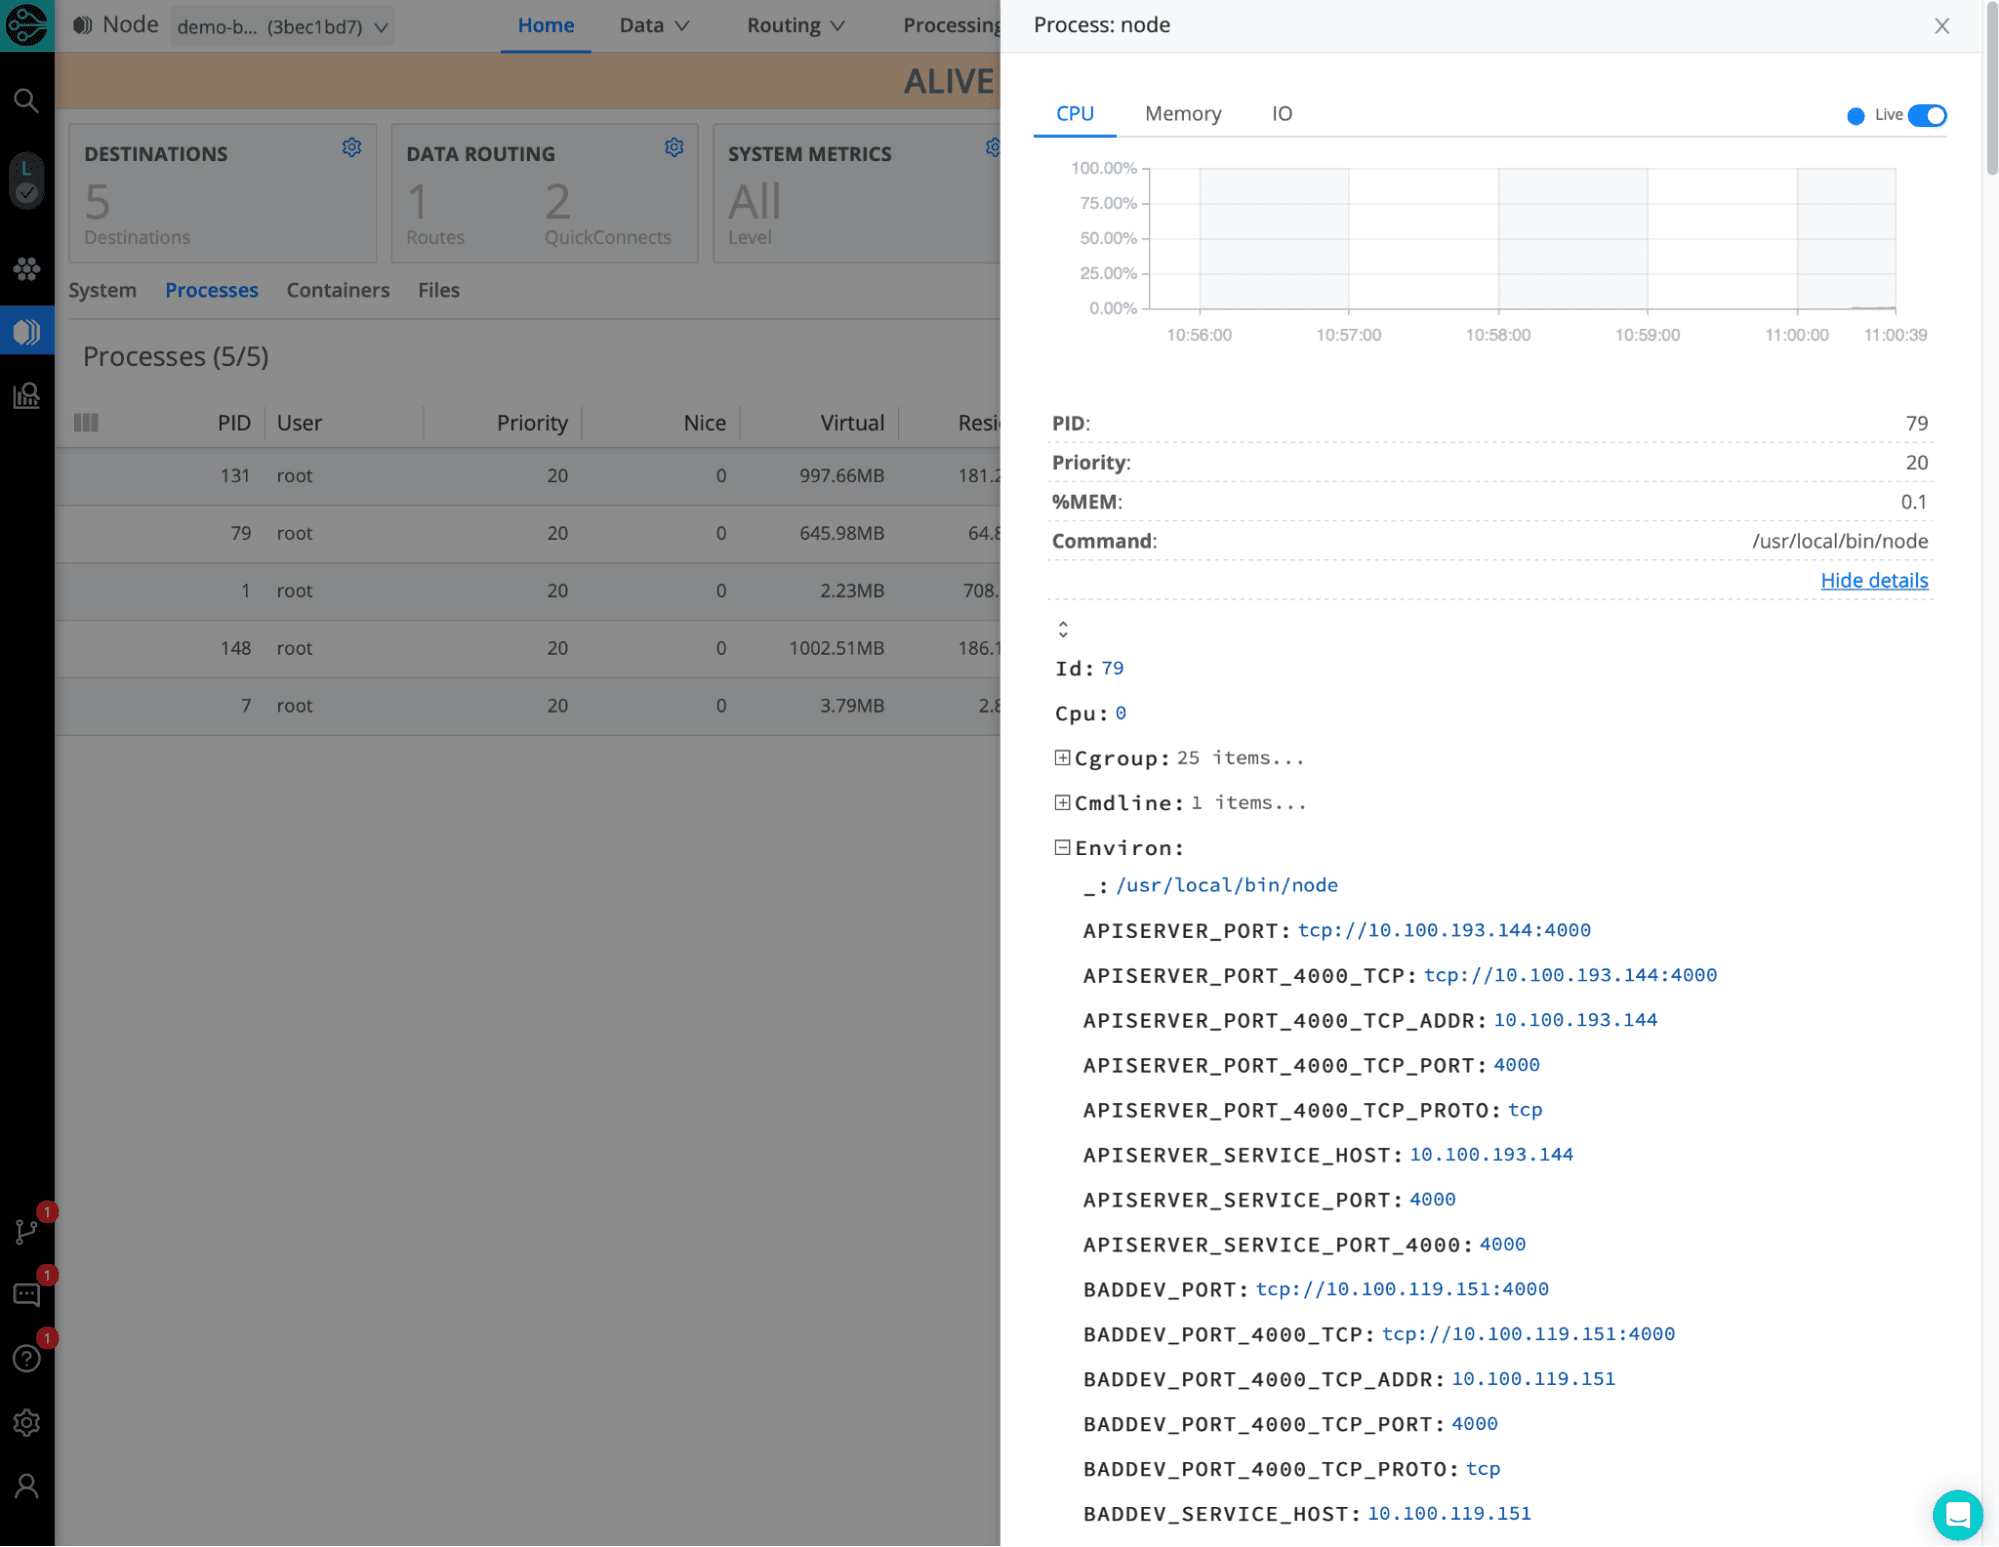
Ultimately, Edge will help administrators centrally troubleshoot issues at the edge. Ok that sentence sounded like marketing fluff, but hear me out – deploying a fleet will allow an administrator to log into one place and navigate to myriad edge nodes to gather information previously only available via shell access (and we all know how cumbersome that is).
In short, Cribl Edge not only brings the look and feel of Stream to the edge but also adds log discovery, metrics gathering, and centralized troubleshooting to the Cribl toolbox. Oh and by the way, the licensing model for Edge is the same as Stream – meaning it’s free up to 1TB/day! So go get your data at the edge and remember, nobody puts data in the corner.
The fastest way to get started with Cribl Stream and Cribl Edge is to try the free Cloud Sandboxes.


