With Aggregations in Cribl LogStream 1.6, you can send your logs directly to Cribl and shape, extract, filter, drop, and now, aggregate! This new, powerful capability allows users to easily transform logs into metrics while running real-time, tumbling window aggregate functions on them.
If you missed Part 1 on aggregation time bucketing, feel free to check it out!
Let’s take a deep dive into the memory optimization challenges we had to overcome in order to deliver a performant streaming aggregation tool.
Optimizing Memory
I like to think of myself as a fairly principled engineer, so I stand by the saying that premature optimization is the root of all evil, or what I always say, “you can’t optimize something that doesn’t exist.” So the first thing we needed to do was actually have a functioning aggregations system even if that meant it used insane amounts of memory.
Step 1: Functional…but not quite functional
We started off with the basics and ignored group-bys initially because whatever we built should be built in a way that could be easily extrapolated/abstracted to fit the group-by case.
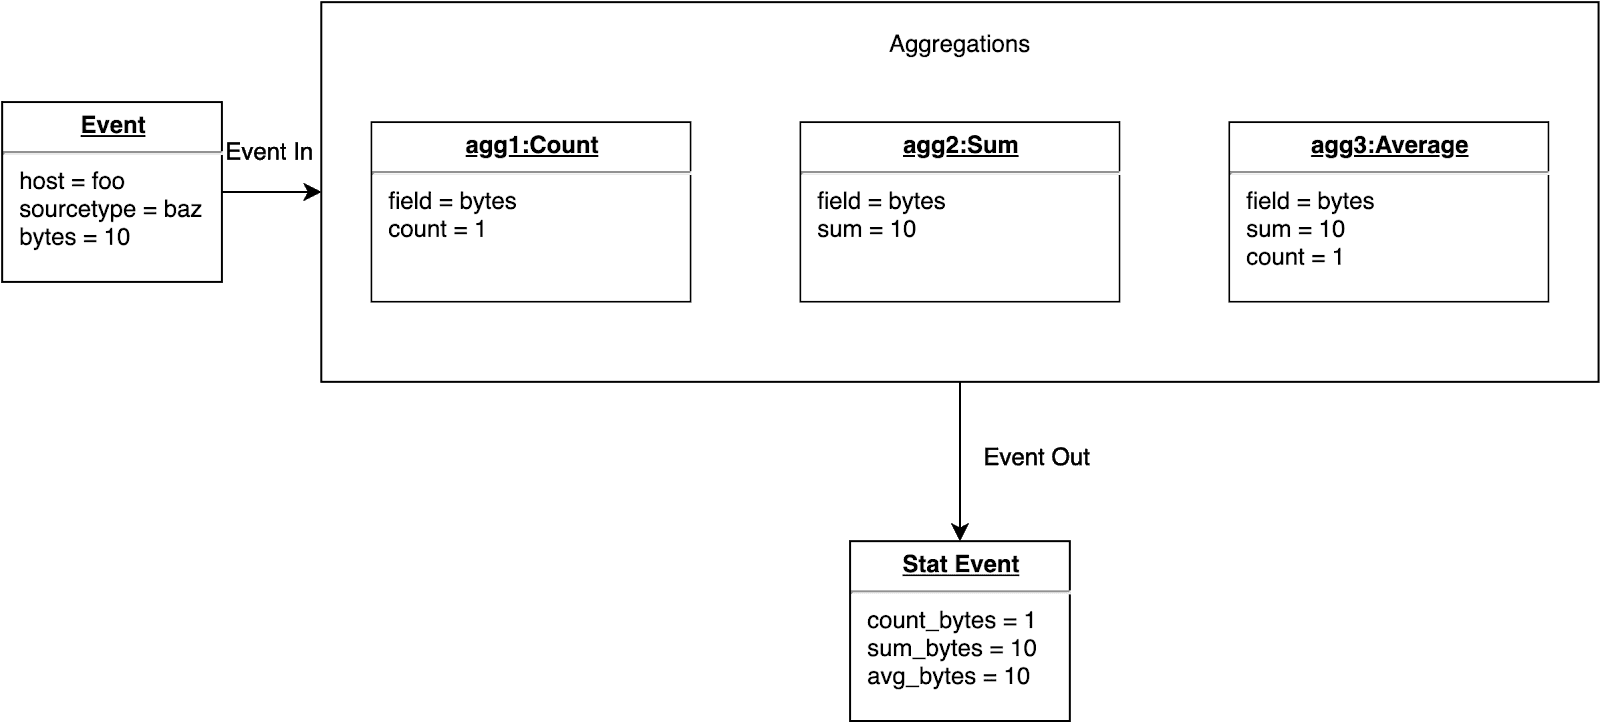
With this in mind, an object was instantiated for each aggregation type (count, average, sum, etc). Each of these objects were self-contained in the sense that they all held the relevant statistics needed to calculate the final output of the aggregation.
Below is an example of what this very basic, naïve approach to simple, ungrouped aggregations looks like:

Step 2: Adding support for group-bys…RAM is a hell of a drug
Cool. Now for the hard part. Implementing group-bys. The above implementation looks great until you think about what you need to accurately depict a group-by. We are now required to keep the value of the aggregation for each value of the field we’re grouping by.
Let’s say we want to calculate the sum of a field and group it by the host from which the log came. In order to output the correct aggregate for each value of host, we need to store/compute the aggregate for each unique value of host. Well shit, now we’re growing memory linearly based on the cardinality of the host field, which last time I checked, is unbounded.
Yikes.
Okay. So it actually gets worse. Now I want to group by host and sourcetype. We need to extrapolate the pattern above and store/compute the aggregate for each unique set of group-by fields. This presents us not only with a memory problem but a compute problem as well. We need a data structure to minimize the memory usage as well as lowering the compute time to figure out which aggregate to update when a new event comes in to the system.
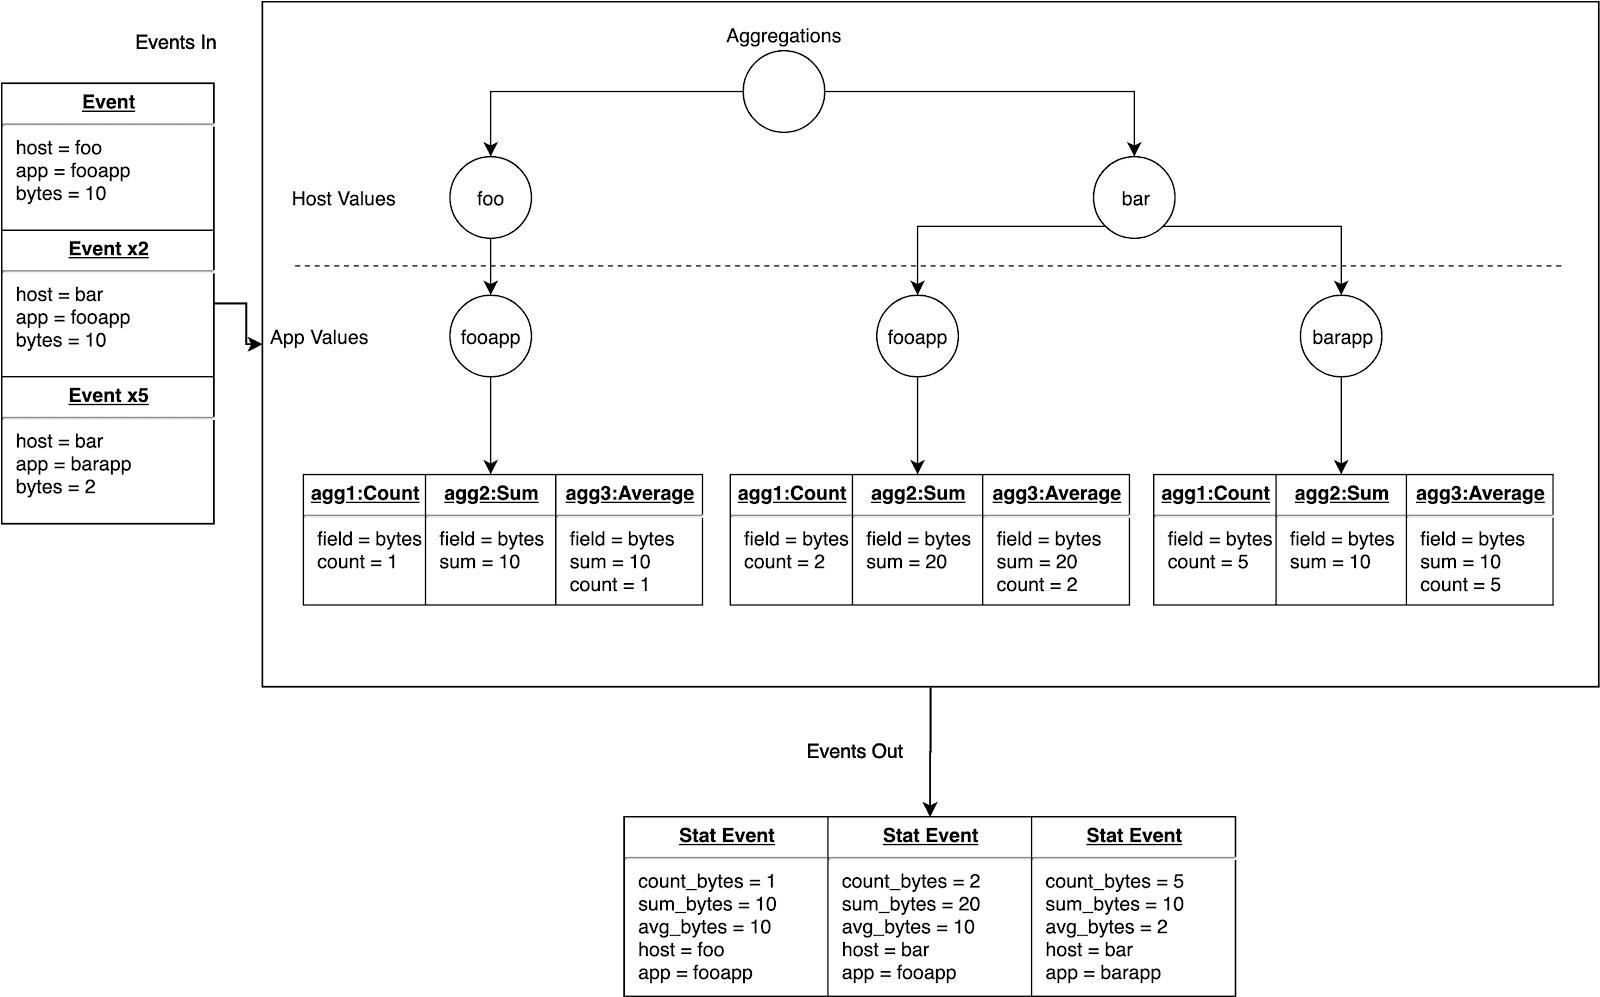
Ultimately, it made sense to use a trie here. We only have to perform n O(1) lookups, where n is the number of group-by fields, in order to reach the aggregation node. A trie also allows us to merge common group-by field values, reducing some memory overhead.
Hooray! We’ve accomplished the functionality portion of our journey. Now, we need to make sure that customers can actually use aggregations at scale without OOM killer being invoked.
Below is an example of what our new trie-based data structure implementation looks like:

Step 3: Sufficient === Efficient
Now that we have an optimized data structure for separating out the unique combination of group-by field values, we need to figure out how to reduce the memory footprint even further, so we are not crippling systems with the aggregations pipeline function.
One thing that we haven’t addressed is the aggregations themselves. If you look back at the previous diagrams, you’ll see that we’re creating a node for each aggregation being performed; however, some of these aggregations actually share common data within them. For example, if you’re aggregating the sum, count, and average of a field, all you really need is the sum and the count, but we’ currently storing the count and the sum in two places, each in their respective aggregation functions and within the average aggregate function.
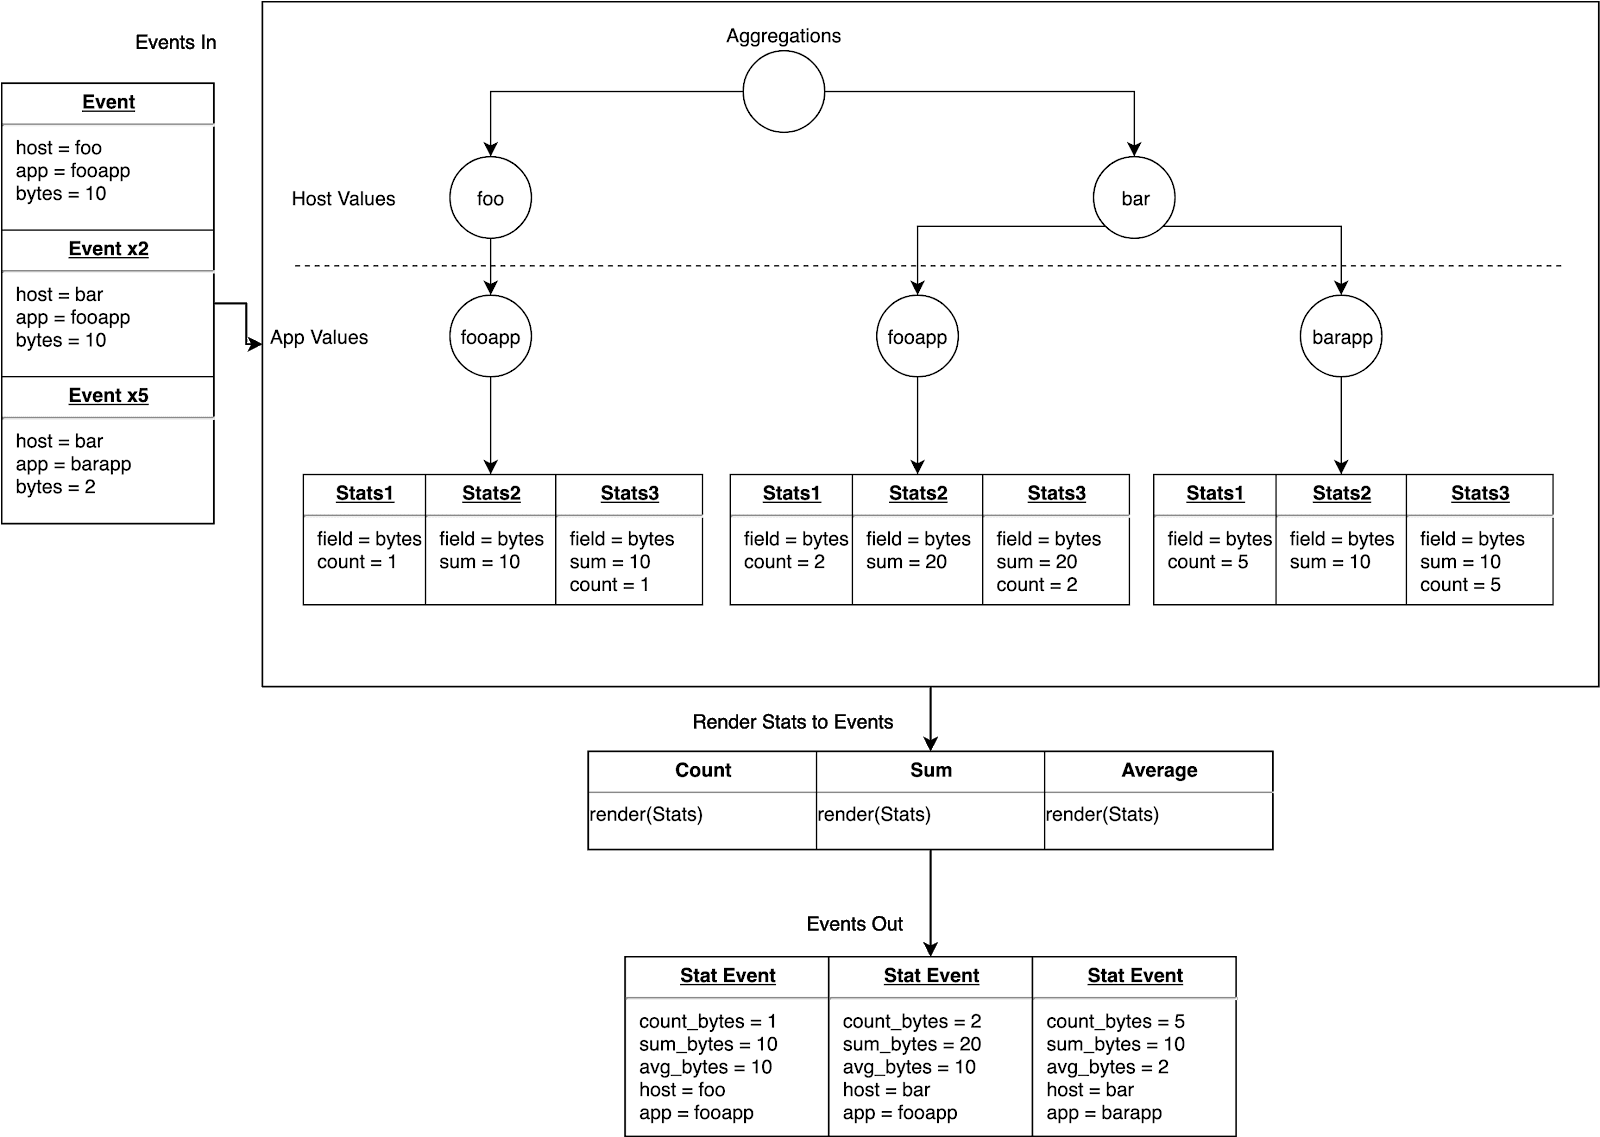
Clearly we can do better here. That’s where sufficient stats comes into play. Let’s just calculate the statistics we need for any given field, and then we can render out correct aggregates when outputting events.
First step we need to take is refactor our existing data structures to talk to this sufficient stats data structure instead of the aggregate objects themselves.
Below is a diagram showing the system swapping out aggregation objects for sufficient stats:

Step 4: Sharing (state) is caring!
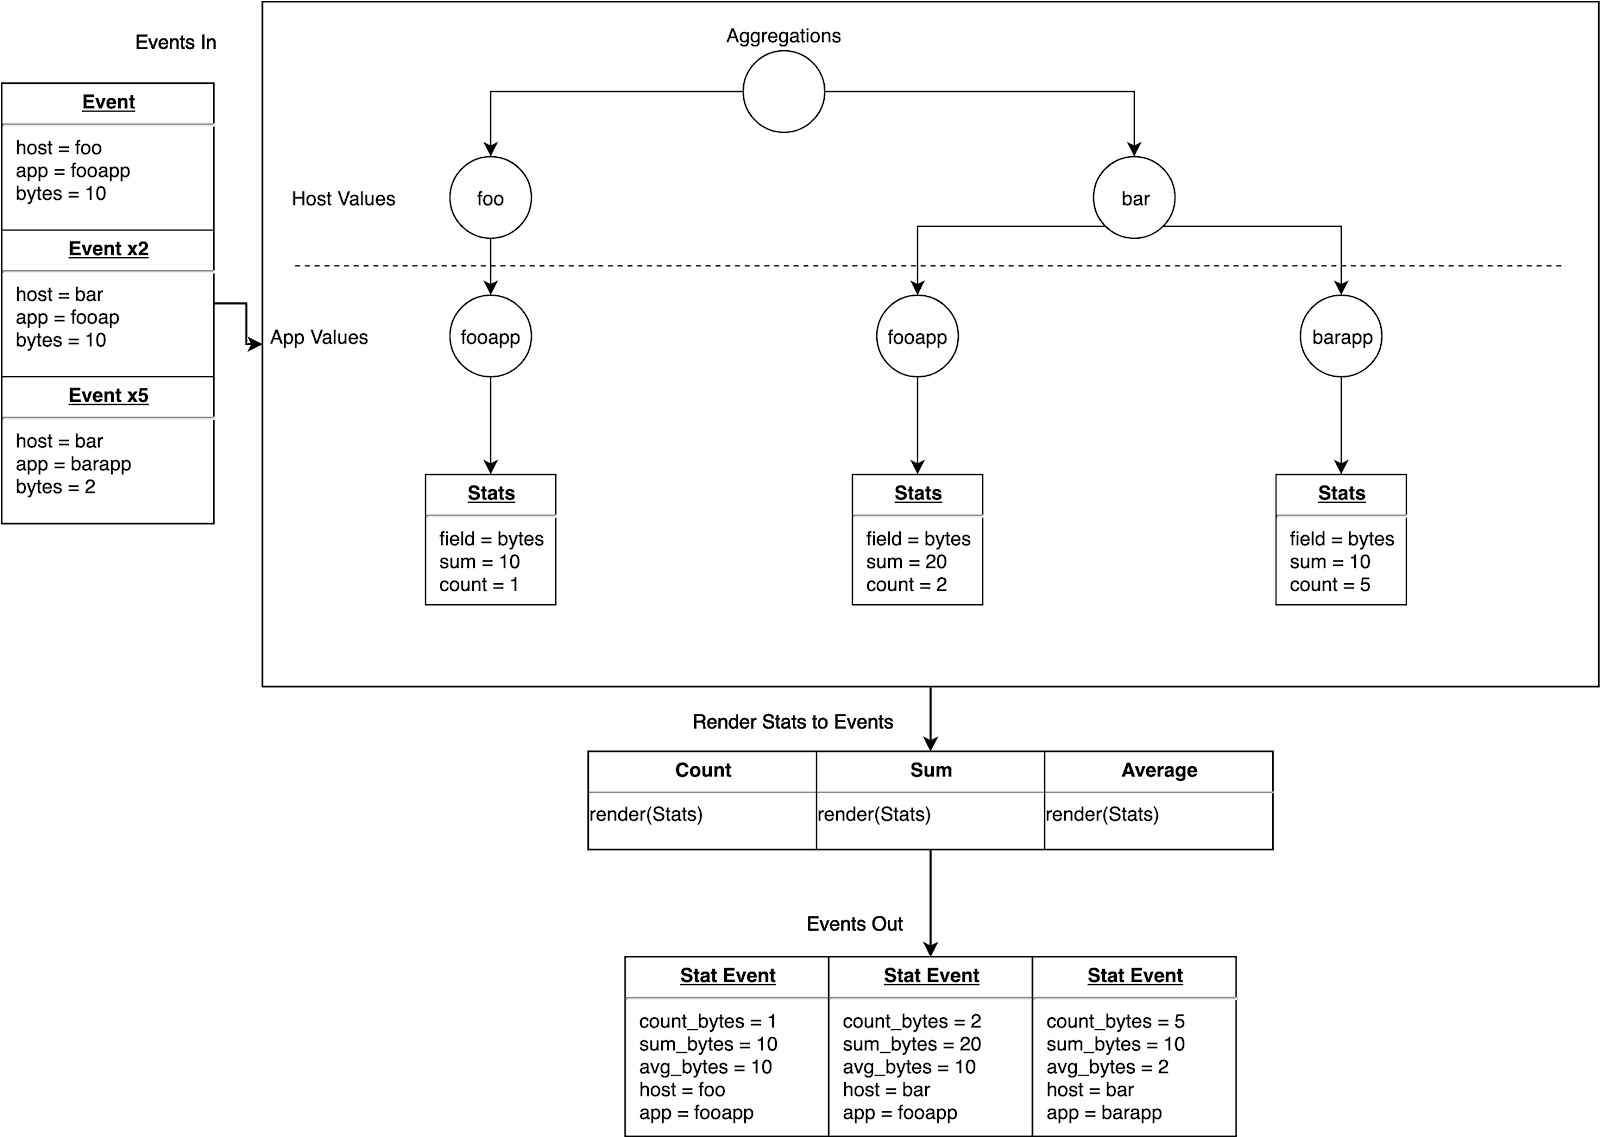
Now that we’ve successfully refactored the system to use a sufficient stats object, we can merge all sufficient stats calculations for a unique field/group-by-val combination into a single node. This successfully trims down the number of leaf nodes in our trie from one node per aggregation (with multiple aggregations per field) per group-by value combination to one node per field (regardless of the number of aggregations for that field) per group-by value combination. This helps us scale dramatically since customers typically want to turn a field into a dimension (i.e. perc, mean, min, max, count, sum, etc).
At this point, you might be asking about the aggregate functions that are not sufficient stats backed. Those typically fall into two different categories: unique state or shared state. Unique state is pretty simple, you are required to store/compute the state for the aggregate in a unique manner for that aggregate (i.e. earliest() or latest()). Shared state is just an extrapolation of sufficient stats. The best example I can give for this is when we came across numeric instability with the initial variance calculation we were using.
For those of us who are stat illiterate, variance can be calculated with just the sum, sum squared, and count. This means we just needed to hook all variance-based aggregations into the sufficient stats data structure.
However, when the numerical instability came up with the variance calculation, we had to switch up the algorithm using a different calculation not included in the sufficient stats (and didn’t make any sense going into sufficient stats as it was unique to variance calculations). We just extrapolated and extended the sufficient stats data structure in order to create other shared state aggregations. There’s probably another optimization we can do there for memory around reusing calculations across these shared states (like counts); however, we’ll cross that bridge when we get there.
Below is a diagram showing the shared states we now use:

Step 5: Welcome to RAM rehab (estimating/limiting memory usage)
Now that we’ve done a sufficient amount of data structure optimization, there’s only one more thing we can do to save ourselves from awakening the OOM killer, enabling the customer to set an estimated memory limit for any particular aggregation pipeline function.
In order to enforce memory usage limits in a Node.js application, we had to deep dive into the memory profiler and learn the nuts and bolts of Node.js/JavaScript memory allocations. Once we had an understanding of how much memory certain types/objects were allocated, we added in a framework for estimating the memory being used by the trie structure at any given time without walking the entirety of the trie. Once customer provided memory limit is surpassed, we’ll flush the contents of the aggregation function, render events, free up the memory that was being used, and send the events down the pipeline.
If you’re interested in learning more about memory allocations in Node.js, take a look at this blog post. It’s a great empirical deep dive into memory allocations.
We want to enable the customers to not fully be at the will of our system and algorithms for memory management. Every customer use case ends up being unique in some way, and we want to ensure that exceptional cases still leave the product in a stable/usable state.
Wrapping Up
My personal takeaway from developing the aggregation pipeline function was the importance of following and adhering to your engineering principles. For me, that entails beginning development with the design phase and drawing up a concrete design document (regardless if that document reflects the 100% finished product or not), and shopping the design around to all the various stakeholders. It allows you to course correct early on in the development of the feature and gets everyone on the same page. It also allowed us to get the meat of the feature developed early, so we could determine what worked and what didn’t, adjust requirements, and design a better product.


