Back in the day, I LOVED me some lookups. Being able to add lookup tables in Splunk was a huge win for me: adding context to events for things like cost centers for systems, GeoIP tagging and environment/dependencies helped make data far more useful. Later on, when I was living in a multiple-tool world, I obsessed over the fact that I could do that enrichment in Cribl LogStream, and have the enriched data be consistent in every system.
Unfortunately, if the data you want to use is of any considerable size, CSV files hit their limitations pretty quickly. Performance suffers, and pretty soon you’re avoiding enrichment, because the benefit no longer outweighs the self-flagellation.
So imagine my glee when I found out that the Redis function made it into the LogStream 2.4 release. At this time, I had been talking to a company called GreyNoise about partnering with them to use their solution with LogStream. If you’re not aware of them, definitely check them out. They run a fleet of sensors around the internet listening (and categorizing) all of the internet’s noise. There is constant background noise on the internet – scans, attacks, and just day-to-day traffic patterns. The intent of GreyNoise is to weed out all of the “benign” noise – meaning traffic that is not a threat – to allow you to focus only on the events that matter.
Of course, I’m thinking about workflows with things like AWS VPC Flow Logs or PAN firewall logs, and using the GreyNoise data to decide whether to send events to my log/metrics systems. As you can probably imagine, GreyNoise captures a ton of data: just pulling 1 day’s worth of IP-address–categorized data can yield around 350K records. Calling an “offsite API” in a LogStream pipeline is really not feasible, as it would slow down the pipeline considerably (just by latency alone, no fault of the API). So I exported the GreyNoise data to a CSV file, and while it worked, it crushed my test system.
So, fast forward to 2.4, now with Redis! Now, I can have a Redis instance sitting right next to my LogStream worker group (so I don’t add significant latency), and I can feed all of that data into the Redis instance, and use it as a lookup in my pipelines. Since it’s Redis, I can feed the data to the cluster any way I want – I can run a script on my laptop, run an AWS Lambda function, or use LogStream’s Data Collection feature.
I set about using all these great tools at my fingertips to help me tame my VPC Flow Logs. We run a number of internal workloads in AWS, and of course, we enable and capture VPC Flow Logs. If you’ve ever looked at VPC Flow Logs, you know there can be a LOT of data to sift through. So I decided on what I needed to do:
Build a collector that runs 1x per day that grabs the previous day’s worth of data from the GreyNoise API.
Build a pipeline for that collector that extracts the IP and classification for every record returned, and puts a corresponding Key/Value pair into Redis.
Create an S3 collector that retrieves my VPC Flow Logs from the S3 bucket we keep them stored in.
Build a pipeline that extracts the data in the VPC Flow Logs, and enriches it with the GreyNoise classification for each IP address in each event. That pipeline should create a set of metrics on *all* of the events that come through it. It should also filter the raw logs, such that only events that have either the source or destination marked as either “malicious” or “unknown” are sent to the downstream system of analysis.
I am going to end up with something along these lines:
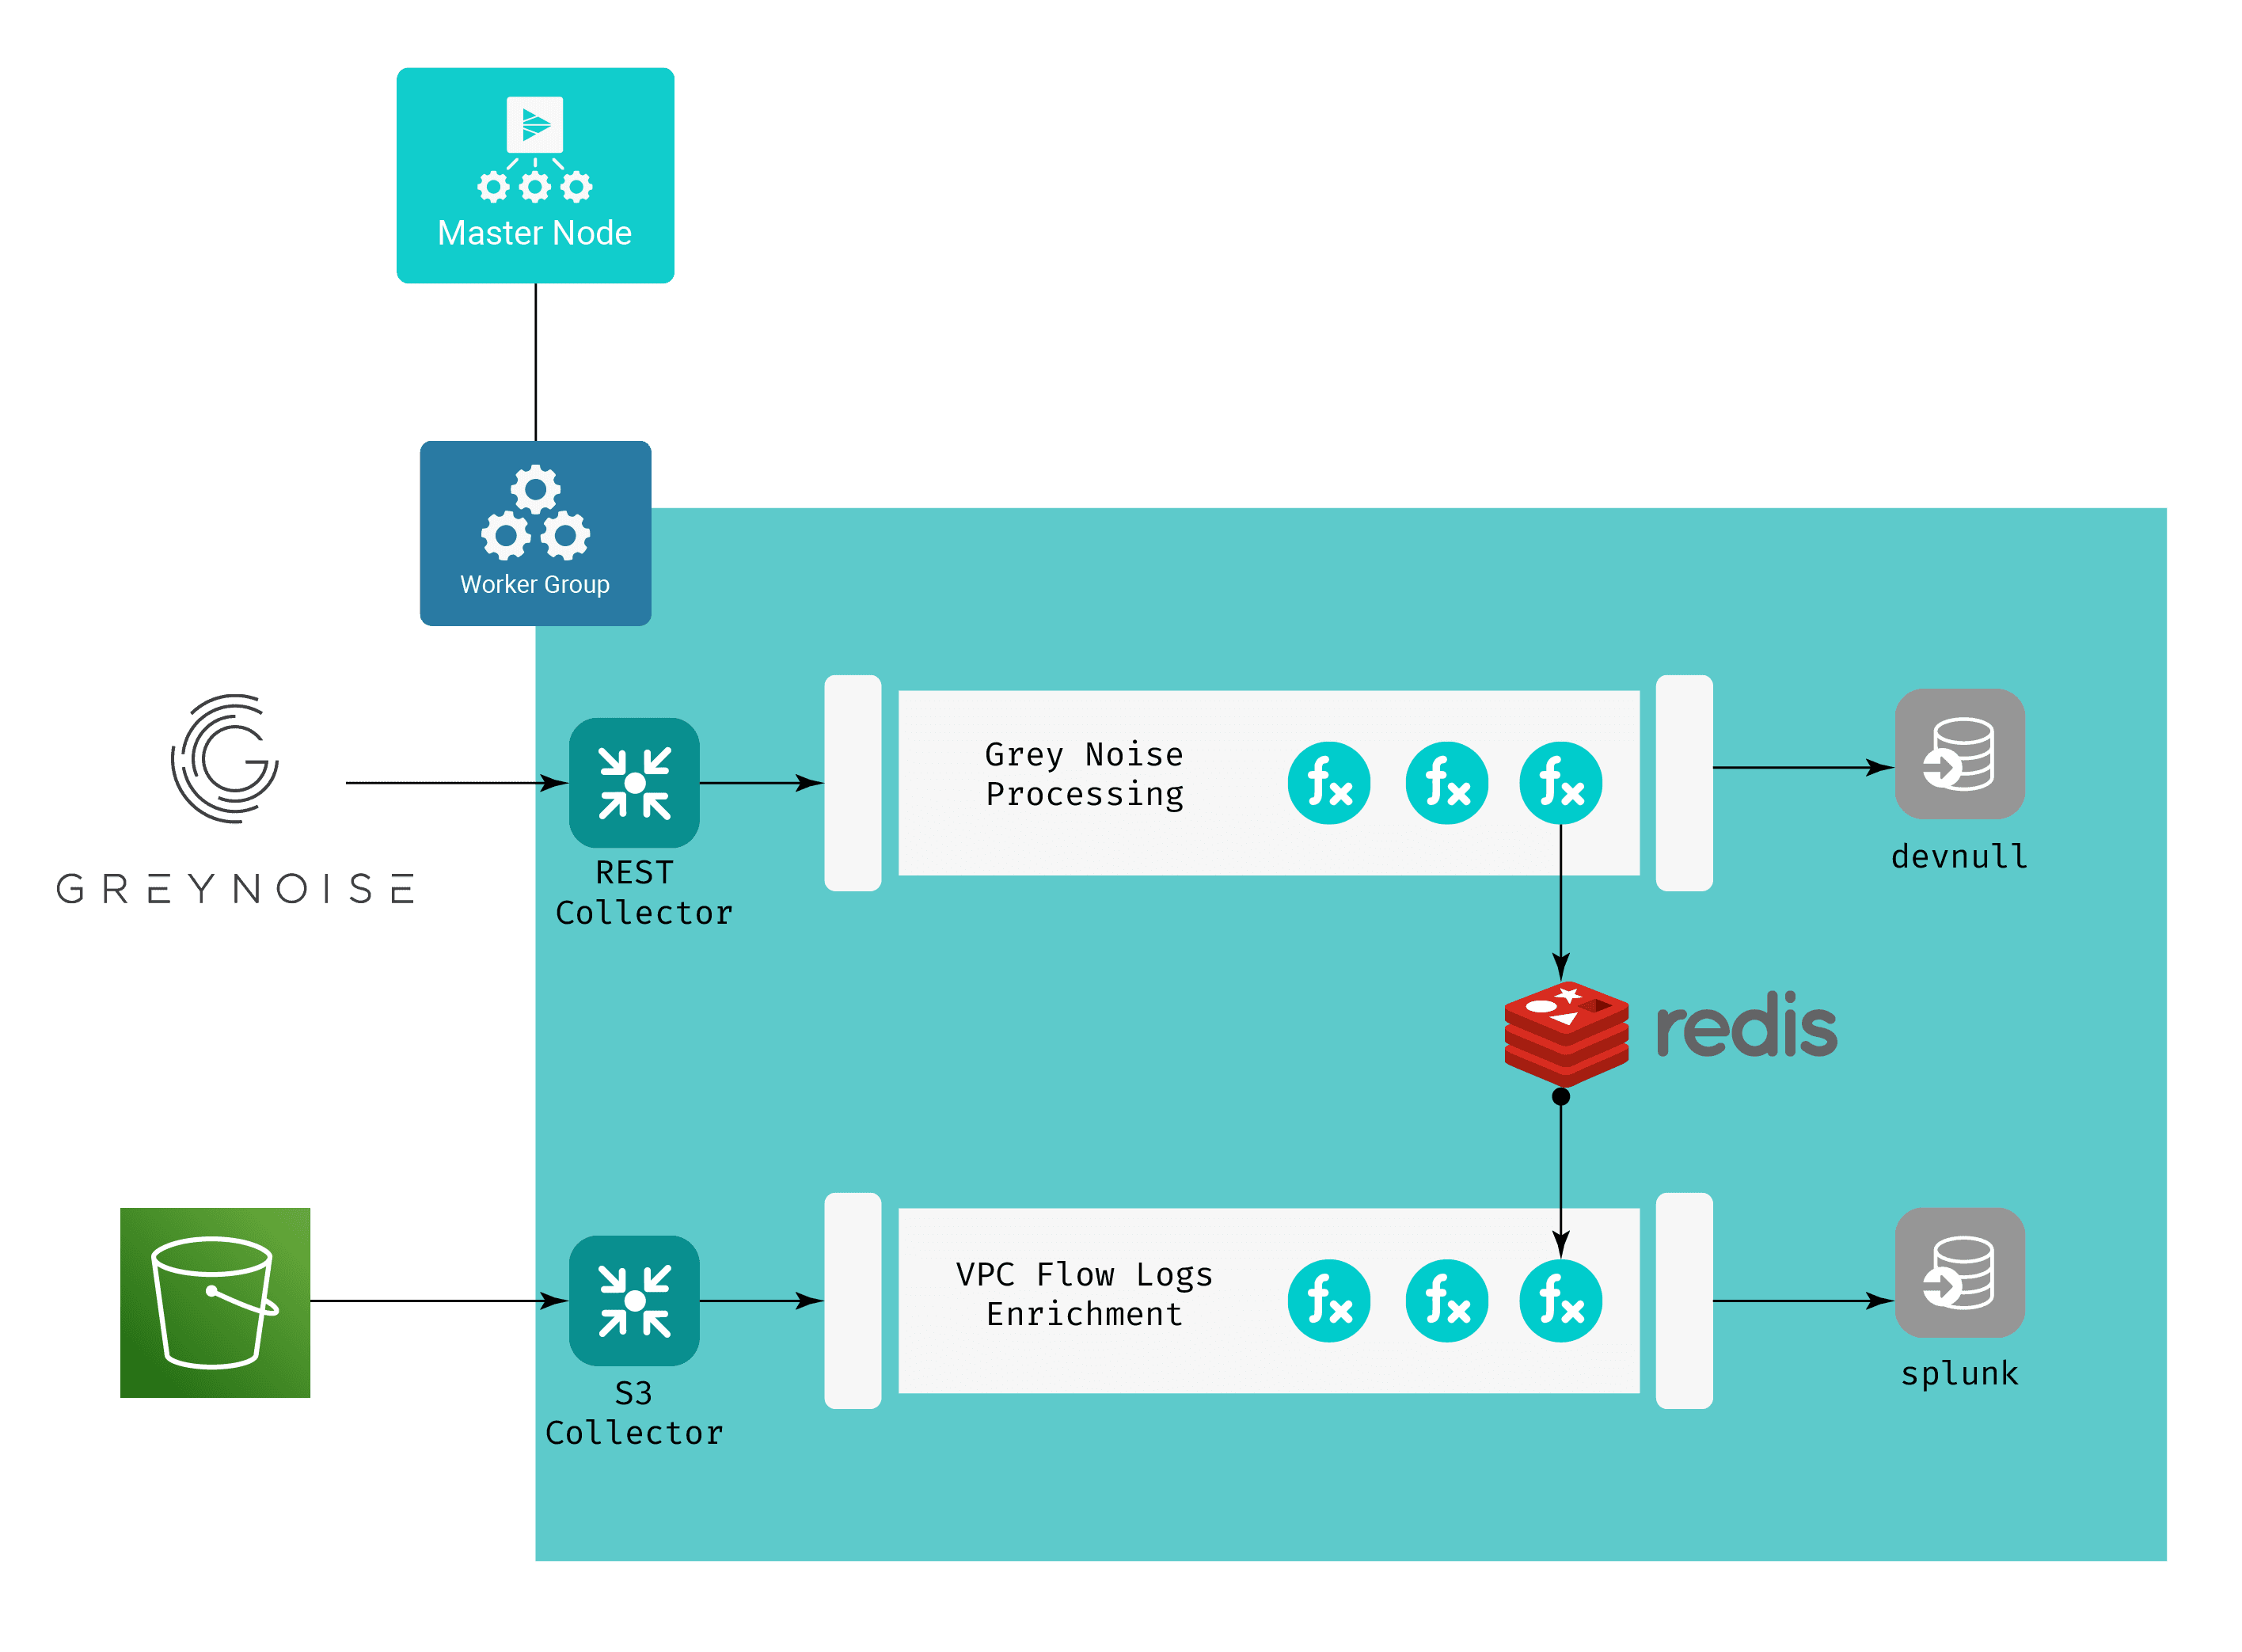
A couple things of note here:
The purpose of the GreyNoise Processing Pipeline is to feed the data to Redis as key-value pairs, and we have no need for the GreyNoise data to be passed on to any of our “normal” destinations. This is why the devnull destination is used, meaning that after the pipeline executes on any event, the event effectively “disappears” – it doesn’t count against my downstream licensing or infrastructure.
Both pipelines have a Redis function in them. The GreyNoise Processing Pipeline uses this function to call the Redis PUT command, while VPC Flow Logs Enrichment uses it to call the Redis GET command, enriching its events with the output of that call.
The VPC Flow Logs Enrichment Pipeline creates metric data from the raw VPC Flow Logs events, drops any raw event whose source IP or destination IP has been classified as either malicious or unknown, and sends both types of data out to my Splunk destination. This filters out any internal<->internal traffic, as well as anything that GreyNoise has deemed benign.
I’ll be covering the details of building this in detail in part 2 of this blog post, but for now, in the spirit of the Underwear Gnomes, let’s skip task 2 and get right to the profit!
Results
First, the metrics – Here’s a snapshot of the extremely simple dashboard I built for this:
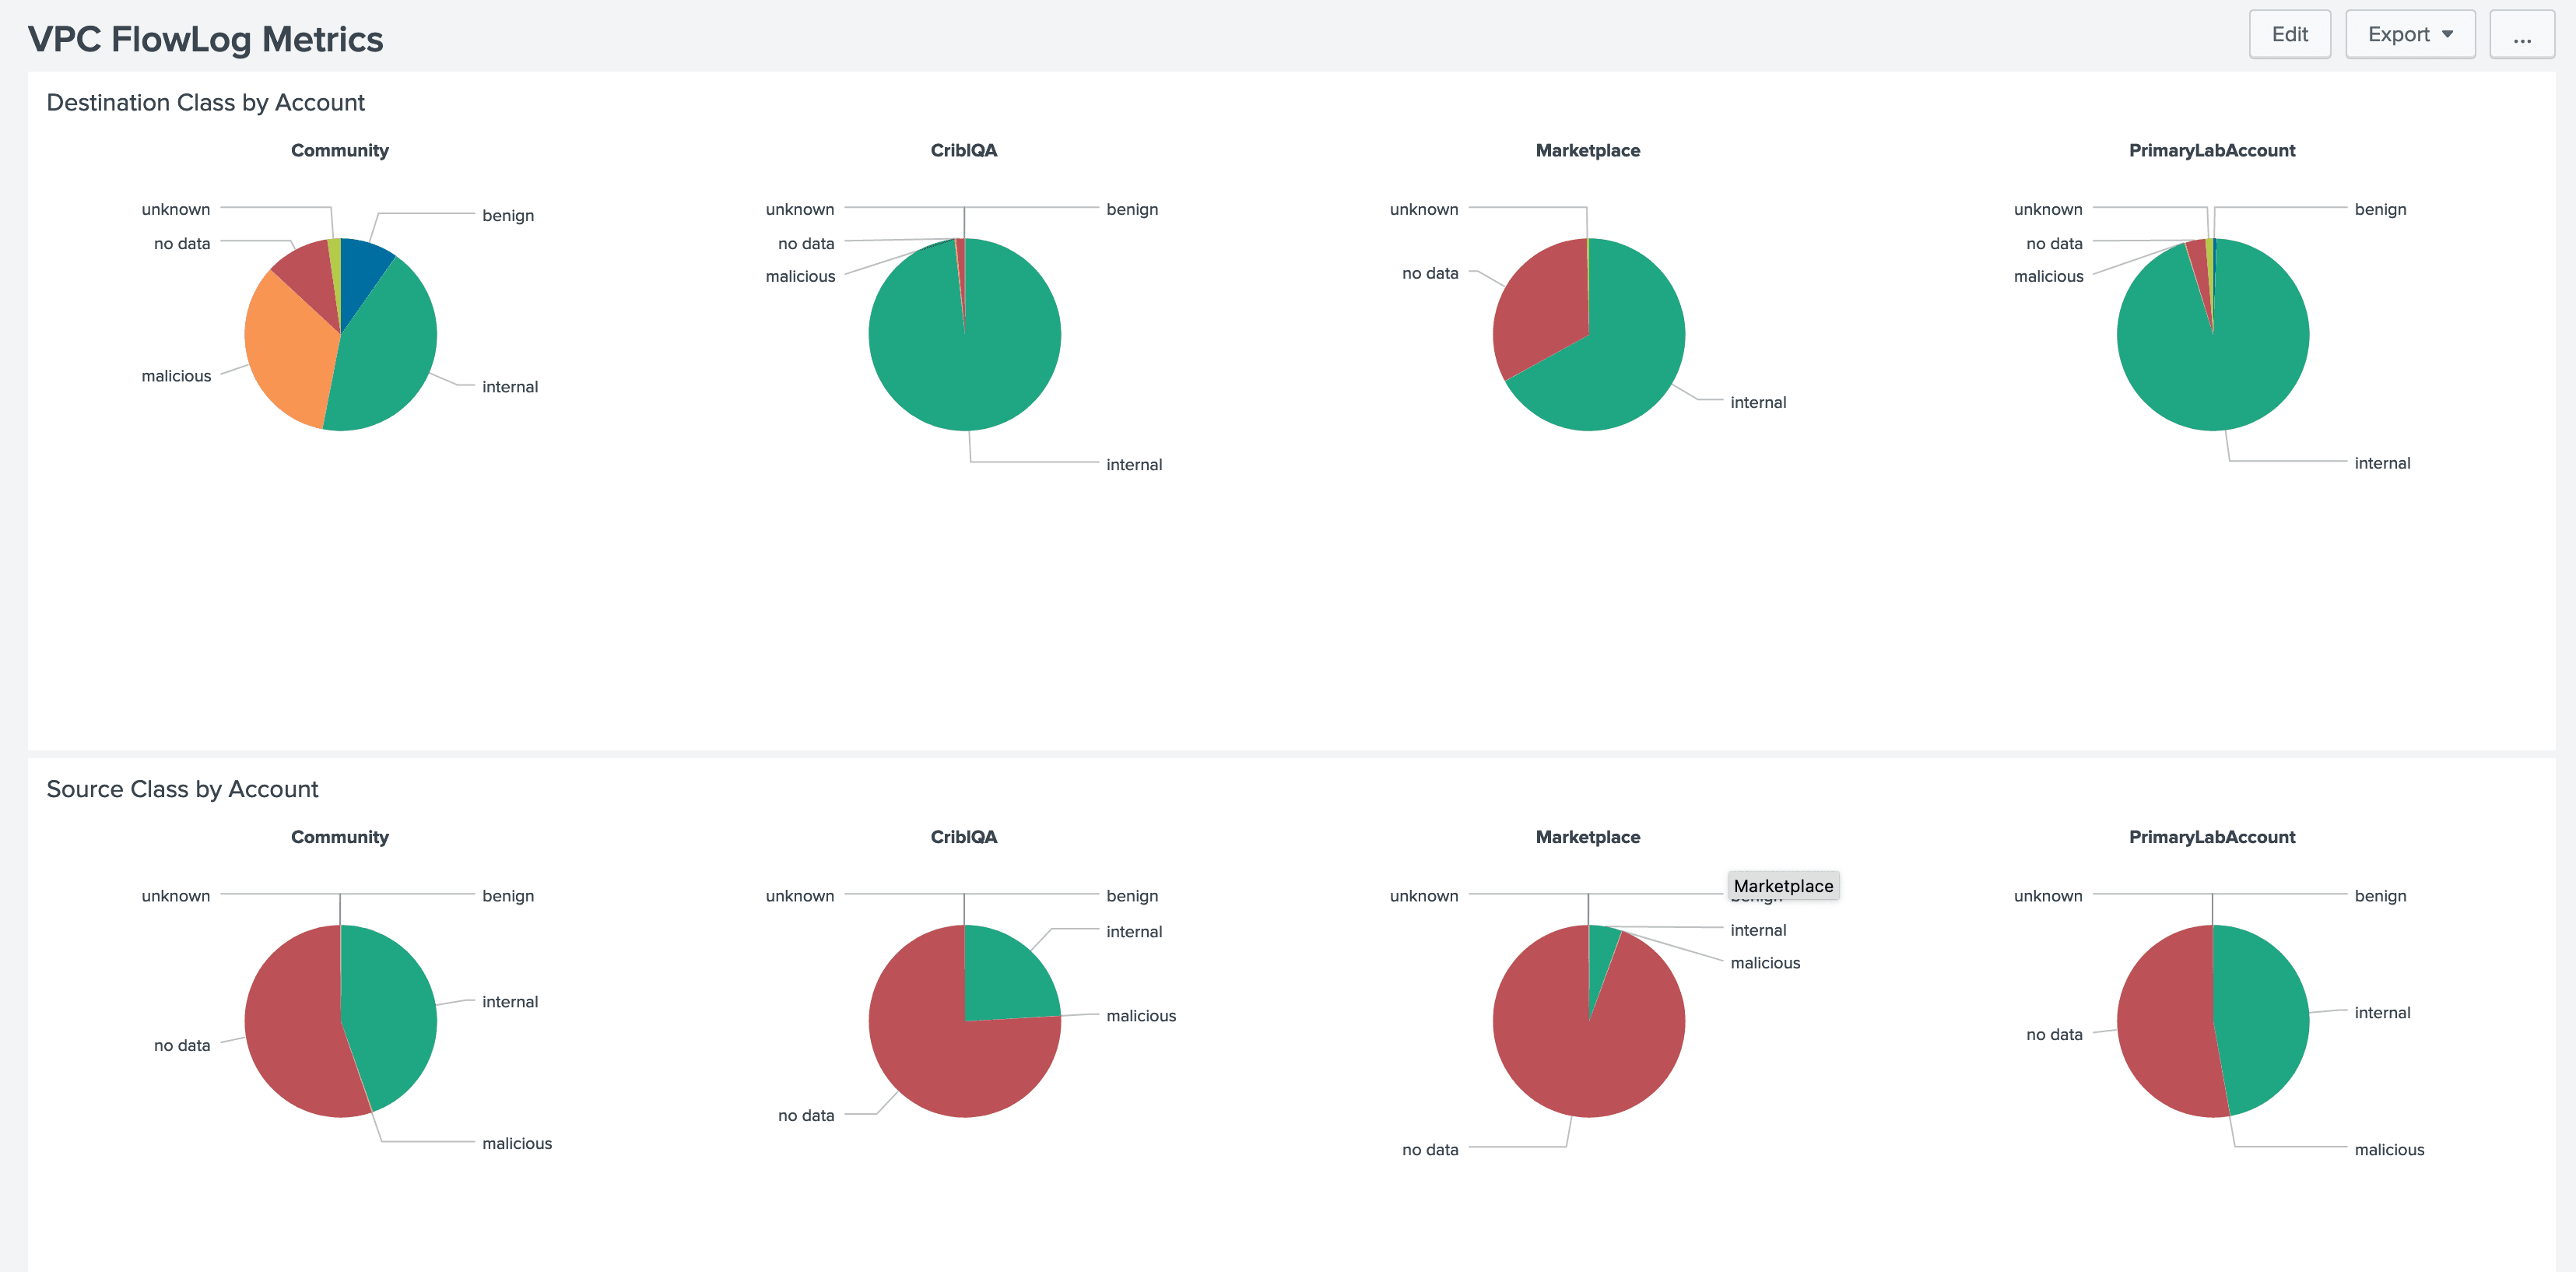
In this case, we’re seeing four of our accounts, with breakdowns of their traffic by source IP (bottom) and destination IP (top). If you look closely, you can see that during the period we’re looking at, the overwhelming majority of our traffic is benign, internal, or “no data” (which is a designation I add for traffic from/to IP addresses that GreyNoise doesn’t see, meaning most of our legitimate traffic). For the purposes of this effort, I’m considering that “not interesting” traffic, but depending on what I’m trying to do, I might omit it.
So, now if I look at my events – first, looking at the stats from my LogStream S3 collector – I see that it collected over 3.6 million events.
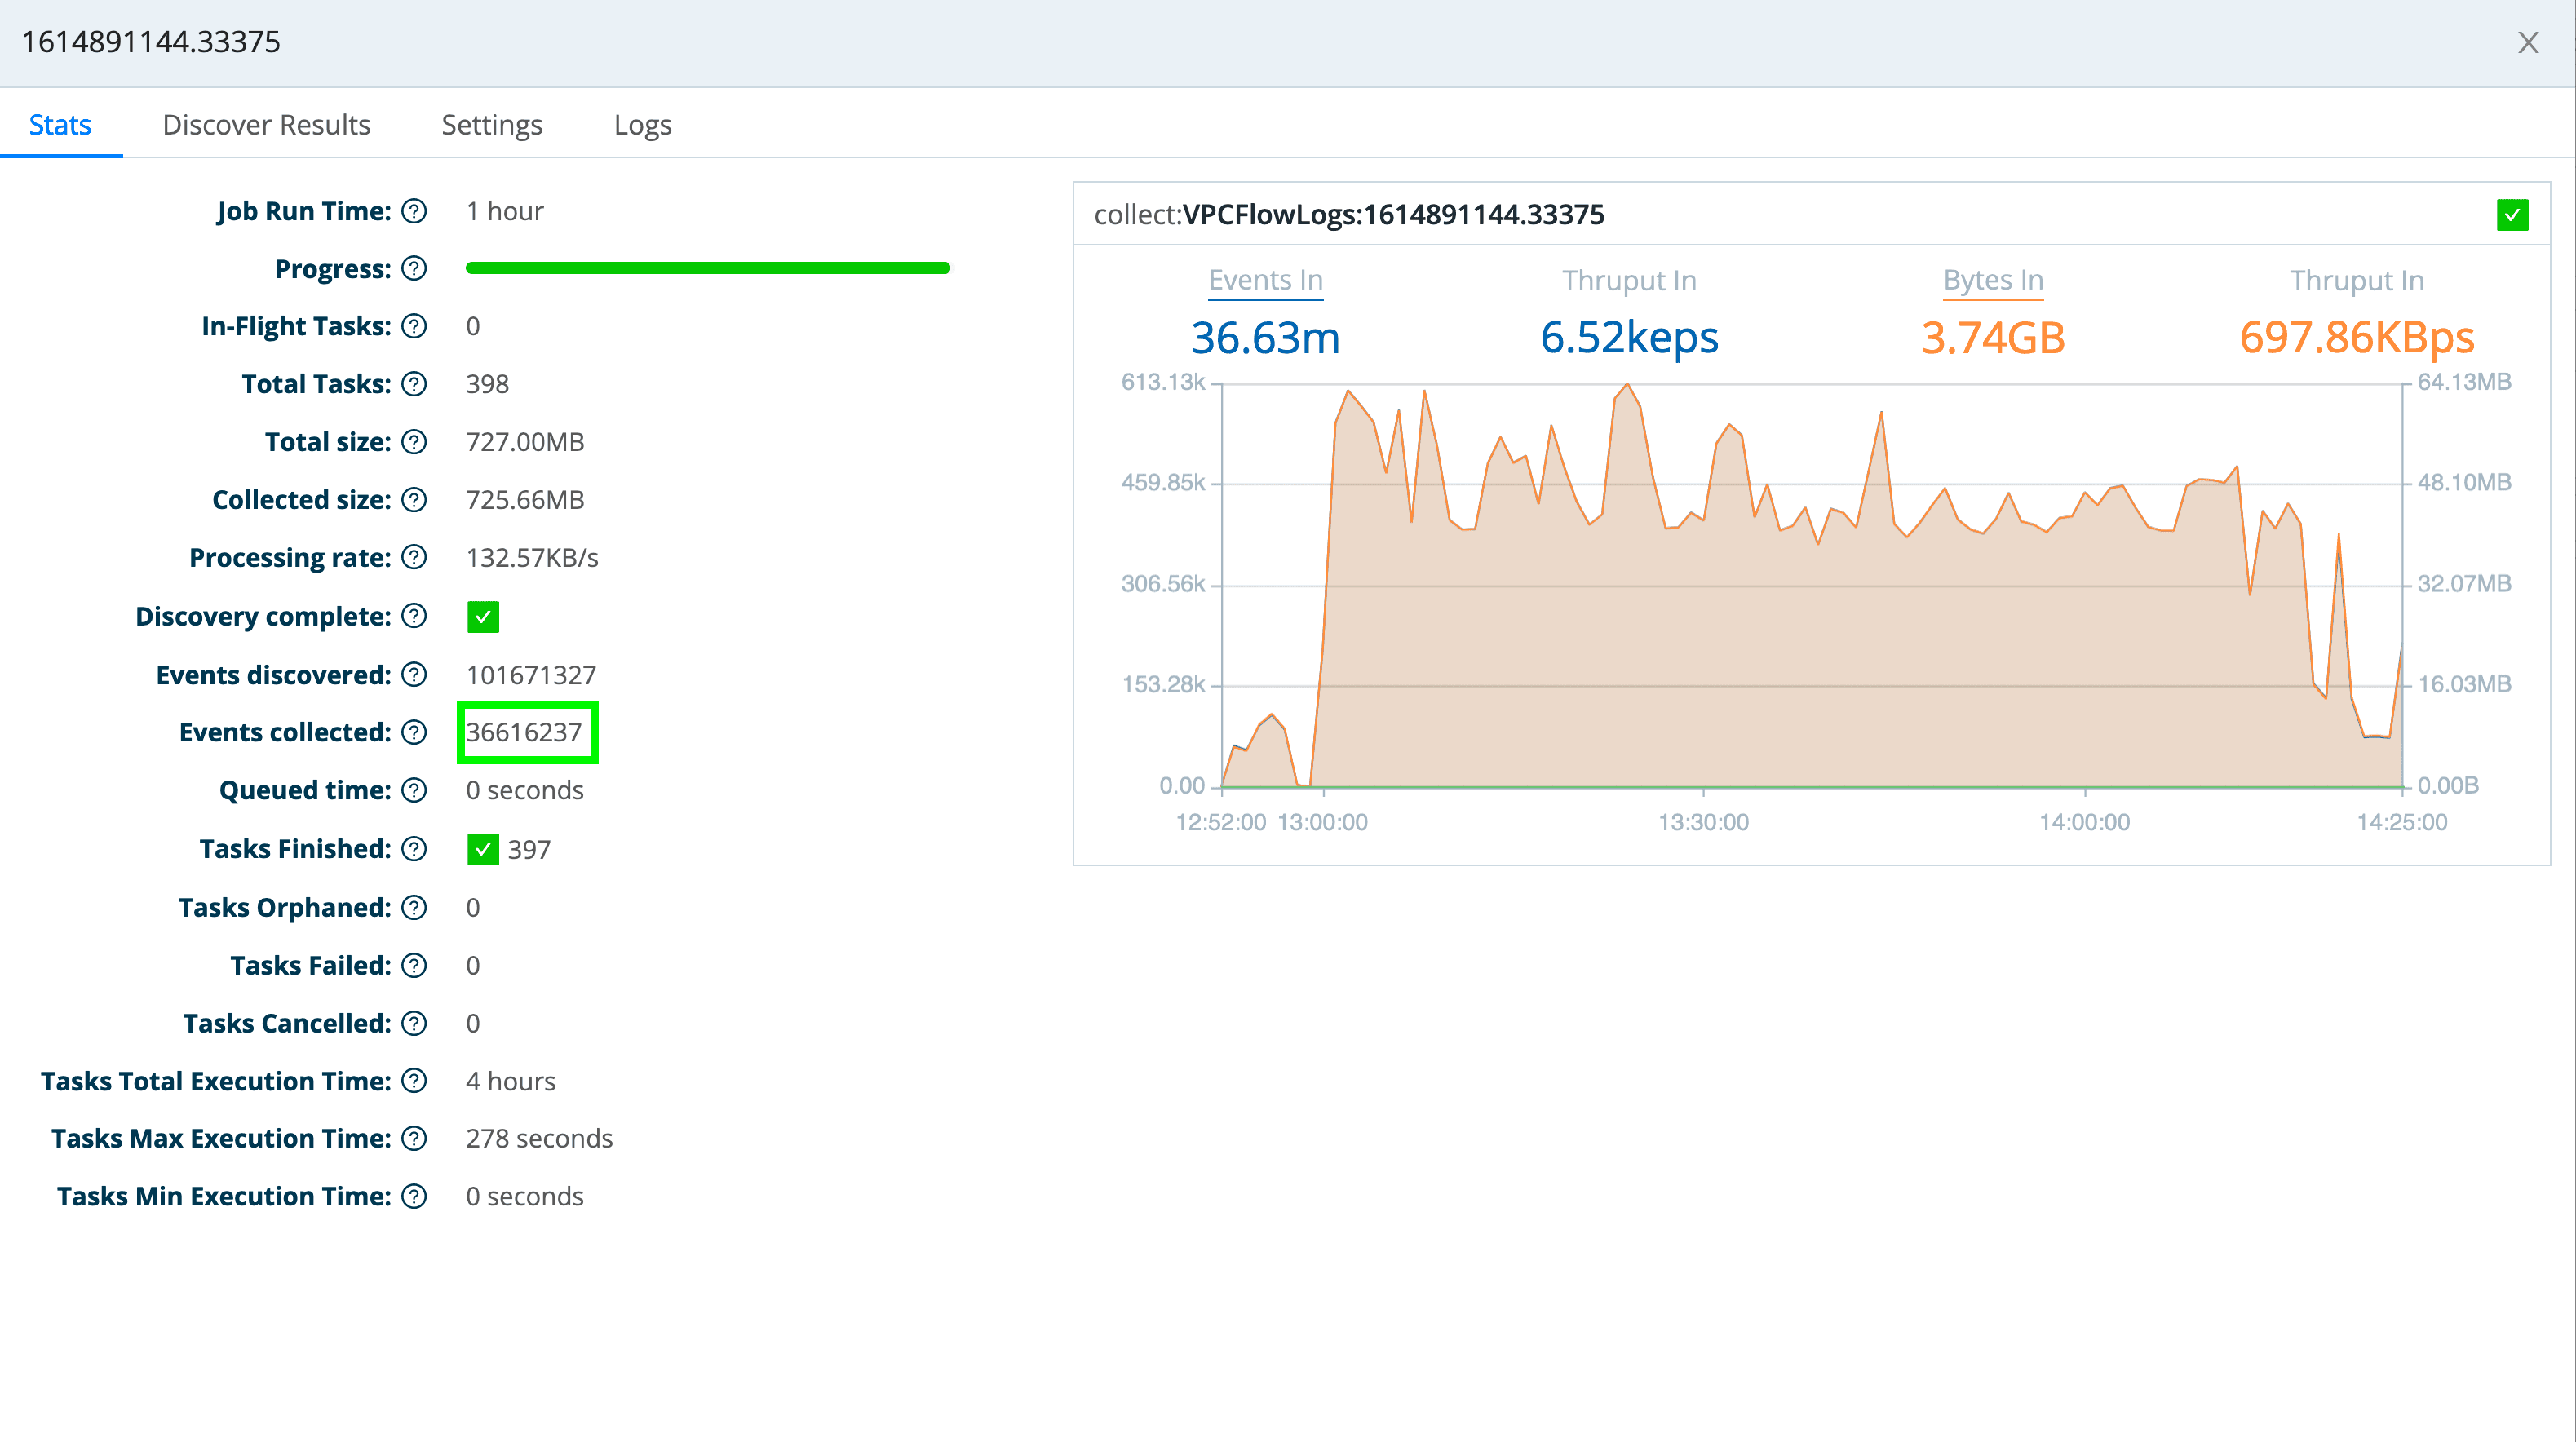
However, if I look at the events in Splunk over the same time period, I see that the pipeline only sent 347,678 events. That means my filtering reduced the events going into Splunk by a bit over 90%.

Clearly, in this scenario, I’m using this enrichment data to make routing and reduction decisions in my pipeline. This is where having all of this data be “replayable” via LogStream’s data collection feature comes in really handy. If I decide that I actually want to include those “no data” events, I simply change the pipeline to pass those through, and re-run the collection (you’ll probably want to delete the events and metrics in Splunk first, though).
In the next installment of this two-part series, I’ll walk through the steps to set this up, including LogStream configuration and other details.In the meantime, if you want to either learn or refresh your memory about LogStream’s enrichment capabilities, I suggest you go run through the Enrichment sandbox, the Lookups Three Ways sandbox, or both.


