
UPDATE 2023-12-04: This information is technically out of date, but we’re leaving it here to have a history of the content. For updated information, check out these 2 docs page:
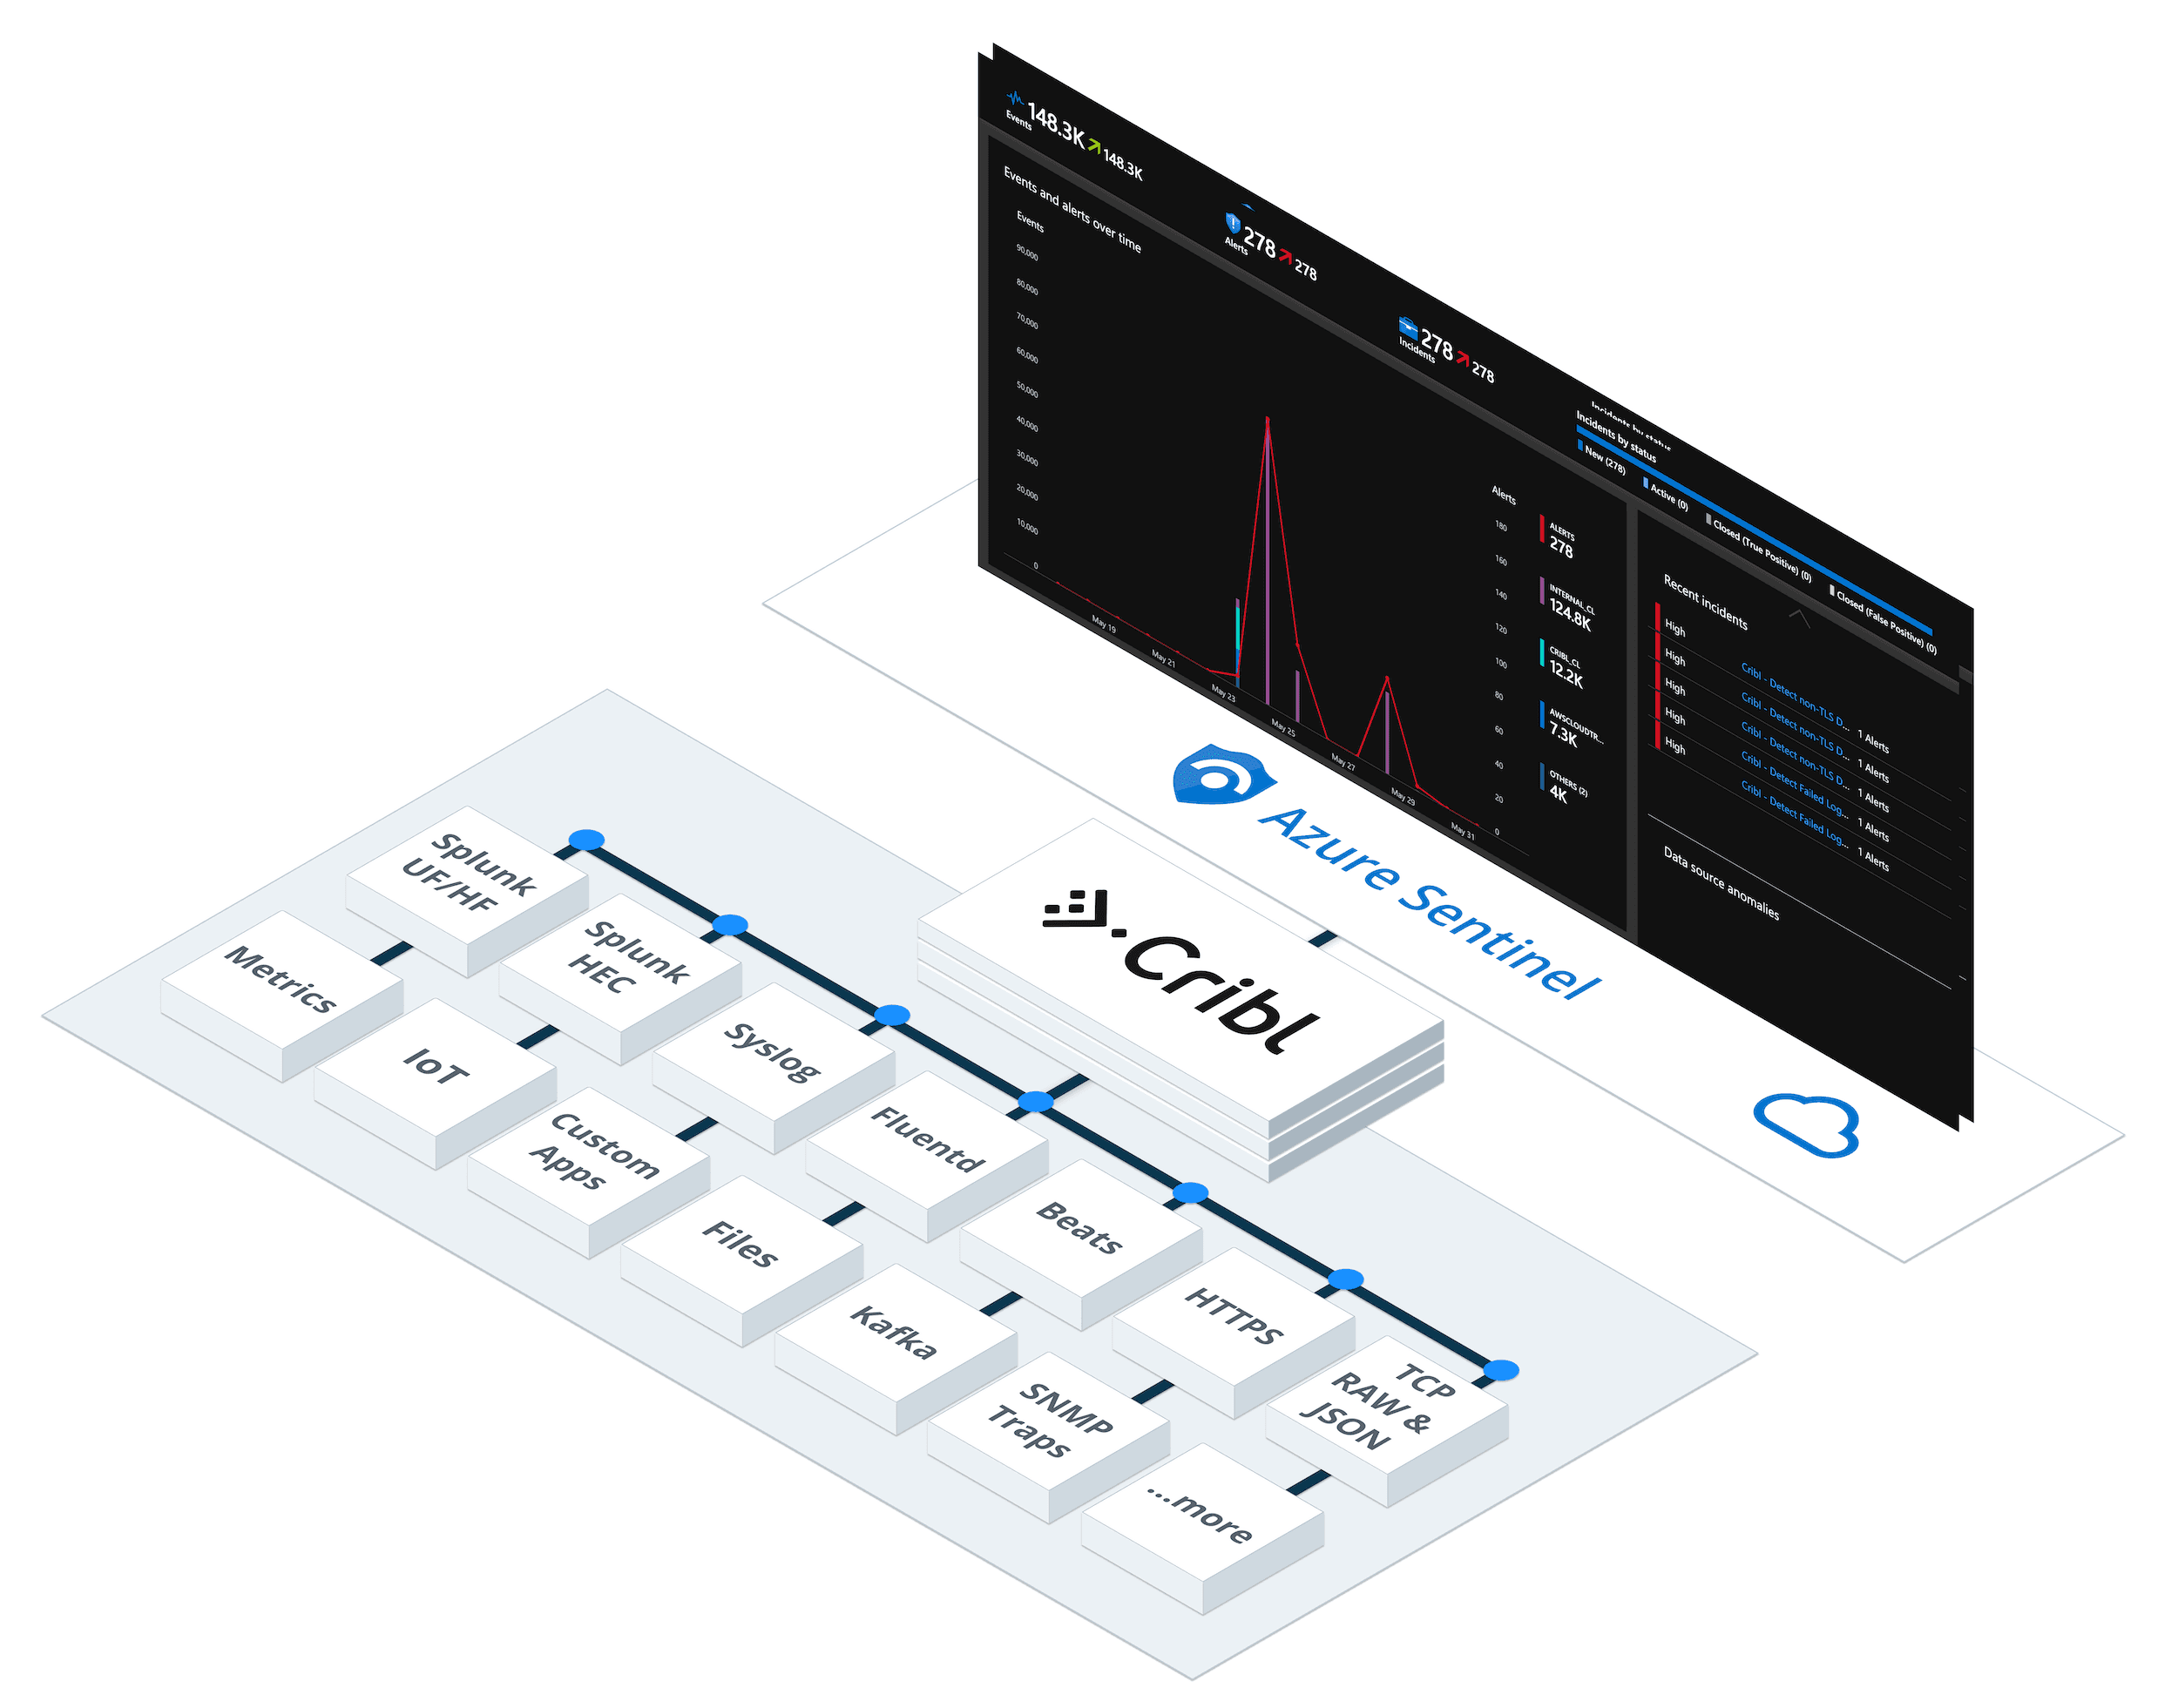
A number of customers have asked us lately whether they can use Cribl Stream to send data to Microsoft Sentinel – and the answer is a resounding “Yes, of course!”. Let’s take a look.
Sentinel is Azure’s cloud-native SIEM & SOAR platform that provides users a single solution for alert detection, threat visibility, proactive hunting, and threat response. It can ingest data, out of the box, from a number of native connectors, but it also works with data delivered in an Azure Monitor Log Analytics workspace.
In this post we’ll explore how to use Stream to send custom logs to Azure Monitor Log Analytics and then build custom detection rules in Microsoft Sentinel.

Setup Microsoft Sentinel
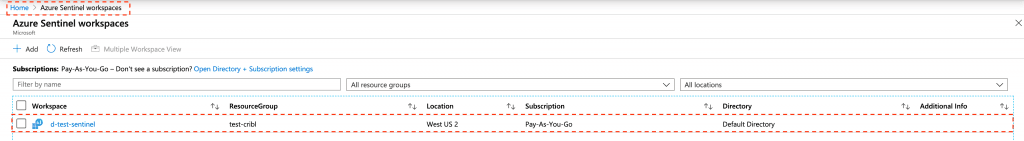
To enable Sentinel, go to your Azure console, click on Microsoft Sentinel, then click on Add. Next, either choose an existing workspace, or create a new one. Follow the on-screen wizard and complete the setup, including selecting a Resource Group and a Region.

When you’re done, you should see your workspace listed under Microsoft Sentinel workspaces as such.
Next, let’s go and find it Workspace ID and Workspace Key – we’ll need these credentials to connect to this workspace from Stream. Click on the workspace name, then go to Settings, then Workspace Settings. On the next screen, click on Advanced Settings: Note the following: Workspace ID = 1 and Workspace Key = 2.

Setup Cribl Stream to send data to Azure Monitor
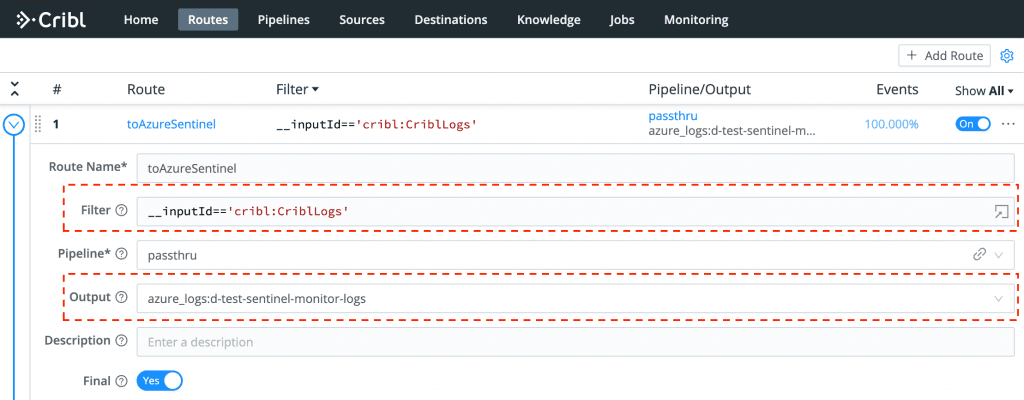
To setup a data connection from Stream we’ll use our native Azure Monitor Logs Destination. While in Stream, click on Destinations, then select Azure Monitor Logs. Click Add New and fill in the required fields as below:

Enter a descriptive Output ID and use 1 and 2, from above, as Workspace ID and Workspace Key respectively. In Log Type enter a name to identify these events in Azure Monitor. This is also known as a custom table name. Events sent to Azure Monitor via the Data Collector API end up as Custom Logs in a table with the _CL suffix. In our case, we’ll be sending Stream’s own internal logs, so let’s call this internal. This will eventually become Internal_CL in the Logs Workspace, as we’ll see shortly.
Next, create a Route for internal logs, select a Pipeline (e.g., passthru) and send data to Azure Monitor.
The cool thing about these logs is that they’re fully structured as JSON, so Azure Monitor natively ingests them and extracts their fields into columns automatically.
{"time":"2020-05-24T16:56:16.705Z","cid":"w0","channel":"server","level":"info","message":"_raw stats","inEvents":106,"outEvents":107,"inBytes":19706,"outBytes":26056,"starttime":1590339310,"endtime":1590339370,"activeCxn":0,"openCxn":0,"closeCxn":0,"activeEP":523,"blockedEP":0If your data needs structuring, cleansing and enrichment, take a quick detour at this post from our own Steve Litras.
Back in Azure, let’s run a quick query and verify that we can see our fields as columns:

Create Sentinel Rules
Now that we have confirmed that events are arriving correctly, let’s go ahead and create custom Sentinel rules. We’ll start with one that detects non-TLS connections running every 5 minutes, looking back 5 minutes and alerting on more than 0 results. While in Sentinel, go to Analytics, click + Create, then select Scheduled Query Rule. This will start the Rule creation wizard, which will prompt us with various inputs such as rule name and rule logic.
Enter Cribl – Detect non-TLS Destination Connections as the rule name, and optionally select one or more Tactics (e.g., Exfiltration) and a Severity.

Hit Next to advance to Set rule logic and enter the following query:
Internal_CL
| where tls_b == false
| summarize AggregatedValue = count() by channel_s
The Results pane on the right shows us a preview of the query. In our case it has returned two results. Under Query Scheduling select 5 minutes for both the frequency and the period.

While here, let’s go back and repeat these steps for another rule named Cribl – Detect Failed Logins to help detect and alert on failed logins. Query string:
Internal_CL
| where channel_s == "auth" and Message contains "failed login"
| summarize failedLogins = count() by user_s, provider_s
When we’re done we should have a list of active rules as below:

Sending some sample data over some time, results in a good number of alerts and incidents being created:

That’s it – done!
With superior data transformation capabilities, to structure events to fit in Azure Monitor Logs tables, and wide support for large number of Sources and protocols, Stream enables you to forward any of your security and operational data to Sentinel natively. Connecting to Microsoft Sentinel is, as you’ve seen, trivially easy!
—
New to Cribl Stream? Take our Sandbox for a drive!
If you have any questions or feedback join our community Slack– we’d love to help you out. If you’re looking to join a fast-paced, innovative team drop us a line at hello@cribl.io– we’re hiring!