
A friend of mine asked what Cribl Stream does, and I told her, “Our solution routes logs, metrics, traces, and other events from wherever they came from, to whatever needs to see those events, in real-time.” The product does more than that, but when she asked “What are events?,” I knew we had a different discussion ahead of us, and that I was not going to get to the use cases and features. Observability allows you to analyze the widest set of data possible to truly understand the security, performance, and general health of your environment. However, this can be a challenge for enterprises that already have an observability solution in place. Many tools make it difficult to send data to third-party analytics vendors: They want you to use their stack, even if it’s not the best choice for your business. You need an easier way to move data into any tool you want, so you’re always using the best tool for the job – and the most cost-effective one. Another challenge is that logging systems and other observability tools are at capacity. As data continues to grow 25%-30% a year, organizations face ballooning infrastructure costs and push up against their daily licensing limits. To mitigate these challenges, they engage in data gymnastics to make it all fit – day after day. Adding to this, long-term retention of data in analytics tools can be expensive and can slow the performance of queries and correlations. This is where Cribl Stream thrives!
It got me thinking; how many people (outside of the IT and cybersecurity world) really understand the data we’re dealing with in Stream? In modern IT circles, you might hear about the “three pillars of Observability.” Broadly defined, these are Logs, Metrics, and Traces. And what are events, then? What about alerts? Here’s my short glossary, in layman’s terms. We’ll define logs, metrics, traces, alerts, and events, among other things. In this blog, we’re going to look at the reality of observability in the 2020s, the key components, the challenges of growing data, and how to solve the problem.
It’s easy to get data into most log analytics systems (compared to traditional databases and data warehouses), and it’s typically easy to query it once it gets there – but unfortunately, that’s where the easy part ends. If you’re working with a tool that is optimized for fast search, the cost of retaining the data in that system grows linearly with retention time. For a deeper dive into the astounding cost ramp-up of indexing and storing data in your logging tool, review Why Log Systems Require So Much Infrastructure. Cribl Stream routes logs, metrics, traces, and other events from wherever they came from, to whatever needs to see those events, in real-time. Instead of sending everything to an analysis system, use Cribl Stream to customize the processing and routing of each data source type, optimizing, enriching, and routing the data based on its content, value, and purpose. Some data should be stored as metrics, other data in indexed log tools, or sent to low-cost storage, while some data should be dropped altogether.
What are Logs?
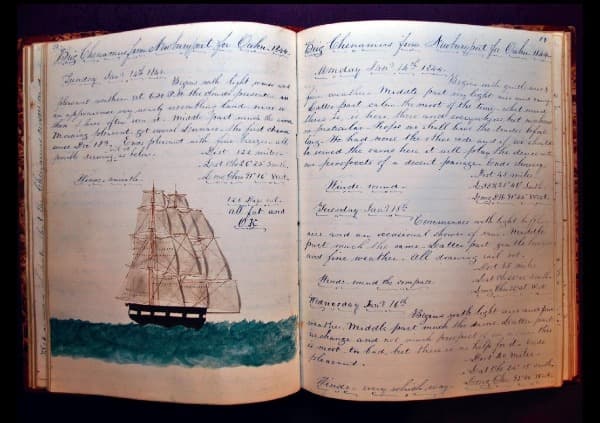
Think about a ship’s log, from back in the old wooden sailing-ship days. Several times a day, the captain (or someone assigned to the task) would note several standard things: Date and time, heading, speed, latitude, and longitude. They’d also note anything that might be of interest: “Today we ran out of rum,” or “The cook burned his hand and Dr. Smithson bandaged it up” – that kind of thing. For each time they wrote something down, this was a “log entry,” and the book they wrote into was the “logbook.” A “captain’s log” was the collection of all of that captain’s log books.
In the digital world, logs refer to information being written by the operating system and by the applications and processes running on that system. As with the captain’s log example above, each log event usually includes a set of standard things to report, like the date and time (a/k/a timestamp), the name of the system logging the data, severity (critical, warning, etc.), and application name. They also include the log messageitself. If I were to put a common web server log into plain English, the message might read something like this: “Bazookatron’s Web server #32 was just contacted by a web client in Iceland, who asked for a web page that does not exist. We returned a 404 error. This transaction took 18ms.”
In reality, the log message format is generally a lot less wordy than this. Log messages might be in key=value format, JSON format, CSV, or literally anything else. Translating one format to another, on the fly, can help get logs generated by one system into a completely different tool.
Instead of “log entries,” in the digital age we call these “log events.” Log events of a particular type, or those from the same source, are written to a log file locally – or sent across the network to another system. There are different approaches one can use in the transmission of the log events, but generically we can refer to the whole process as “sending log events to a log server.” And, just as you had a captain’s log (things logged by the captain), the digital equivalent of this includes Windows Security logs, web server logs, email logs, and so forth.
Who uses logs? It depends. Firewall logs are of interest to security analysts who are trying to see what devices are talking with the Internet. Application logs are of interest to an IT Systems Administrator who is trying to troubleshoot an issue going on. Application logs might even have valuable information for business people. They may be trying to see the number of new website hits immediately after a new ad campaign.
In summary: A log is comprised of a set of log events, typically from similar sources. These are stored in a set of log files – either on a server, or more commonly, on a log server.
What are Metrics?
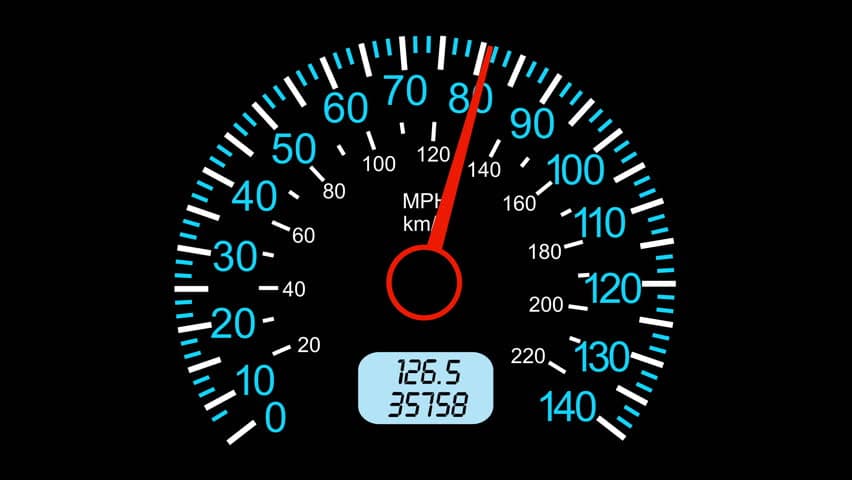
We all deal with metrics, all the time, whether or not we know it. How fast is your car going? 80mph is a metric. How fast can you type? 60 words per minute is a metric. What are the details of each home that sold in this neighborhood? The selling price, and the time on the market, are each metrics.
What these all have in common is that the result is numerical. There is a metric value, and there are one or more metric dimensions. Careful, a dimension here doesn’t usually refer to what you might think…a dimension is something you might filter by, or group by. If sales prices of homes are what you’re tracking, then yes, one dimension might be “currency: US Dollars.” But you might have additional dimensions, lie “Housing type: condo,” “Air conditioning: yes,” and so forth.
Every time you go for a medical checkup, a collection of metrics is taken: your height, weight, and blood pressure, to name a few. The nurse logs the time, as well as certain “dimensions” that are not numeric: your name, patient number, who you’re seeing, and the reason you’re coming in. Think of this collection of multiple metrics, with one set of dimensions, as a metric event.
In the digital world, in data analytics, logging metrics have a timestamp, a value, and one or more “dimensions”. In the digital world, those dimensions might include an application name, a host name, a payment type, or whatever else might have been of importance to the developer who wrote the code – and their product manager.
From computers and IoT devices, you might get metric events that include a) a timestamp; b) metric values, such as % CPU utilization, % memory in use, Load Average, and CPU temperature; and c) dimensions such hostname, location, department, and business function. Each of these can be used to analyze and report on whatever is being measured.
If you’re with me so far, it’s about to get a little strange. Log events (above) often contain metrics, though they are not metric events per se. In our captain’s log example, the logs included heading, speed, latitude, and longitude; all of these are metrics. And today, you might be looking at a log event from a web server, where the log event contains one or more metrics: number of bytes transferred, response time, etc.
You can also analyze logs to generate additional metrics: Imagine looking at all web server traffic over the last 5 minutes and reporting metric values for average response time, total bytes transferred, and average bytes transferred. The analysis of metrics over time in this way is called a metrics aggregation or just an aggregation. In IT operations, it’s often the analysis of metrics aggregations that tell you whether systems are working fine or working poorly. Aggregations are efficient because analysis across all of the individual metrics can be computationally expensive.
Both logs and metrics can both contain metric values, but log versus metric events are very different when being processed by computers. Metric events are inherently numerical, like floating-point numbers, and are always stored as such. This allows mathematical analysis of these metrics to be done very quickly. Log events are often stored as ASCII bytes (though this varies by the tool), and must be turned from a set of numeric bytes into a numeric value prior to analysis. The latter approach works, but the tradeoff is a pretty significant performance hit.
What are Traces?
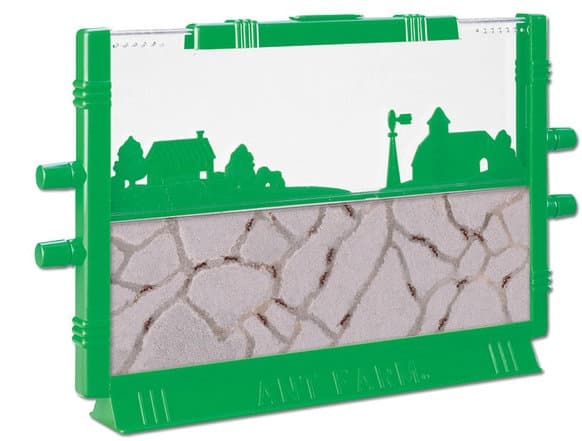
In the old days of project management, we had tools like Gantt charts which you might use in order to plan the total time for your project to complete. Imagine if the Gantt chart were created after the fact, to capture how much time was actually spent ramping up a project, working on various phases, and finally wrapping up. In application monitoring, a trace is like an after-the-fact Gantt chart that represents all of the things an application transaction spent its time on – all ordered over time from beginning to end. (The Tracing section, in the O’Reilly link below, has some great examples of this.) Ant farms are a good way to think about how traces work. They visually display the path an ant takes to do its work. Traces, similarly, show how different parts of an application perform their jobs.
Traces are typically used by application developers when looking to measure and identify the least performant calls in the code, or during troubleshooting to identify a dependency that’s behaving in an unusual fashion.
Generation of traces, and trace analysis, is often done by APM tools that are specifically designed for this task. There are also tools that use log analysis to generate a trace-like view of the world using log events, and still other tools that analyze sets of traces to look for outliers and program execution anomalies.
For another description of these terms, refer to this excellent write-up by Cindy Sridharan, courtesy of O’Reilly.
What are Events?

So, we have log events, metric events, and now traces (traces are made up of spans, which can be thought of as events, which have a parent-child relationship).
Are there other kinds of events in IT and security? Absolutely yes!
The most common type of event for computers to pass (other than logs/metrics/traces) is an alert.An alert is any notification sent from one computer to another. Any given alert may be security-related, or not; it may indicate something is broken, or that something is no longer broken. An alert might be sent by SNMP trap, or by REST API call, or by sending a net-new log event. Even email and text messages are used to send alerts.
Something you might not think of as an event is: creating a file on a filesystem or creating a file object in an object store. This is an event, in a way. First, there was no file – now there is. If your system needs the contents of that new file, for analysis purposes, there are various ways to detect the new file, read its contents, and send those contents to another destination for further analysis.
Summary of Logs, Metrics, and Traces With Observability Data
So, Cribl Stream deals with log events, metric events, traces, alerts, and other kinds of events. It gets that data, one event at a time, from wherever it started, to all the places where you need it. All the things Stream does in between receiving the data and delivering it somewhere else? That’s a topic for another blog. In the meantime, if you want to play around with Stream, take one of our interactive Sandbox courses.