

Enriching data with lookups has proven its value to many in the Cybersecurity industry, solving many challenges by simply having a list of specific parts of a database (or a whole flat-file database) loaded as a CSV file. Some lookup tables are simple and easy to apply to a project. Others are larger or more complex and require a robust solution that can handle the reads/writes, relationships, arrays, etc. But most lookup tables work best when they can be cached in memory, which performs more efficiently than reading a very large file from a disk. For these cases, Redis and other in-memory/cache data solutions are recommended.
In this blog, I would like to look at that particular challenge from a different and simpler perspective. Cribl Stream’s native Lookup Function will offer the same value and performance for smaller data sets, using CSV files. CSVs are normally limited to 1,048,576 rows, but the reality is that there is no limit, depending on what program you are using to open your CSV file.
In our case, Stream’s native Lookup Function will perform well reading from these files, but we should consider the size of each CSV file being transferred among Workers, and the frequency we update them among Workers. Let’s assume that you have files larger than 10GB each. You’re considering reducing the size of each file and/or the number of files being used, but you have the need for larger data sets. Using a more scalable solution such as Redis (which is also fully integrated with Stream via the Redis Function) will better distribute your data, without your having to worry about performance hits in your Stream pipelines or overall performance.
The goal of this blog is to ensure a simple solution for SOC analysts who do not yet have their entire infrastructure matured to a level where they can use more complex tools in their operations. My intention is to have your growing environment ready to send data into your SOC enriched, accurate, compliant, and ready to be used by your system of analysis.
In this example, I will be using Splunk Core, and no other tool will be necessary (no need for Splunk ES, Splunk Security Essentials, etc.) Just a plain-vanilla version of Splunk, benefitting from one single Stream Function.
These tools are extremely important for your SOC operations, but even if your organization doesn’t have them yet, I want to have your data ready to be used now, and compatible for when you onboard such tools in your SOC – making your data more valuable, reliable, and your single source of truth.
We’ll cover three simple steps to getting Threat Intelligence into your environment:
Ingest your Threat Intel from your source of choice, by creating scheduled REST API script collectors.
Store these indicators in a local lookup file in Stream (Leader and Workers).
Create a pipeline that will correlate your incoming traffic with these indicators, and then add fields to your data.
The Threat Intelligence tool I’ve chosen for this exercise was MISP (Malware Information Sharing Platform), an open-source Threat Intelligence aggregator that is part of TheHive Project, which shares information among several organizations around the world. But you may use whatever Threat Intel aggregator of your choice – just adjust the formatting according to your tool of choice, by converting them from JSON, Common Logs, or Text to CSV format. This conversion is simply done by using SED/AWK commands via a script for each Threat source you want/need to observe.
The Environment
1 Stream Leader
2 Stream Workers
1 MISP Server (or any Threat Intelligence source)
1 Splunk Core
For this simple example, we will deploy our Stream environment and create script collectors that will GET a list of threats specifically tailored for Bro/Zeek logs (Threat Export).
Deployment of MISP is beyond the scope of this document; see the MISP documentation.

MISP – Events list
Once your Threat feeds have been selected, you may choose which ones to apply to your solution.The use case I’m trying to demonstrate is to download a list of indicators exported from Bro/Zeek logs. MISP will give you several lists that can be imported from Stream Collectors and placed as a CSV file in your local lookups directory, or integrated with Redis for larger data volumes and/or faster results.
Along with MISP, Cortex is the perfect companion for TheHive. TheHive lets you analyze tens or hundreds of observables in a few clicks, by leveraging one or several Cortex instances, depending on your OPSEC needs and performance requirements. Moreover, TheHive comes with a report template engine that allows you to adjust the output of Cortex analyzers to your taste, instead of having to create your own JSON parsers for Cortex output.
Cortex, open-source and free software, has been created by TheHive Project for this very purpose. Observables – such as IP and email addresses, URLs, domain names, files or hashes, etc. – can be analyzed one by one, or in bulk mode, using a Web interface.
Note that this exercise won’t check live against a list of providers such as MISP. To do that on every observable would create thousands of API calls to these providers, and degrade performance. If you want to validate a specific observable, then Cortex would be a good starting point for your SOC.
The Problem
Security Analysts working on SOCs nowadays rely on several tools to perform their threat hunting and vulnerabilities investigations. Some of their sources are received through an a list aggregator and others via a simple REST API call. The challenge is that having API calls for each element that needs to be analyzed (IP addresses, URLs, Files, File Hashes, emails, etc.) will create a lot of network traffic and a delay just to analyze (query) each element to an external Threat List provider.
We can simply solve that problem by creating a local list (or database) containing all – or at least some – known threats available for each segment of security we want to validate against, and check our network traffic observables against this “database” via a local lookup table.
Note: Local lookups are great for small data sources. For larger environments, consider the use of an external database provider like Redis, which will provide a much more reliable result than a simple local lookup using CSV files.
The Solution
Cribl Stream can help you to provide data enrichment and add value to your SOC by analyzing the elements on your data sources, comparing them with a local lookup table, and adding any threats found to your log before it gets to your system of analysis.
In this example, we have a small Splunk deployment without any security applications dedicated to correlate indexed data, collection of Threat Intel, etc. This environment has only a single Splunk Core deployment with no Prime applications deployed (i,e,: no Splunk Enterprise Security).
Following our three steps mentioned above, let’s start collecting data from our Threat Intelligence source via a REST Collector using a script:
There are two methods we can use:
REST Collector Script (bash), copying the results to each Worker, and to the Leaderof the group hosting the lookups.
Using Git to simply Commit & Deploy the scripts, letting Stream’s Git integration update the workers.Both can be scheduled in Stream. However, a Commit & Deploy in a worker group might cause some loss of work from other Stream users who have not yet committed their changes.
REST Collector Scripts:
The lookup files – in this case, the CSV files gathered from our MISP source via a REST API call – are stored on all Workers in the following directory:
/opt/cribl/data/lookupsAnd on the Leader, the lookup files are stored on the Worker Group containing the assigned Workers:
/opt/cribl/groups/GROUPNAME/data/lookupsNote: For this example, our Worker Group’s name is “Security.”
We need to create a directory on your Stream Leader and Workers to host the temporary files collected via the REST, convert them into CSV files, and place them in the proper lookup location(s).You can clean these files manually, or via a local cron job, but they will be overwritten every time the REST collector script runs
Create a directory named ‘tmp’ in /opt/cribl/:
/opt/cribl/tmpAssign the proper permissions for the cribl user (or whichever user owns the cribl directory and runs the collector scripts):
chown -R cribl:cribl /opt/cribl/tmpThe script will collect the Threat Intel, convert it to a CSV format based on this source (text / headers), and copy the files both to Workers and to the Leader at the above locations: /opt/cribl/data/lookups for the Workers and /opt/cribl/GROUPNAME/data/lookups/ for the Leader.

REST Script Collector and conversion to CSV format
From our Threat Intel source, we will use ready-to-consume “exports” tailored for Bro/Zeek. f other sources were chosen, you’d need to configure a different Event Breaker, parsing and conversion accordingly.There are multiple Threat Intel options for Bro/Zeek in MISP, but for this example, we will use only these:
https://10.0.104.105/attributes/bro/download/iphttps://10.0.104.105/attributes/bro/download/urlhttps://10.0.104.105/attributes/bro/download/filehash
Script for IP Intel:
curl -k \
-H "Authorization: uxZ4XViSjSC7n3qRqJT68npE6HLXV9z0zeX7PDDq" \
-H "Accept: application/json" \
-H "Content-type: application/json" \
https://10.0.104.105/attributes/bro/download/ip > /opt/cribl/tmp/MISP_Threats_IP.txt
#List Results on the collector
cat /opt/cribl/tmp/MISP_Threats_IP.txt

#Clean up the file and convert to csv format
sed -e 's/#fields\t//1;s/\t/,/g' MISP_Threats_IP.txt > MISP_Threats_IP.csv

#Copy the new csv to workers
sshpass -f .sshpasswd scp MISP_Threats_IP.csv cribl@10.0.109.237:/opt/cribl/data/lookups/
sshpass -f .sshpasswd scp MISP_Threats_IP.csv cribl@10.0.109.248:/opt/cribl/data/lookups/

#Move the new csv file to leader
mv MISP_Threats_IP.csv /opt/cribl/groups/Security/data/lookups/
Note: I’m using sshpass to copy the CSV files to the workers without typing the password, and placing the destination host password on an .sshpasswd file for security purposes. You may easily use SSH Keys for this method if you wish.
You may schedule the script to collect new Threat Intelligence in intervals defined by your security organization.

Scheduling the REST Script Collector
Git with Script Collectors
The process for using Git is the same as we used above, which simply copies the files to each host. The caution here is that after using a Git commit/deploy command, all Workers will execute, and if any other users are creating or editing their work in Stream within the same Worker Group as you scheduled your script to run, that could cause a loss of their work.
Script for Intel – Using Git
curl -k \
-H "Authorization: uxZ4XViSjSC7n3qRqJT68npE6HLXV9z0zeX7PDDq" \
-H "Accept: application/json" \
-H "Content-type: application/json" \
https://10.0.104.105/attributes/bro/download/ip > /opt/cribl/tmp/MISP_Threats_IP.txt
#List Results on the collectorcat /opt/cribl/tmp/MISP_Threats_IP.txt
#Clean up the file and convert to csv formatsed -e ‘s/#fields\t//1;s/\t/,/g’ MISP_Threats_IP.txt > MISP_Threats_IP.csv
#Move the new csv file to leadermv MISP_Threats_IP.csv /opt/cribl/groups/GROUPNAME/data/lookups/
#Commit/Deploy using GIT/opt/cribl/bin/cribl auth login -u admin -p LEADERTOKEN;/opt/cribl/bin/cribl git commit-deploy -g GROUPNAME
Now all workers will have the same version of your latest CSV from a single command line.Make sure to create a separate CSV file for each type of Threat Intel you are getting from MISP and follow the same steps mentioned above.

Lookup files are present on Leader and all Workers
We now have the Threat Intelligence lists available for the Lookups, being dynamically updated depending on your scheduled scripts.

Dynamically created lookup files ready for consumption
The next step is to bring the data you want to analyze for Threats into Stream using the normal process (Source, Event Breaker, etc.)
Here, our Source will monitor a Filesystem containing all .log files from Bro/Zeek.
Create a simple Event Breaker rule for the source we are onboarding (headers), and extract its fields for easy manipulation by our selected system of analysis (Splunk):

Event Breaker rule creation

Event Breaker rule creation
Now that we have our data source configured with its Event Breaker rule, we can capture a sample file and start working on our Threat Intel Pipeline for Bro/Zeek traffic.
The Pipeline
We will create one pipeline:
Threat_Intel_Bro
Threat_Intel_Bro is our main pipeline. It will match any threats on our Threat List if they exist in our source (Bro/Zeek logs). We are working only with Conn, http, and files Extractions for Bro/Zeek traffic from our Threat List aggregator (MISP). When we find a match (using our Lookup Function), we Eval a new field, bringing the value of the IOC (Indicator of Compromise) found for the observable we are analyzing – IP address, URLs, File Hashes – into our data source.

Threat_Intel_Bro Pipeline
In our Pipeline, the Functions are simple. The first one is “Log Type,” which is a Stream Eval Function responsible for “tagging” all traffic coming into Stream from several log files (conn.log, http.log, filehash.log, etc.)
There are several ways to filter this data in Stream. I chose to use a JavaScript expression as a filter, and to add a field to each event, for this task.
__source.substring(__source.lastIndexOf("/")+1,__source.indexOf(".log"))
Log Type – Eval Function
Once we segregate our log types, it’s easy to start performing our lookups and enriching the data with valid Threat Intelligence on the fly.
I organized each group by Threat type. Remember you may have as many Threat types as you need. You might also have different queries not just on the attributes of the Bro/Zeek export, but on all events based on different criteria and capabilities offered by your Threat Intelligence of choice.
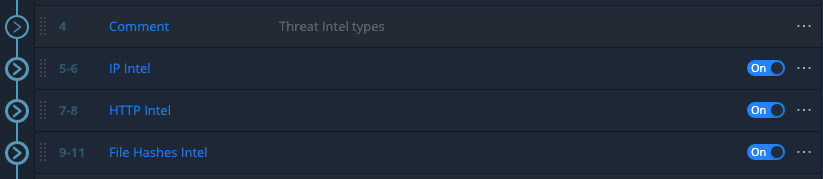
Threat Intelligence by type
Inside each Threat type, we match with our lookups for the values we have in our Bro/Zeek logs, filtering them on each lookup function by their log type:

Log Type – Eval Function
The results start to appear in our Preview, using the sample file previously captured from our data source (Bro/Zeek logs).
Applying a filter on our sample window, we can concentrate only on the IP Intel. Because we’ve created the logtype field in our first Eval function In this Pipeline, we can easily use this expression on our Filter box:
logtype=='conn'
Our lookup will match id_resp_h (destination IP) to a field named indicator from our lookup table MISP_Threats_IP.csv. For this example, we will create three fields: Threat_found, Threat_source, and indicator_type.
These fields will provide value to a SOC analyst receiving this data, without having to perform any extra correlation. It will also help enhance the security posture of this organization with very little effort.
Note: This example is very simple. Threat Intel can bring in any fields with deeper information about each indicator, and many formats such as JSON, CSV, Common Log Format, etc.
Now we simply need to repeat these steps for each threat type we need to check.
The next threat type is URL, using the http.log file (from Bro/Zeek logs). We want to add a field referencing the Threat Found, if available from the Publisher (in this case OSINT, CIRCL, or MISP). This information will help the security analyst to know about the threat, and to validate with the international security community its risk, and how to mitigate and/or avoid it. This may be (if applicable) an analysis against frameworks such as the MITTR ATTACK or any other Threat intel provider (e.g.,Virus Total).
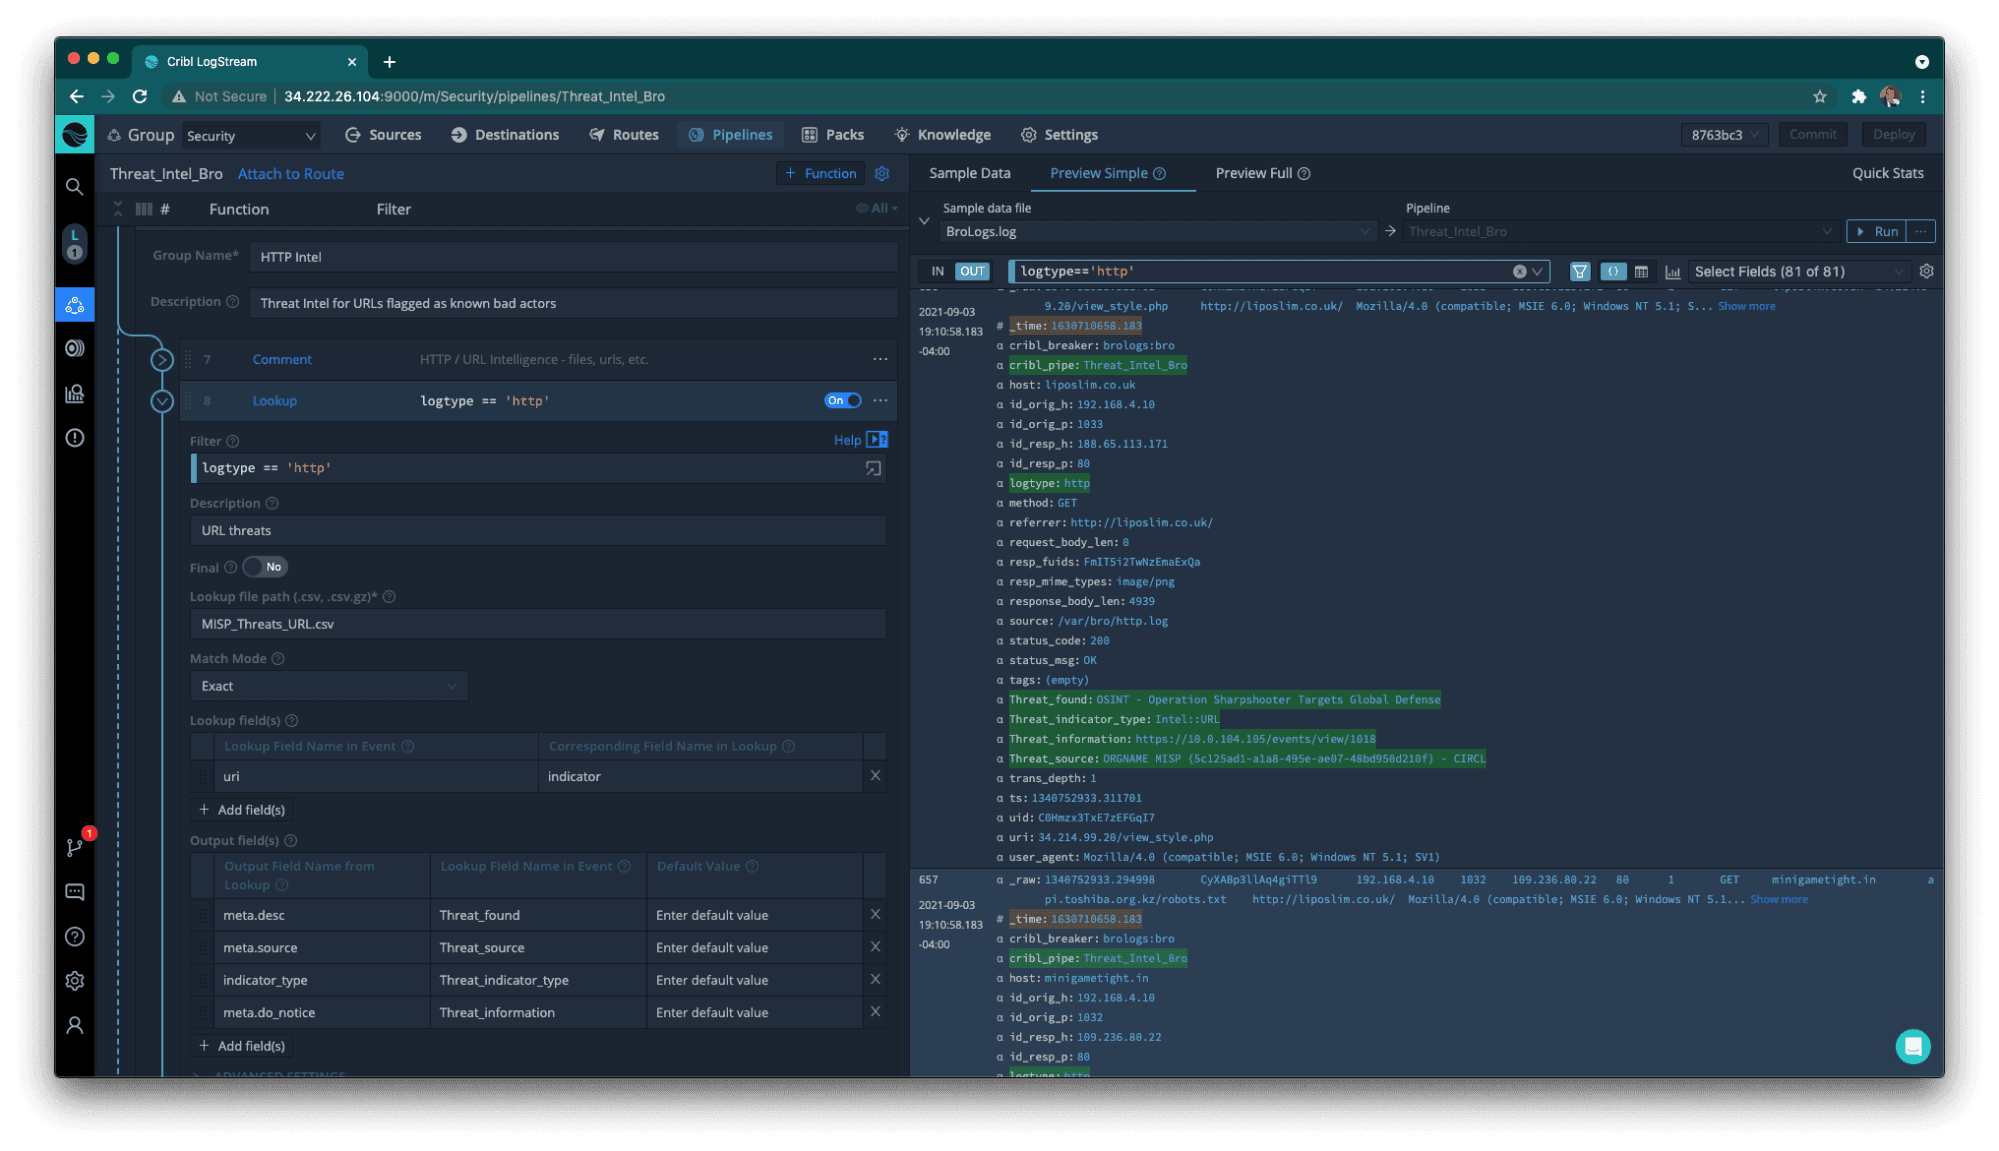
Threat Intel for URL with external reference to the IOC
The File Hashes threat type will require one extra step, because file hashes may have different cryptography algorithm types (MD5, SHA1, SHA256, or others). In our case, we have only MD5 and SHA1, but I’ve created a lookup filter for each field based on the log type (files).

Matching MD5 and SHA1 hashes
Now we have matches for two hash types and all data from Bro/Zeek logs, with log type files is checked in the Pipeline.

What Have We Achieved?
We were able to get Threat Intel for IP, URL, and File Hashes; create a REST Collector to bring this data into Stream; convert it to CSV format; and place a copy on each Worker’s …/lookups/ directory (we used two methods for that).
We also created a Pipeline matching each event on our Bro/Zeek logs with the Threat Intel we have dynamically available. We enriched the traffic and made it ready for Splunk consumption.

The Splunk Component
Now that we have our data properly enriched, we should think about its destination. In this example, our environment has a single instance of Splunk Core – no additional applications are installed, just pure simple Splunk out of the box.
Our Pipeline has sent the proper data and extracted the proper fields for Splunk making them “tstats”-ready!No props.conf or transforms.conf were used in this example, just good old Cribl Stream saving the day.

Threat Intel data lands in Splunk Core
We haven’t used a Splunk Prime app, such as Splunk Enterprise Security, although we may need this in the future.
In order for Splunk Enterprise Security to work properly, we need to make its data CIM (Common Information Model) compliant, by following rules found on the Splunk Data Models definition.
For this example, we will send our “bro logs” data, properly parsed and enriched with Threat Intelligence acquired from the MISP framework, to the Splunk index named “bro”, and this index will be ready to be added to the Network Traffic Data Model in the future.
This data will be ready when this fictitious Company decides to implement Splunk ES, and their SOC will be ready to react to Notable Events when properly generated.
In order to achieve that, we need to validate the data source in Stream by adding another Pipeline. Here, an optional Eval function will translate the field names to those properly defined in Splunk Network Traffic Data Model. It will also add the necessary tags for this Data Model to work properly (network, communicate).
Note: The Splunk CIM compliance process needs more than just field renaming to operate properly. The tag field represents different data sets within each data model, and in order to be implemented correctly, Event Types (Splunk searches) are created to classify these events according to each data model data set.
In this example, we are sending data only to the Network Traffic data model, and its tags can be either network or communicate. If we want to send data to another relevant data model, such as Intrusion Detection, we would have different tags (ids, attack). If we also decide to send this data to the Network Sessions data model, the tags would be Start, end, DHCP, and VPN. We would then need to create more segregating Functions within the CIM Pipeline to filter the data per each specific data set within our source, and to apply the correct tag before sending it to Splunk.
Covering the Splunk CIM for all data models on specific sources is outside the scope of this blog post. For more details, follow the reference
By replacing the field names with the ones specified on the Splunk Network Traffic Data Model, the data is ready for consumption by Splunk ES upon its arrival. All dashboards created with this data should function properly.

Note: In Splunk, you can create field aliases for these old field names, if you need to access historical data.
In our Bro/Zeek files.log, the source and destination IP addresses are named differently. So we need to create a second Eval function filtering by this log type, rename these fields properly, and then remove the old field names (which avoids data duplication and provides data reduction in Splunk).

Let’s create a simple dashboard in Splunk with the enriched data provided by Stream:

Splunk dashboard with real Threat Intel from Cribl Stream
This was a very simple way to demonstrate how flexible Cribl Stream can be, and how quickly and easily you can have a SOC functioning and providing valuable Threat Intel to security analysts who have not yet deployed Splunk ES or Splunk Security Essentials.
This solution is not replacing these tools, but helps to give you a kick-start in your Network Security operations.
There are many other solutions to explore with Stream, and this data can be easily routed to your own system of analysis if you are not using Splunk Core today.
Final Accomplishments
We were able to receive index ready fields extracted in Stream and made them ‘tstats‘ ready in Splunk, we also created a CIM-complaint Pipeline following the Network Traffic Data Model specifications from Splunk. Finally, we were able to reduce our ingestion by 39%.
Note: CIM compliance requires attention on the Splunk side, tags may be overridden by Splunk if the Splunk CIM compliance App is installed.
Summary
I kind of fooled you. You can accomplish this without Redis, but now you really should consider using Stream’s fabulous Redis Function and expand your Stream environment knowing Cribl Stream is capable of making your life better.
The fastest way to get started with Cribl Stream is to sign-up at Cribl.Cloud. You can process up to 1 TB of throughput per day at no cost. Sign-up and start using Stream within a few minutes.