

Cribl Stream enables you to get multiple data formats into your analytics tools quickly. You can use Stream to ingest data from any observability source or REST API, and easily transform and route that data to whatever analytics tool you choose.
This blog will walk through how I used Stream to ingest 3D printer data from OctoPrint, using Stream’s REST and filesystem collectors. And how I then transformed and routed that data to OpenSearch. The basic principles are the same for RepetierServer or Ultimaker.
OctoPrint
OctoPrint is a print server with a streamlined Web UI, designed for hobbyist 3D printer users. It gives a user the ability to upload their G-Code to their 3D printers remotely. It also allows you to do things like preheat your printer and get historical data on your prints.
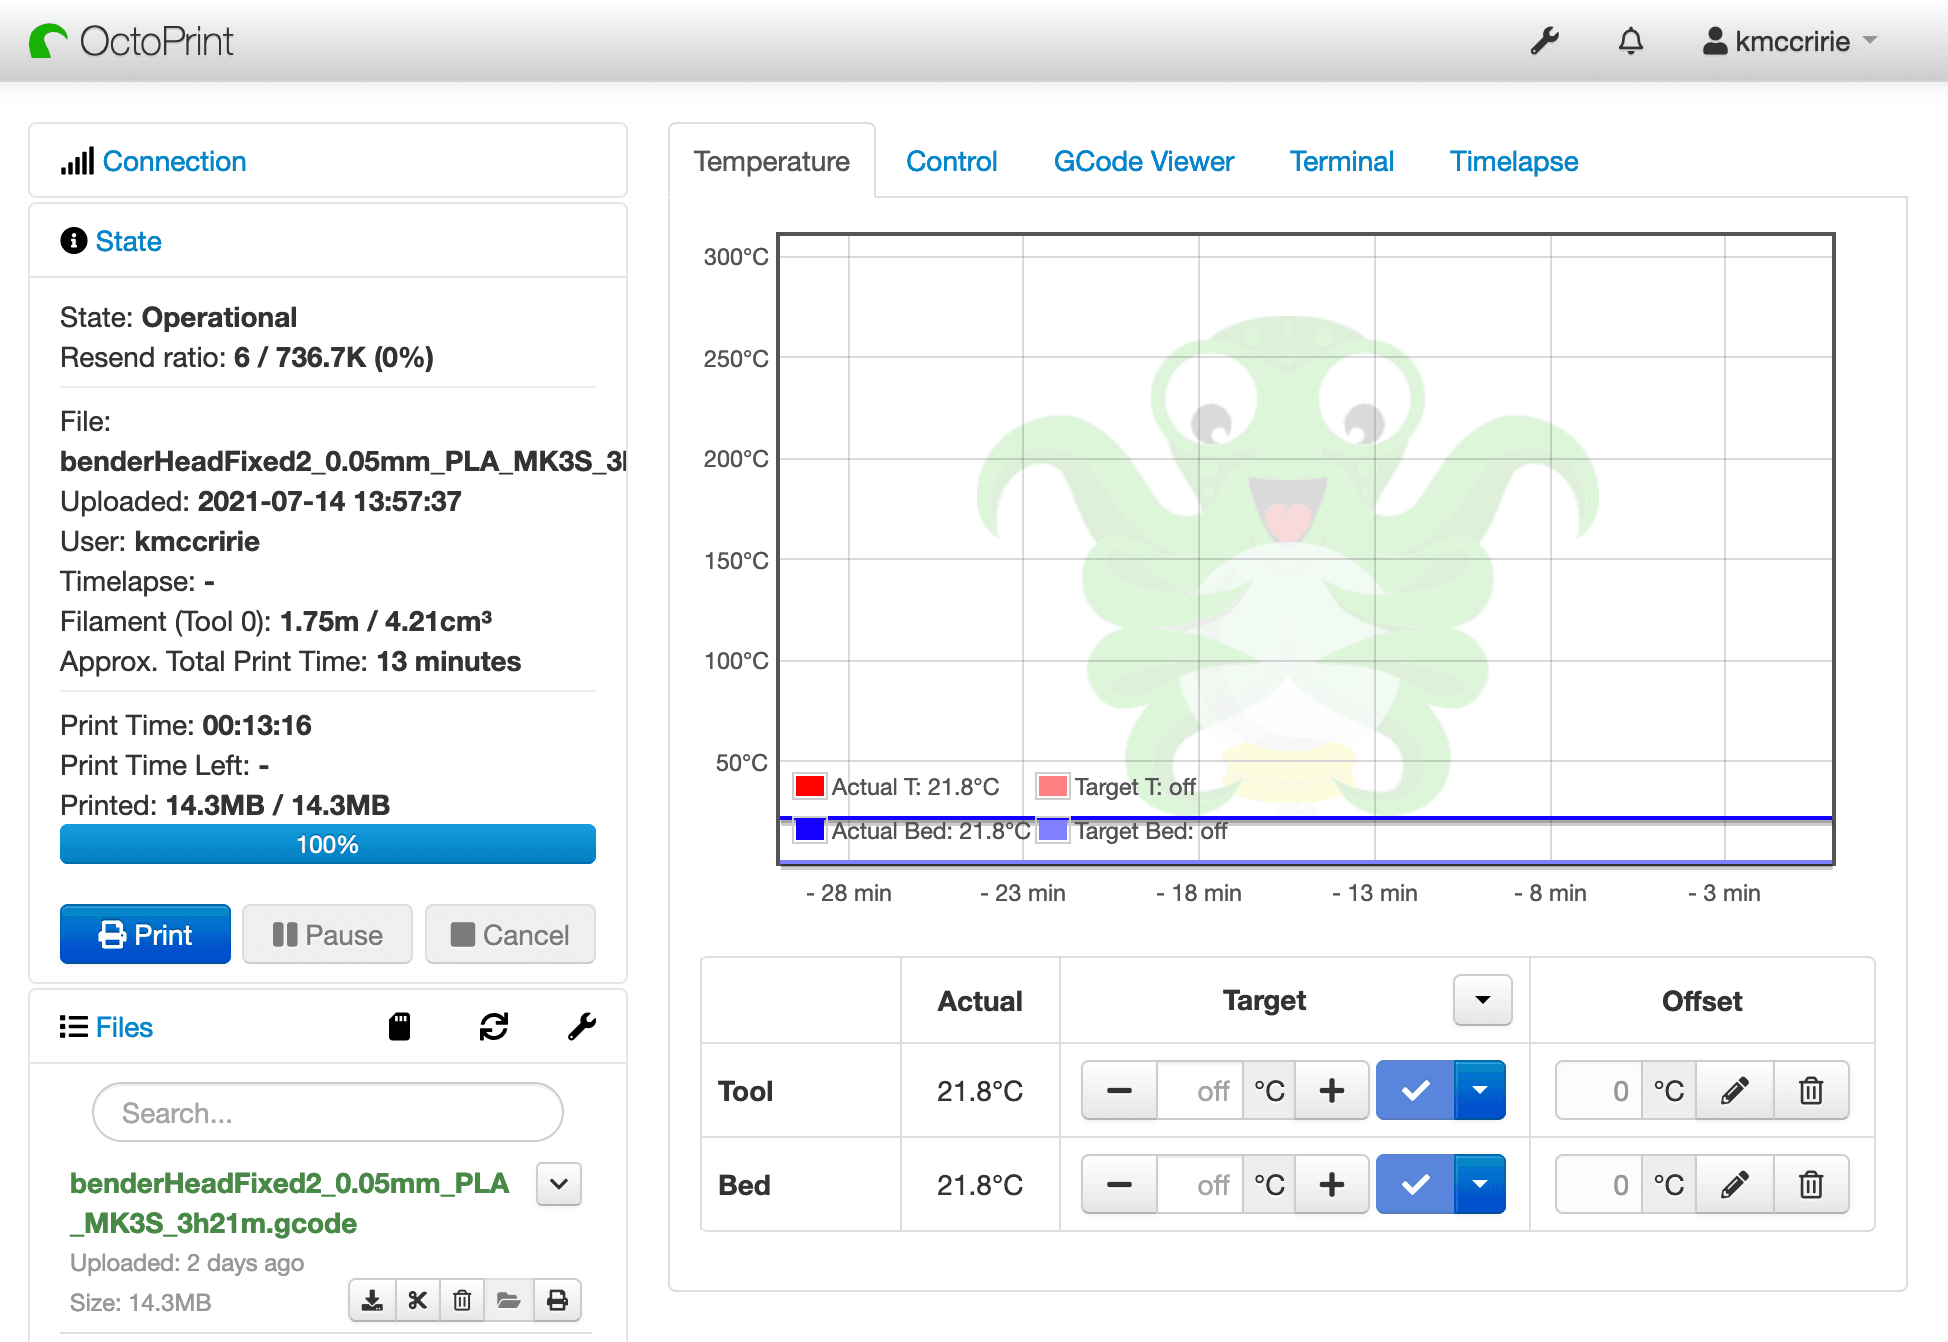
On top of the other things that a hobbyist might be more interested in, it also has an extensive REST API. We can use the REST API to retrieve data on jobs, plugins, printer state, etc. We can also get the octoprint.log, which is OctoPrint’s main application log. This log contains information on everything happening while OctoPrint is running.
We will examine how we can ingest printer State data via the API, and the OctoPrint logs via the filesystem. Then we will create a Pipeline to manipulate these logs to be ready for ingestion into OpenSearch. Finally, we will route these logs to OpenSearch, and search and visualize them there.
Stream REST Collector
Using the Stream REST collector, we can get data from OctoPrint’s REST API. As previously stated, we are going to get the printer State using GET /api/printer.
In Stream, go to Collectors → + Add New.
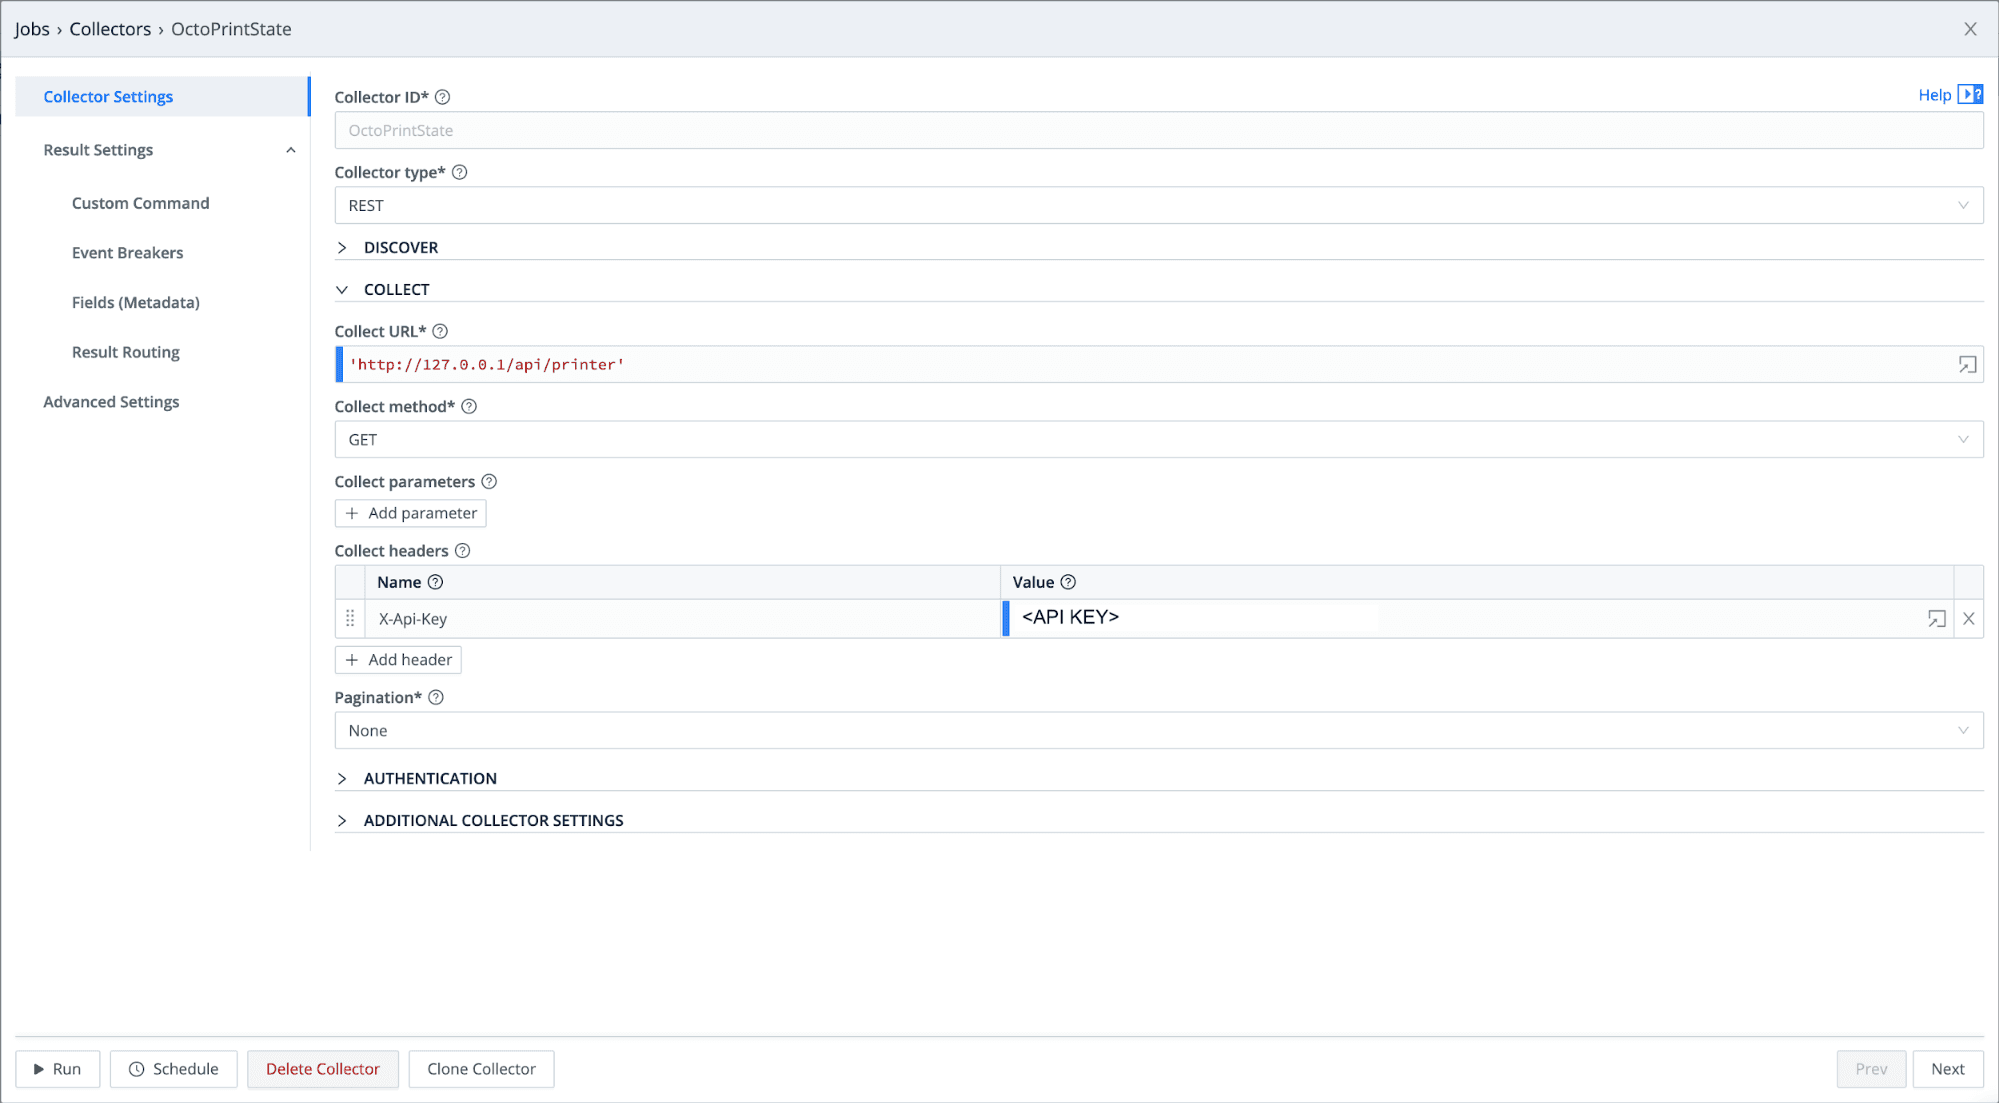
Give your collector a name, and select REST as the Collector Type.
Set the Collector URL to the OctoPrint server IP plus the path /api/printer.
Select the Collect Method to GET.
For authentication, we are going to use a header field called X-Api-Key. You can get this API key from the OctoPrint UI under settings → API.
Your configuration should look like this:
We are going to add one last configuration under Fields (Metadata). We will use this added field in our filter to route this collected data to OpenSearch.
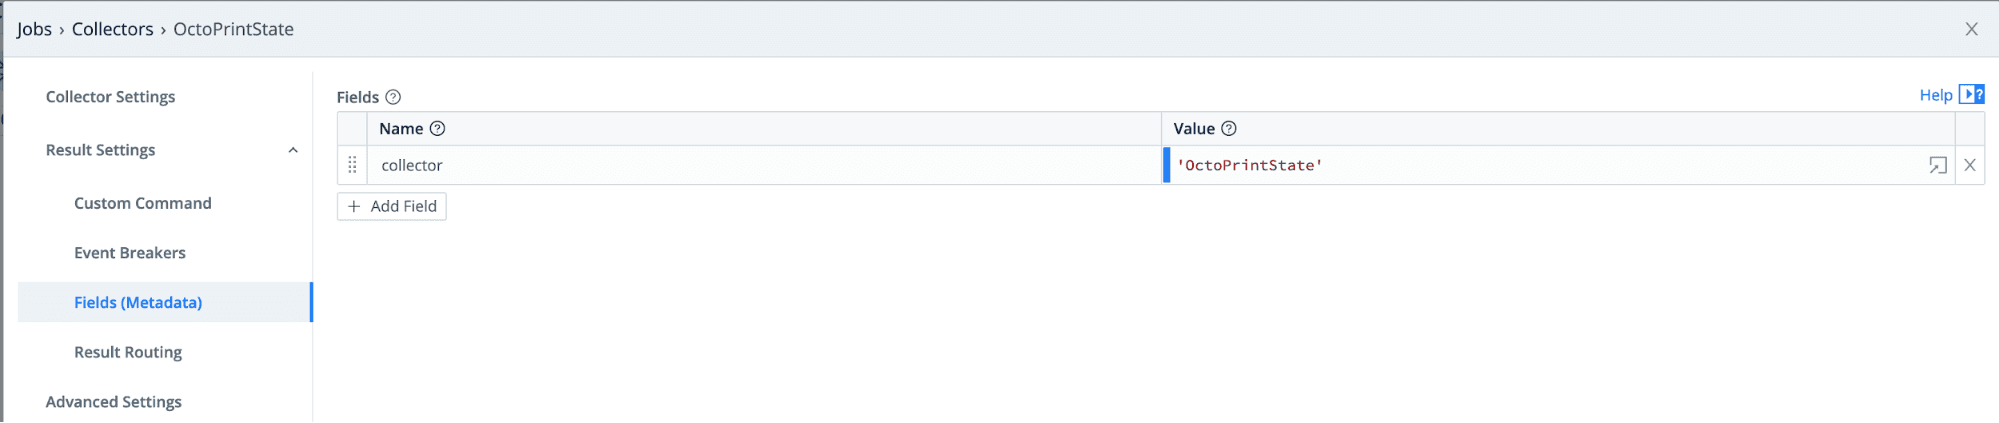
Click on Fields (Metadata) and add a field
collector = 'OctoPrintState'Next, click Save, and let’s run this new collector to save a sample file to use in developing our pipeline.
Click Run on the newly saved collector. In the resulting modal, select Preview, and then select Run. You should see the OctoPrint State results from the API call.
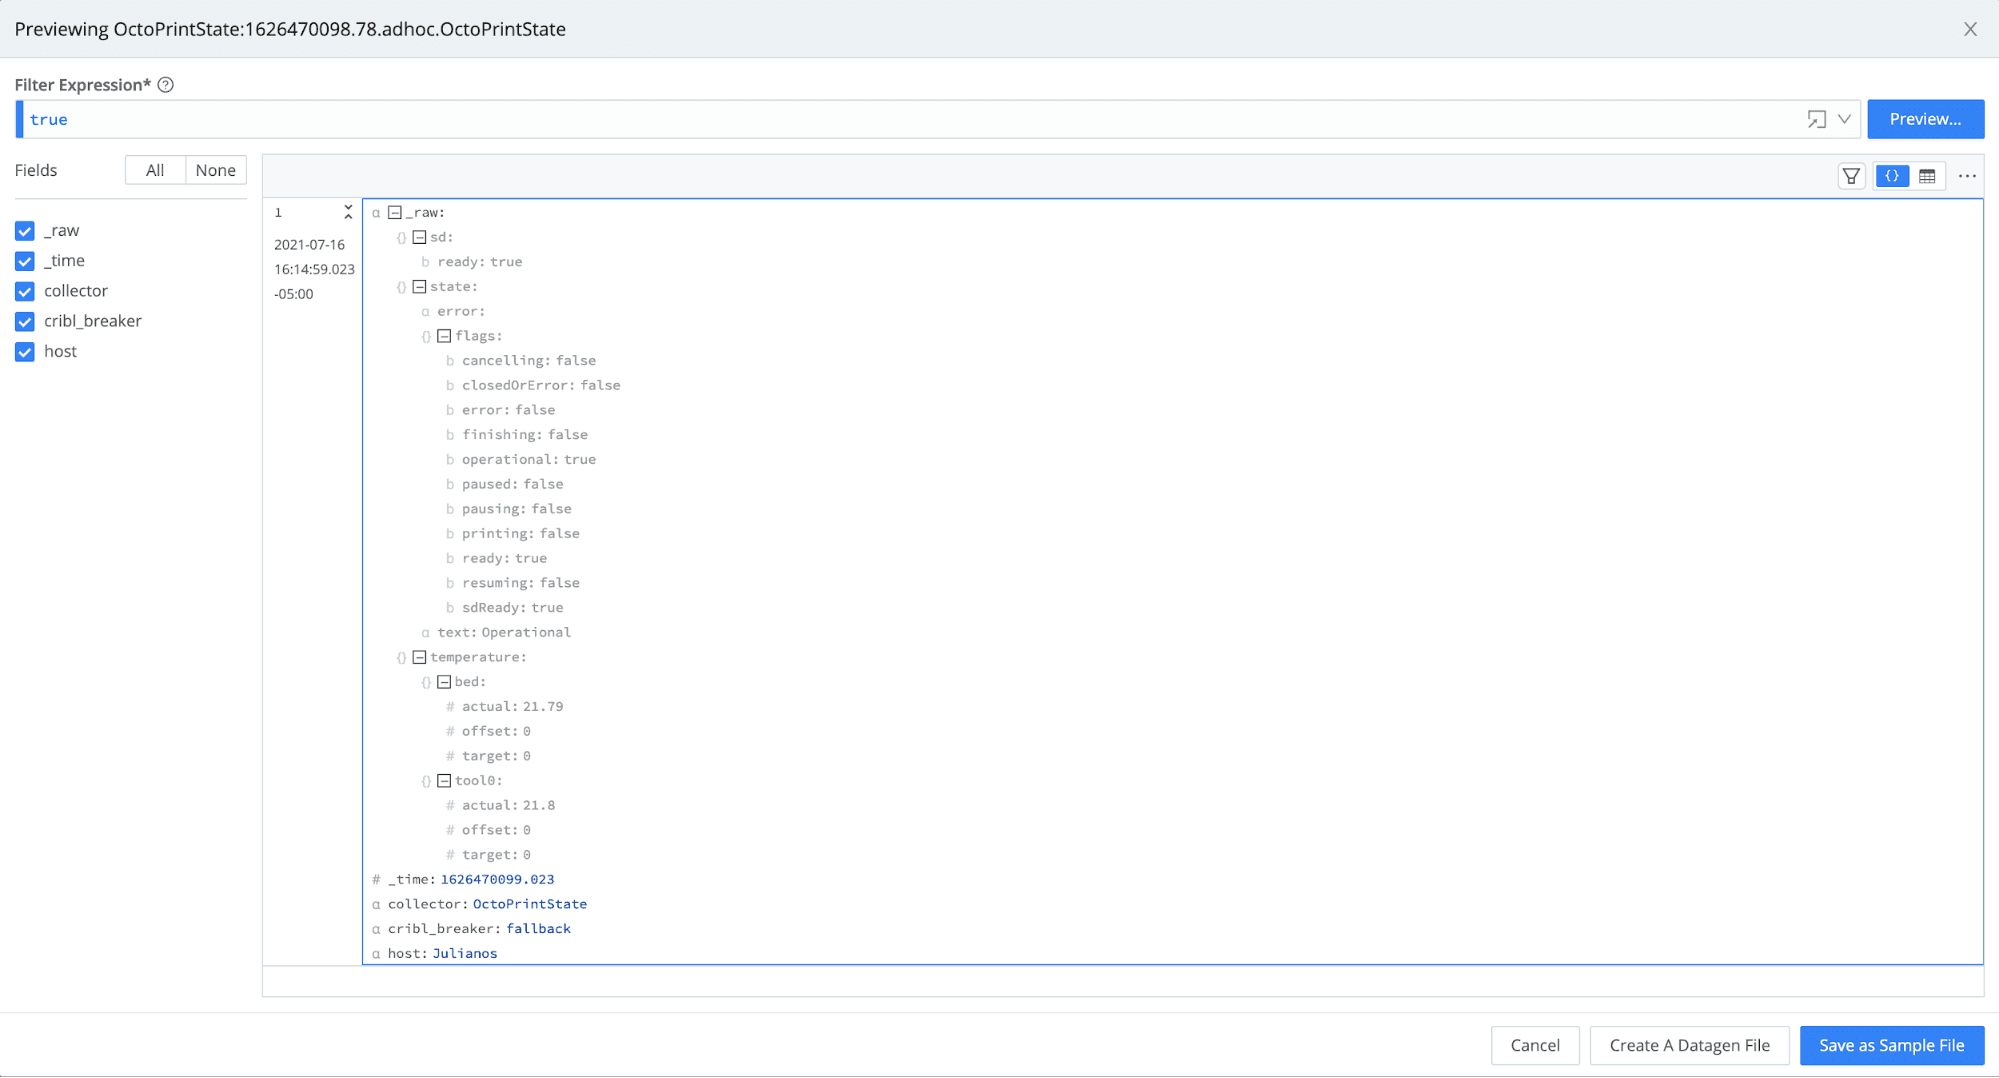
Click on Save as Sample File, and save.
Lastly, we will also set this up on a schedule to get state information every minute. Click the Schedule button and set the chron job to run the API call every minute.
Stream Event Breaker for octoprint.log
Before we set up the Filesystem collector to ingest the octoprint.log, we will need to set up an Event Breaker to properly break the events when collecting them in Stream.
Go to Knowledge → Event Breaker Rulesets → + Add New.
Name your ruleset
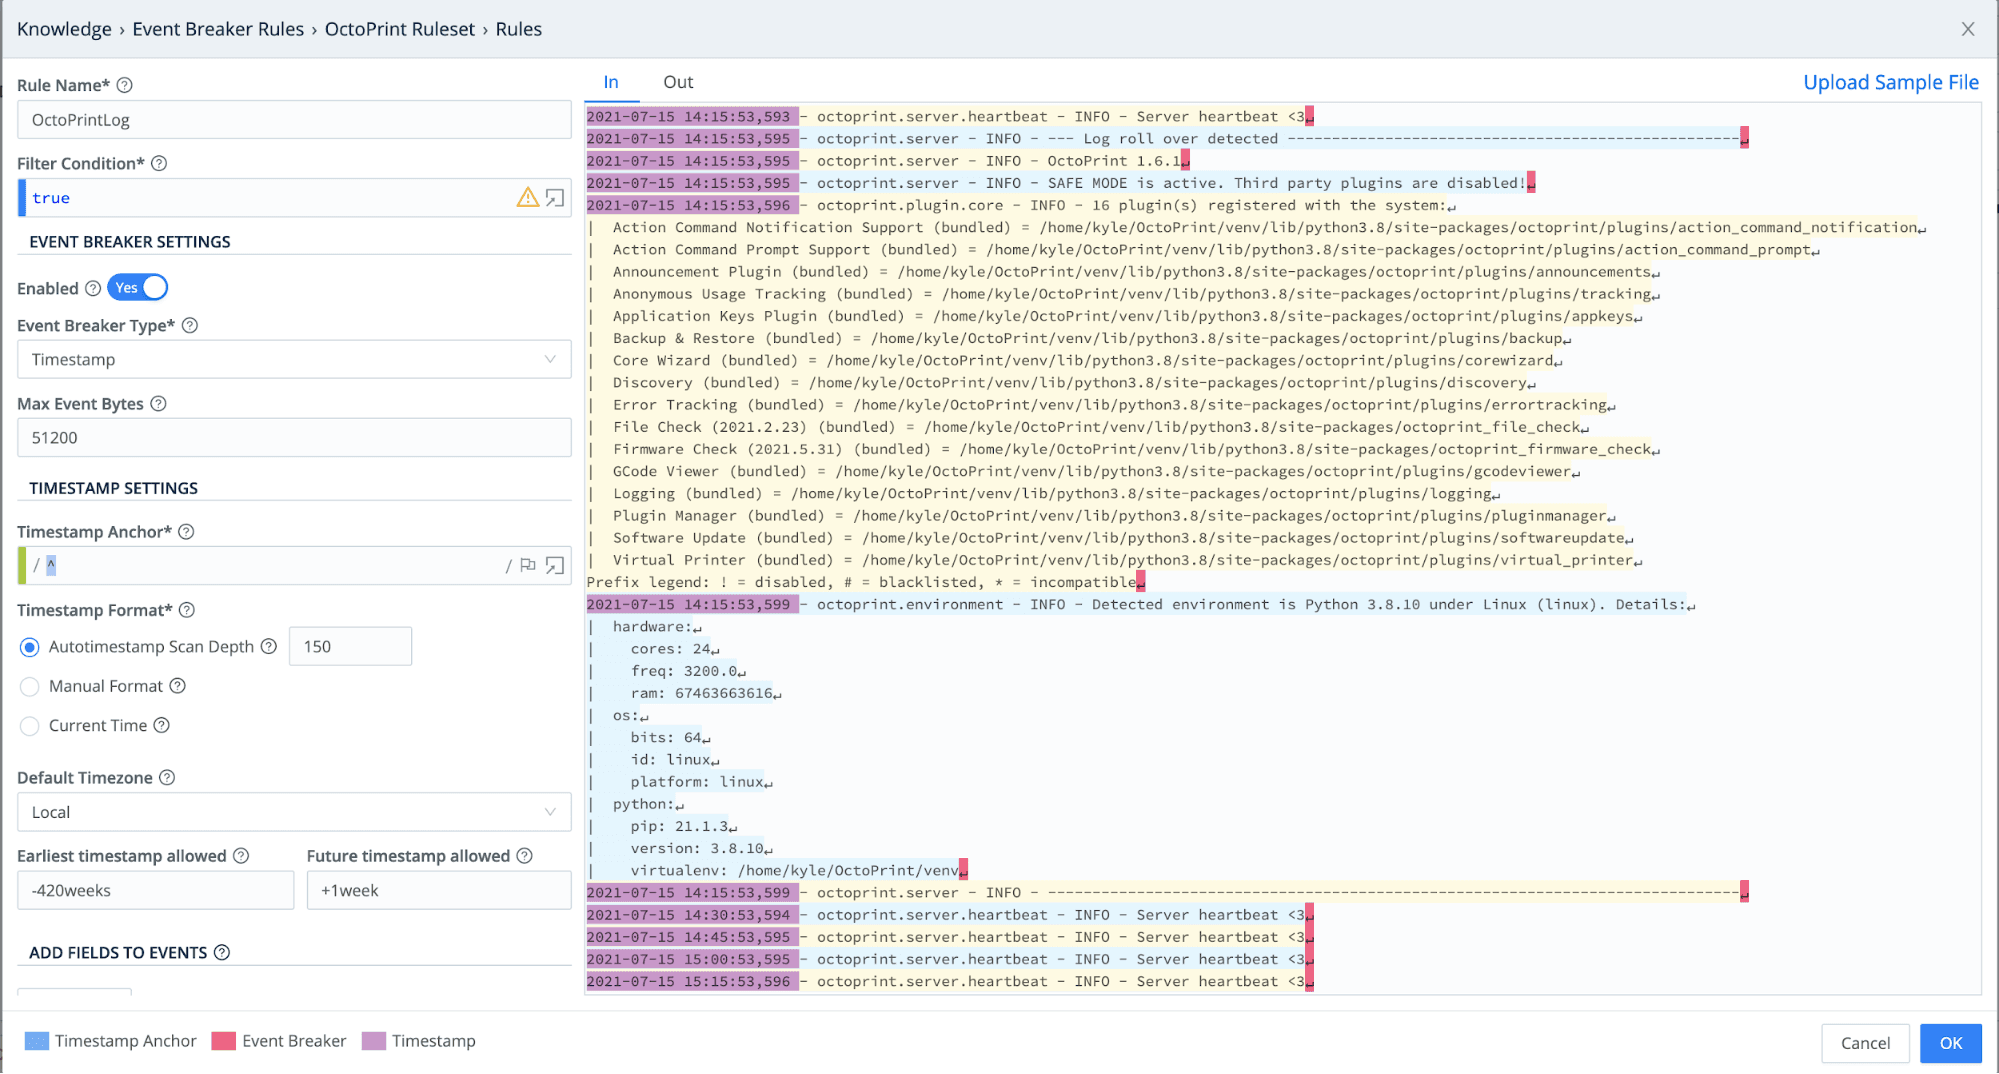
OctoPrint Rulesetand click + Add Rule.Name the rule
OctoPrintLogand, under Event Breaker Type, select Timestamp.You can upload or paste a sample of the octoprint.log to verify the Event Breaker is working correctly. It should look something like this:
Click OK and save the Event Breaker.
Stream Filesystem Collector
Now that we have configured the Event Breaker, let’s set up the Filesystem collector to collect the octoprint.log.
Create a new collector by going to Collectors → + Add New.
Name your Collector, and under Collector Type, select Filesystem.
The OctoPrint logs are in the
~/.octoprint/logsdirectory. Under Directory, enter the full path to these OctoPrint logs.Next, click on Fields (Metadata) and add the field collector =
octofilesystem. We will use this field to filter these logs in the Route.Finally, select Event Breakers, and select the OctoPrint Ruleset we created in the previous step.
Click Save.
Click Run on the newly saved collector. In the resulting modal, select Preview and then select Run. You should see the
octoprint.log, which is now correctly broken. Go ahead and save this as a sample file to use in our Pipeline creation.
Stream Pipeline Creation
Now I will create a pipeline in Stream to process the OctoPrint state information and octoprint.log, and get it ready for ingestion in OpenSearch.
OctoPrint State Pipeline
To create a new pipeline, go to pipelines → + Pipeline. I named mine OctoPrint-API-State.
The first thing we need to do to get our data ready to send to OpenSearch is to specify the index where we want our data. We can do this by setting the __index field using an Eval function.
Click on + Function and choose Eval.
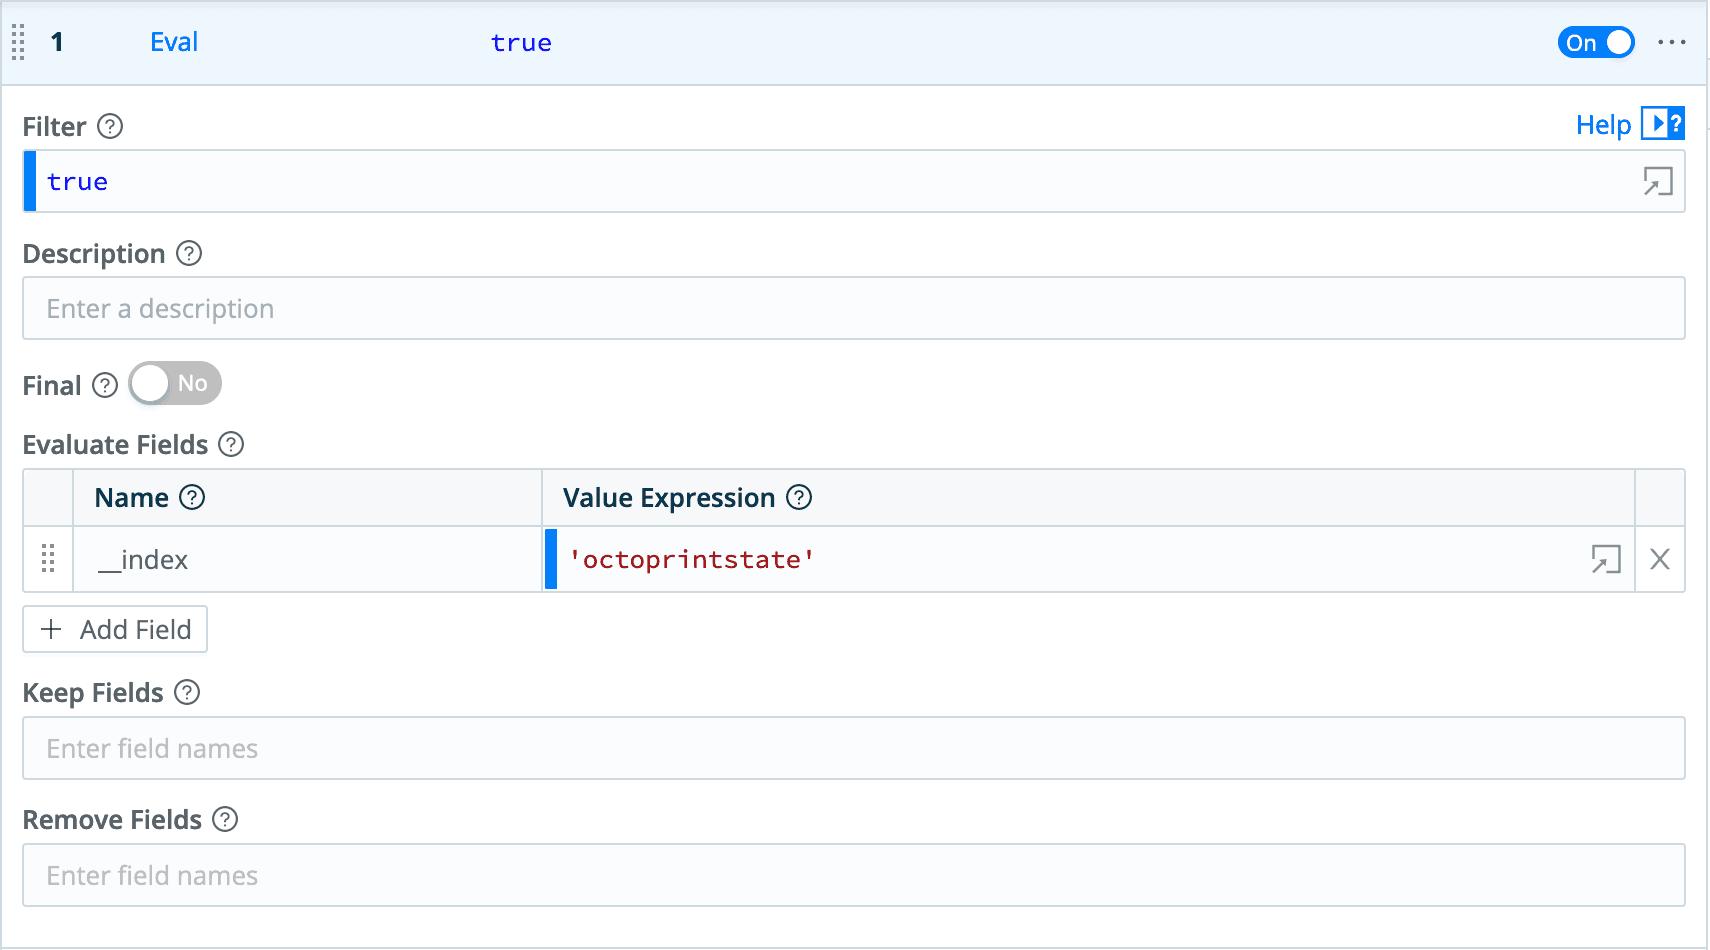
Click + Add Field.
Under Evaluate Fields, set the Name to
__indexand the Value Expression to ‘octoprintstate’.
Let’s take a look at the sample data we saved, by clicking Preview Simple. If you click the gear icon and select Show Internal Fields, you can see the __index field we just created. You might also notice that the _raw field contains JSON. OpenSearch needs the nested fields extracted to use them. We can do this by using the Parser function.
Add a new function and select Parser.
In the Operation Mode dropdown, select the Extract option.
In the Type dropdown, select JSON Object.
Click Save.
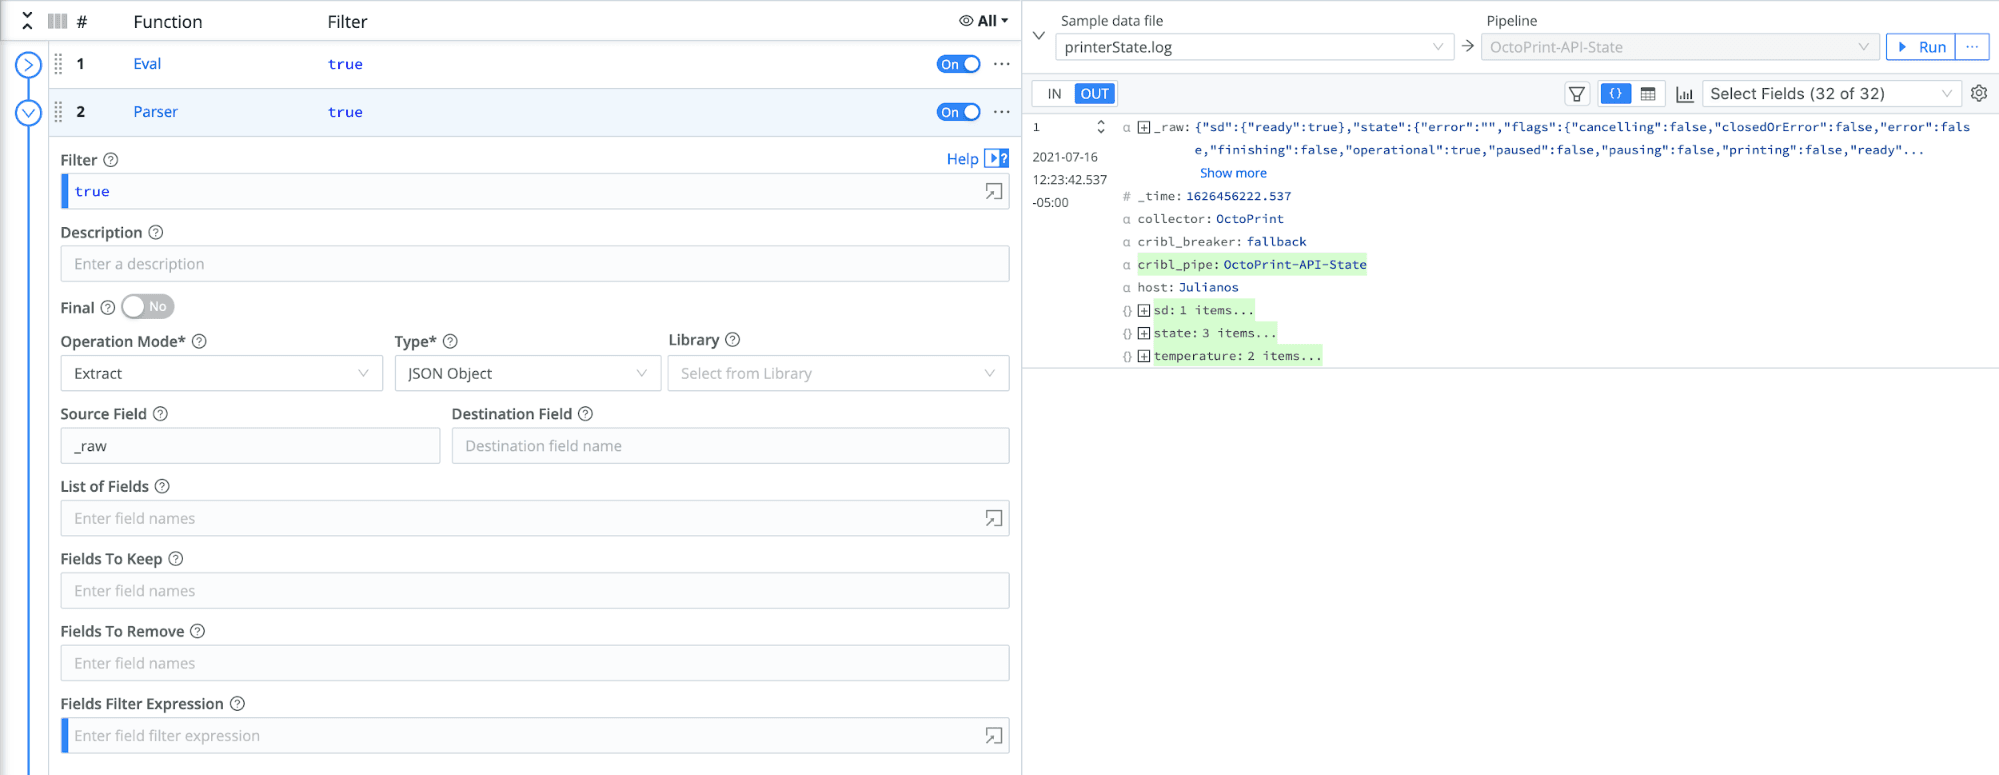
The Parser has now extracted the fields out of _raw, and they are ready to be sent to OpenSearch.
OpenSearch doesn’t recognize fields that start with _, and we don’t need that field anymore. We will get rid of _raw with a final Eval function.
Add a new Eval function.
Under Remove Fields, enter
_raw.Click Save.
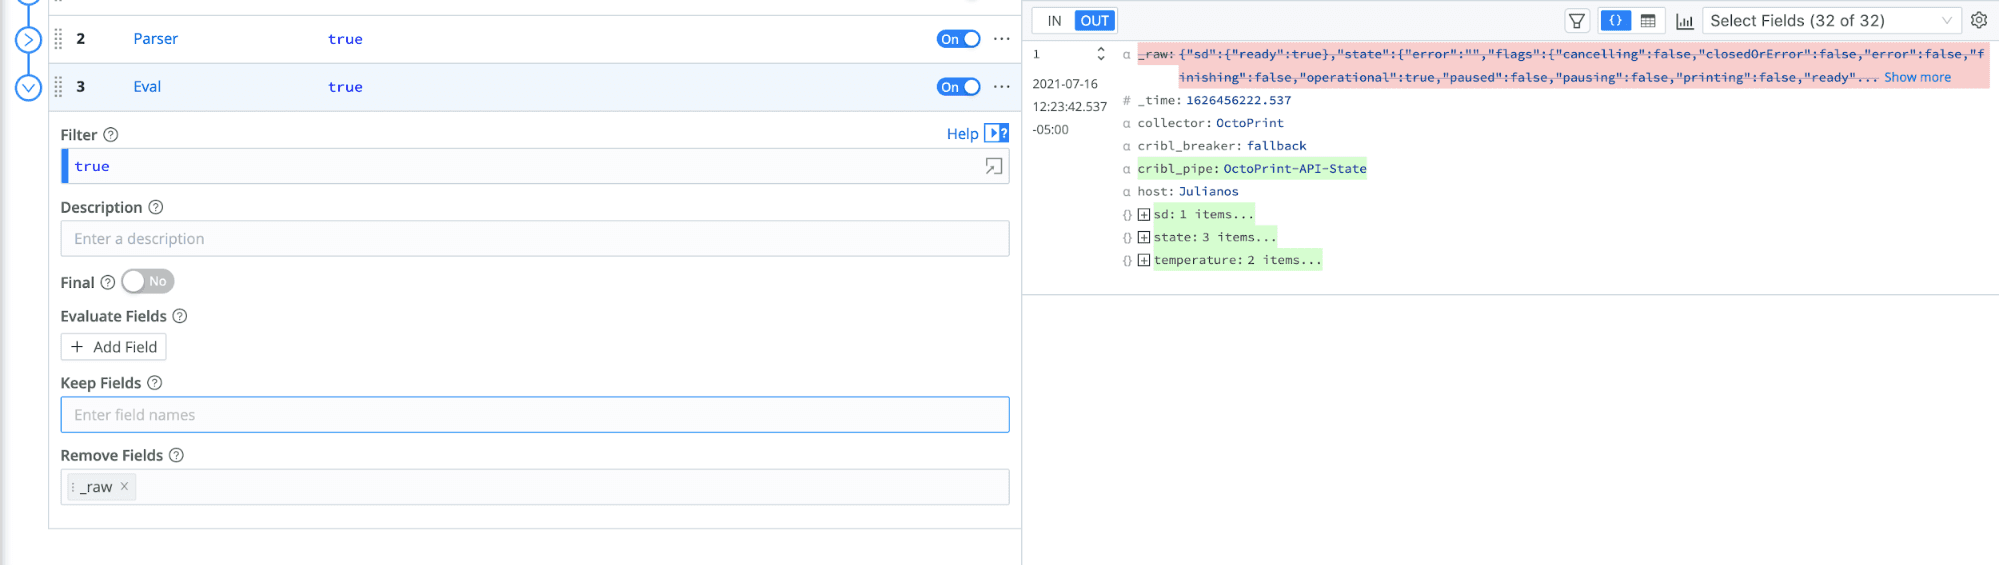
Now that _raw is gone, the event is ready to send on to OpenSearch.
Octoprint.log Pipeline Creation
Let’s create another pipeline for the octoprint.log.
Go to Pipelines → + Pipeline → Create Pipeline. Name this pipeline
OctoPrint-Filesystem.Let’s take a look at the
octoprint.logwe saved as a sample earlier. Open it on the right by clicking Preview > Simple on its row.
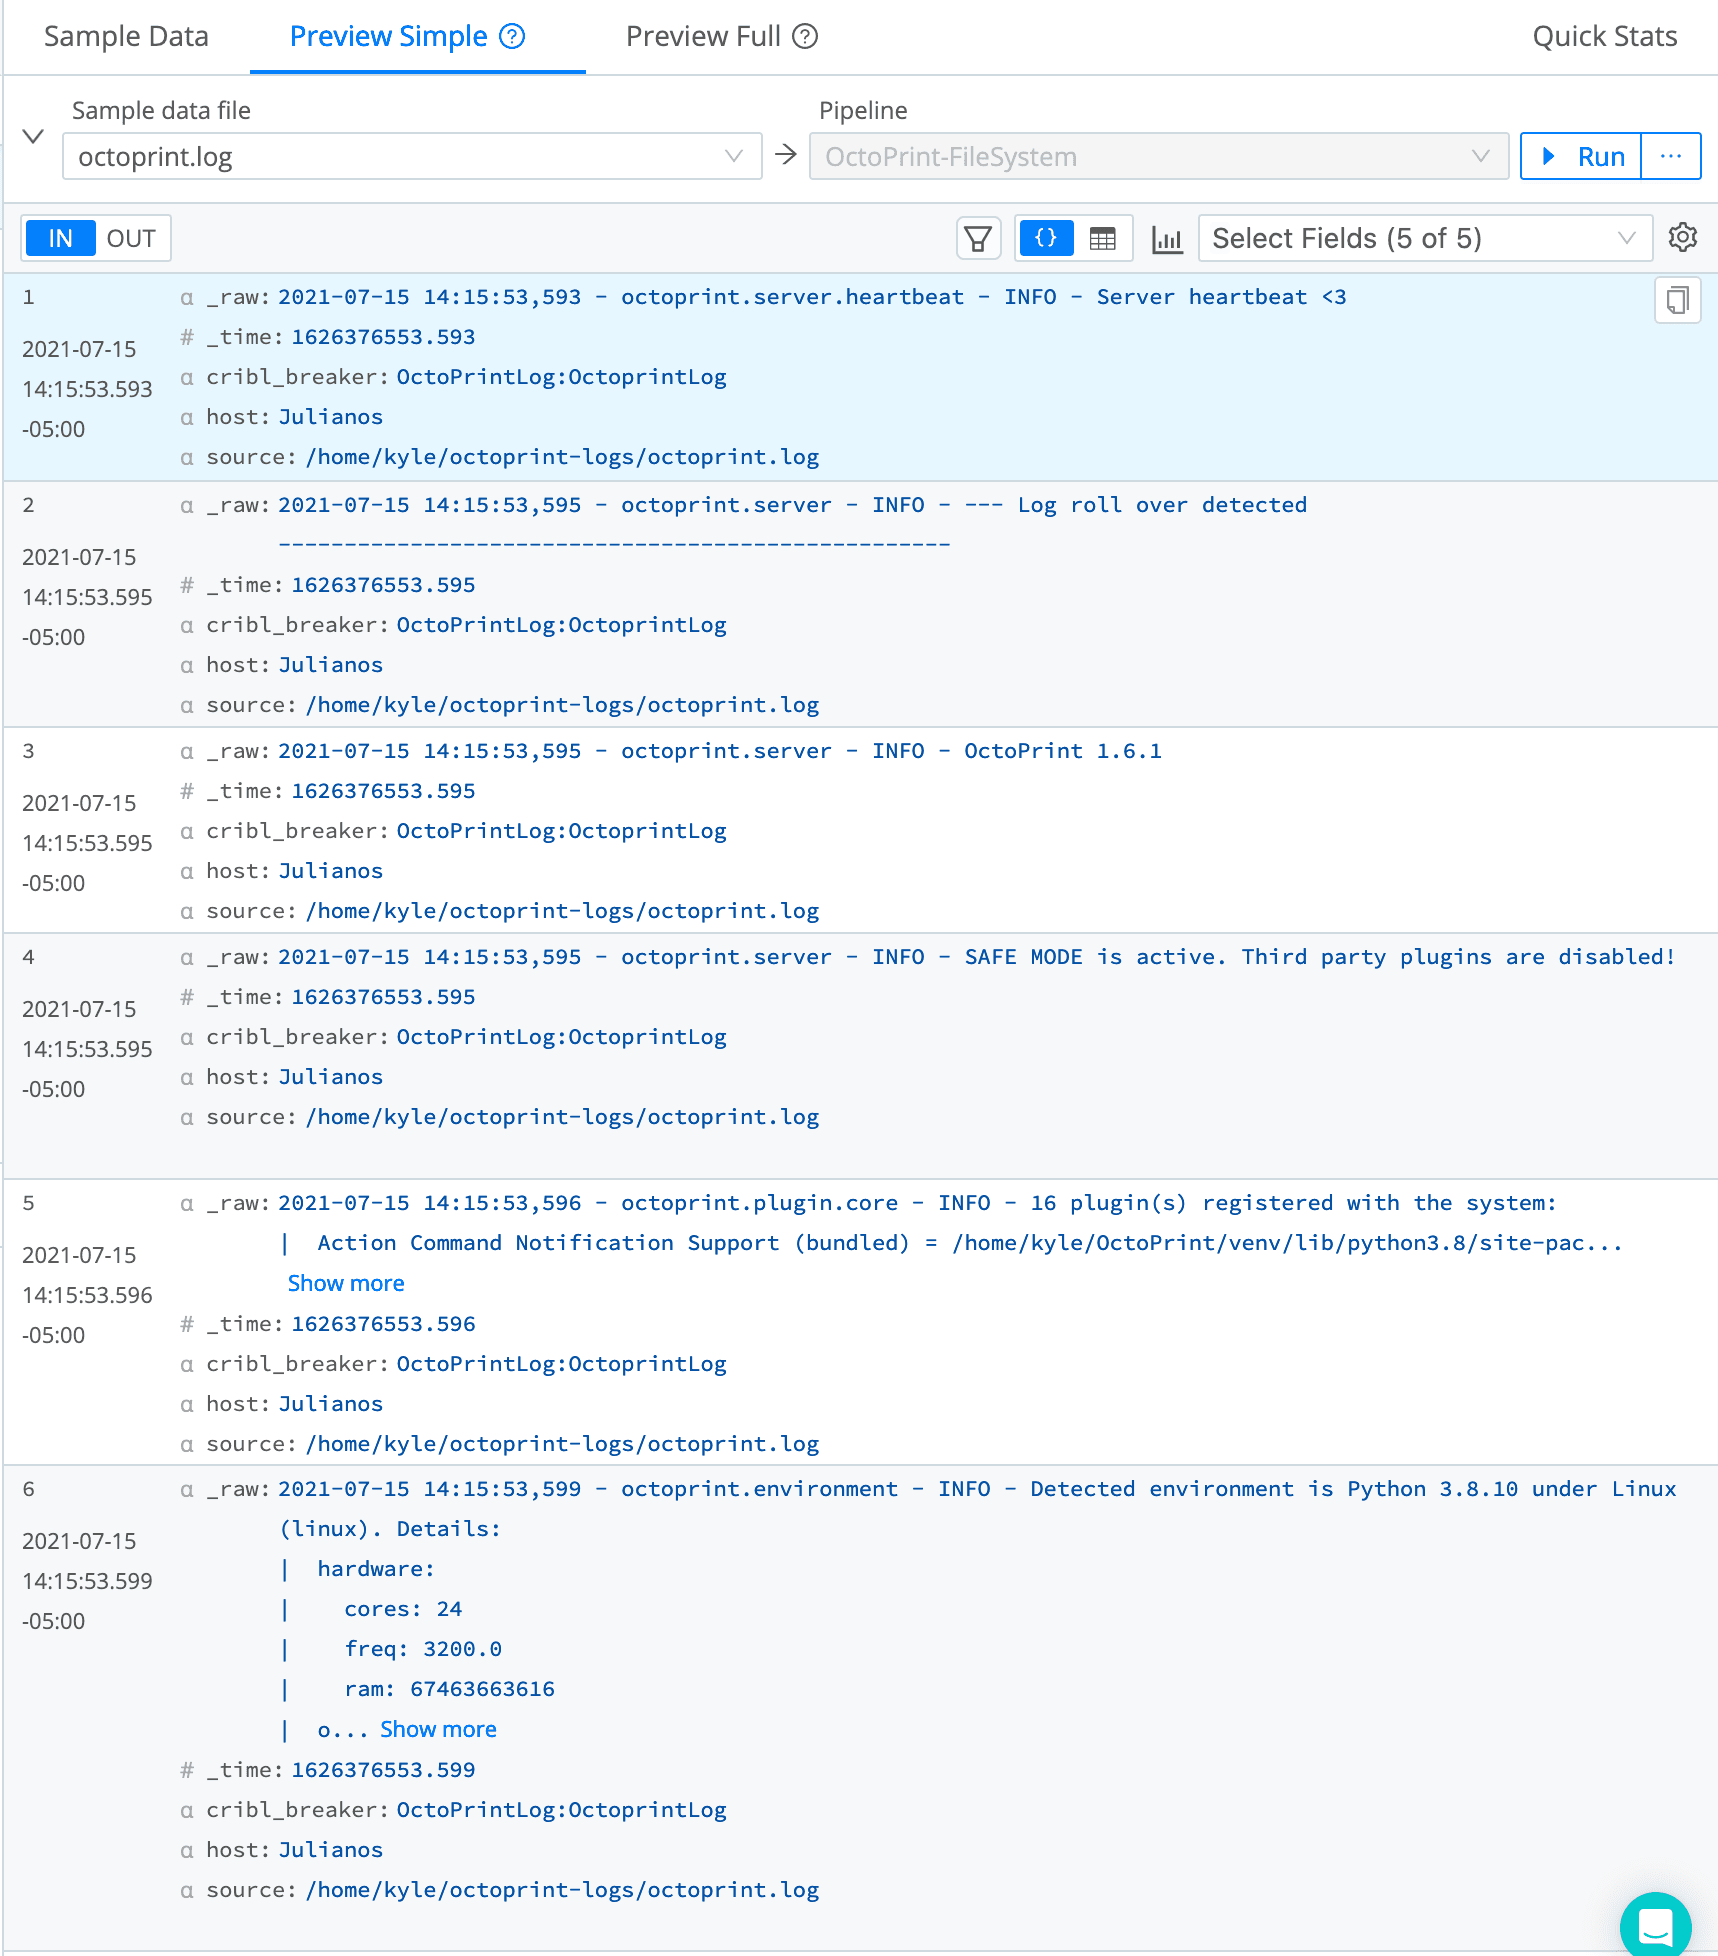
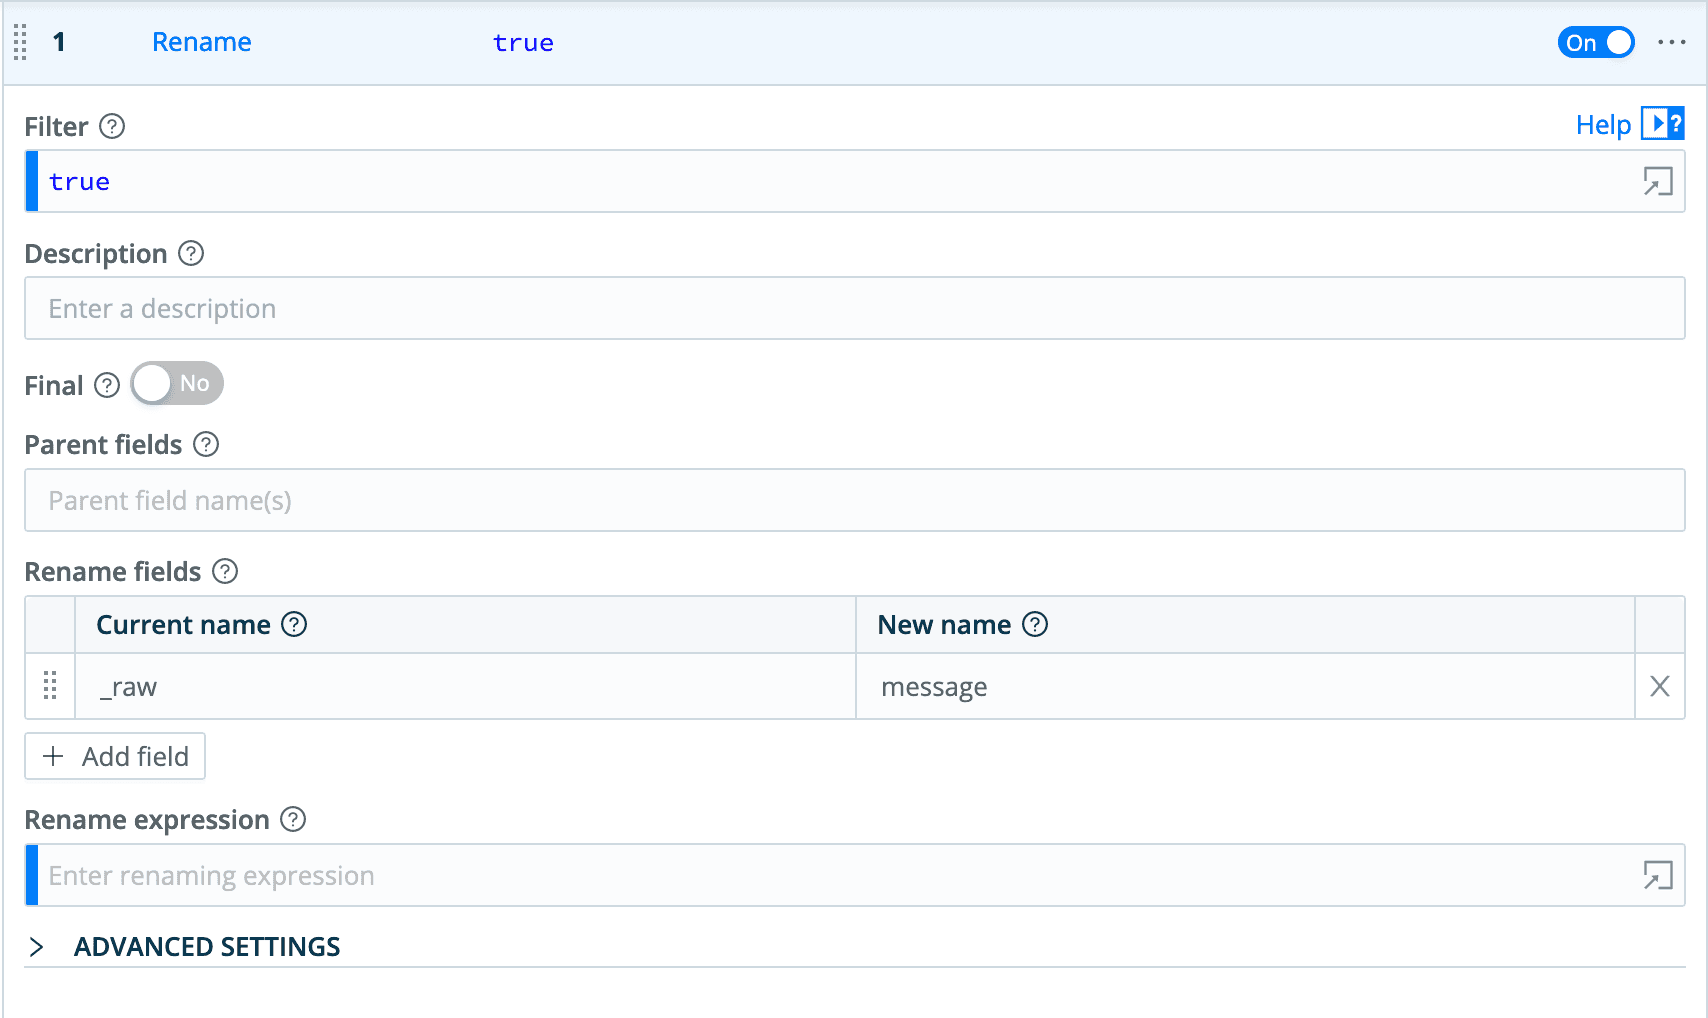
We can see that, as with the API state data, our data is in _raw, and OpenSearch will complain about fields starting with an underscore. We can fix this by adding a Rename function, to rename the _raw field to message.
Now we need to specify the OpenSearch index we want to send to, by setting the __index field.
Click on + Function and choose Eval.
Click + Add Field.
Under Evaluate Fields, set Name to
__indexunder Name and Value Expression tooctoprint_filesystem.
Now, this data is ready to be routed to OpenSearch.
Configure OpenSearch Destination
OpenSearch is Elastic under the covers, and it works great with our Elasticsearch destination.
Go to Destinations → Elasticsearch → + Add New.
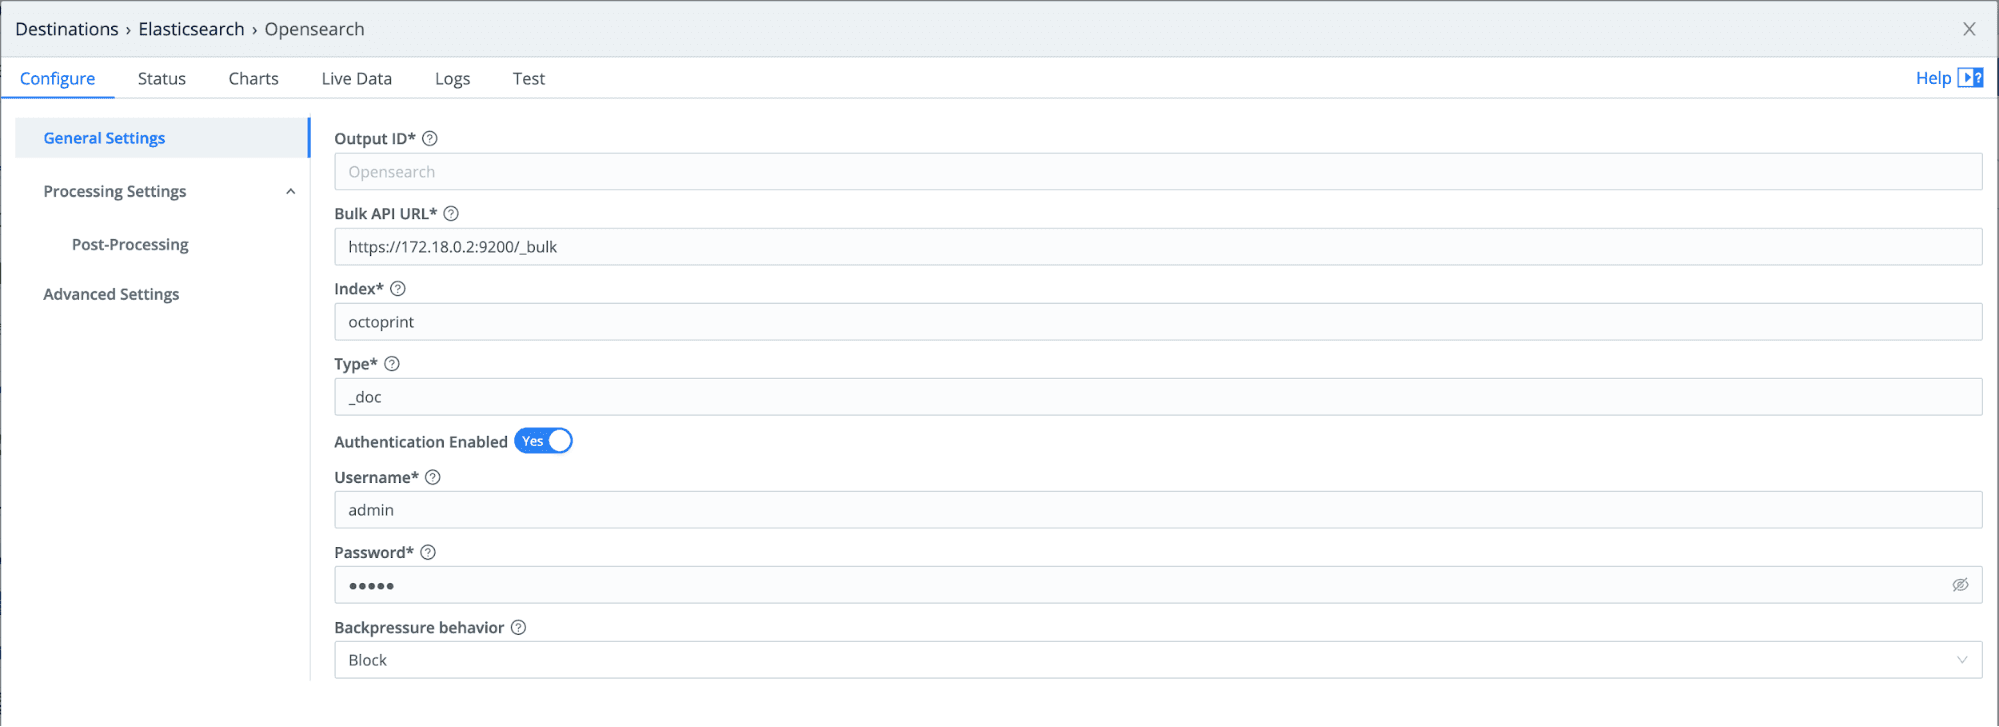
We will be sending data using the
_bulkAPI of our OpenSearch instance. Type should be _doc, as that is what OpenSearch prefers.Set Index to
octoprint. In the Pipelines we created, we overwrote the__indexfield.Enter the username and password you use to log in to OpenSearch. (This user will need proper permissions to send to the
_bulkAPI.)Finally, under Advanced Settings change the Version from Auto to 7.x
Your settings should look something like this:
One last important setting when sending data to OpenSearch is the Elastic version.
Stream Route Creation
Once we’ve configured the destination, we can set up a route to route the State data we collected with the REST API Collector to OpenSearch.
Go to Routes → + Add Route.
Set the filter to
collector=='OctoPrintState', the field we added as metadata in our Collector configuration.Select the
OctoPrint-API-State pipelinewe created in a previous step.Select the OpenSearch Elastic destination we created in the previous step. Now the data should be ready to send to OpenSearch.
Click + Add Route.
Set the filter to
collector==’octofilesystem’Select the
OctoPrint-Filesystem Pipelinewe created in a previous step.Select the OpenSearch Elastic destination we created in a previous step.
Configure OpenSearch
OpenSearch needs minimal configuration, as we have done most of the work on the Stream side. Once we have sent data to OpenSearch, we can set up an index pattern to analyze the data. To create an index pattern:
Go to Stack Management → Index patterns.
Click + Create Index Pattern.
Because we have already sent data with the index
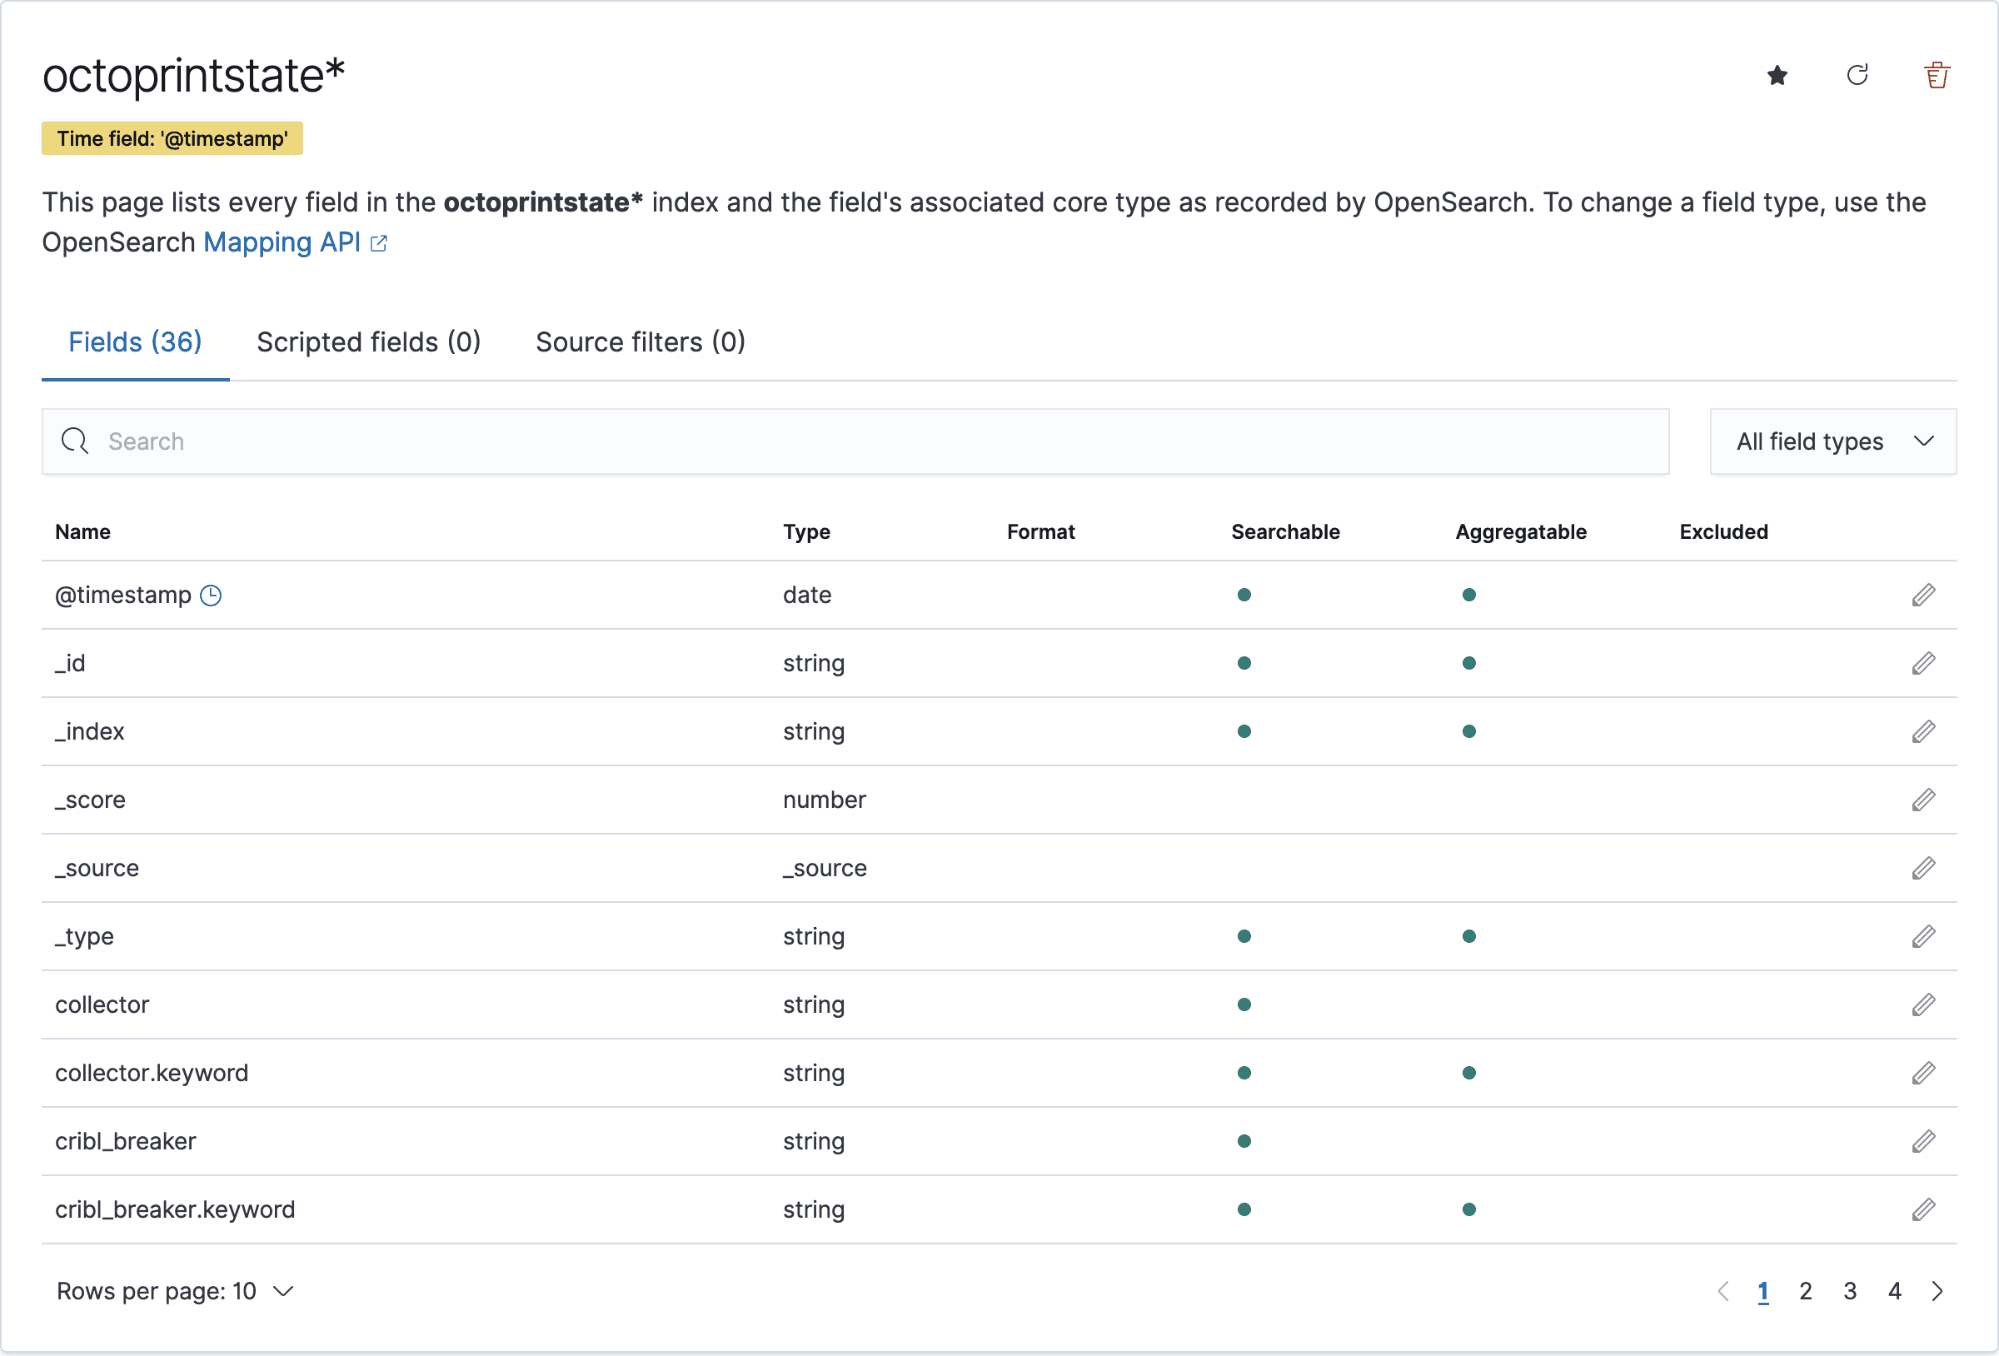
octoprintstate, we should see that index show up in the list. Typeoctoprintstate*as the index pattern name, and click next.Select
@timestampin the timestamp dropdown and click create index pattern.
You should now see your index pattern with all of the fields listed because we extracted them in Stream previously.
Let’s do the same for the Filesystem logs. Click + Create Index Pattern.
Type
octoprint_filesystem*Select
@timestampin the timestamp dropdown, and click create index pattern.
Search and Visualize data in OpenSearch
You can now go to Discover and search the data by filtering on the new index pattern octoprintstate* or octoprint_filesystem*.
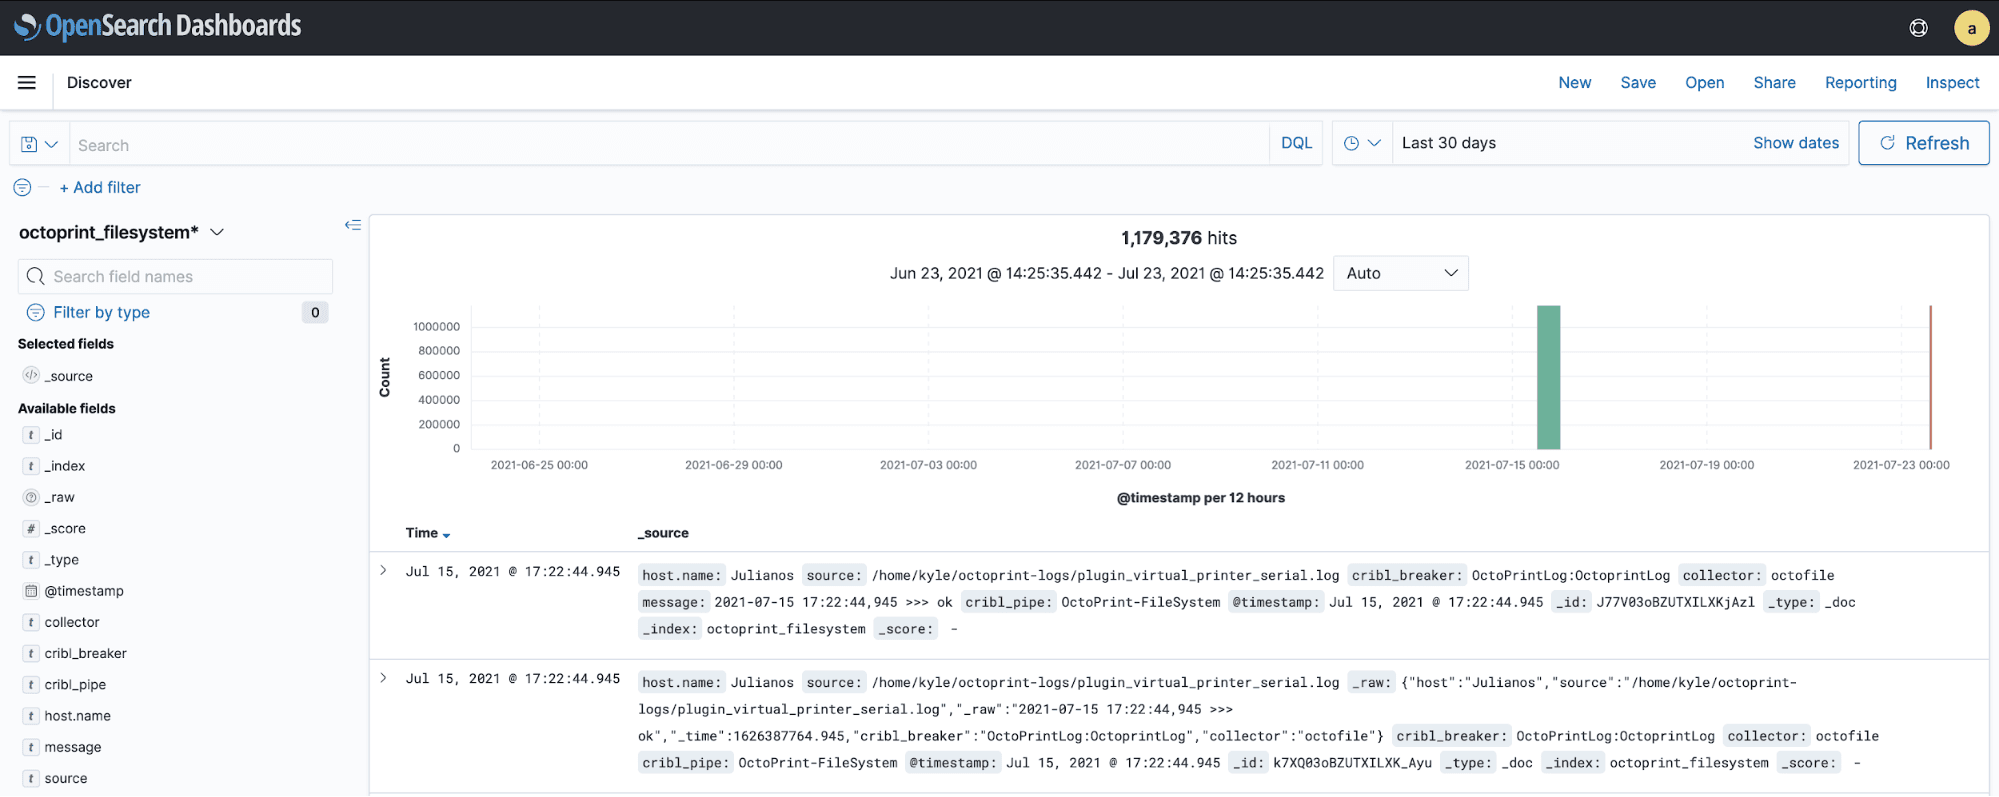
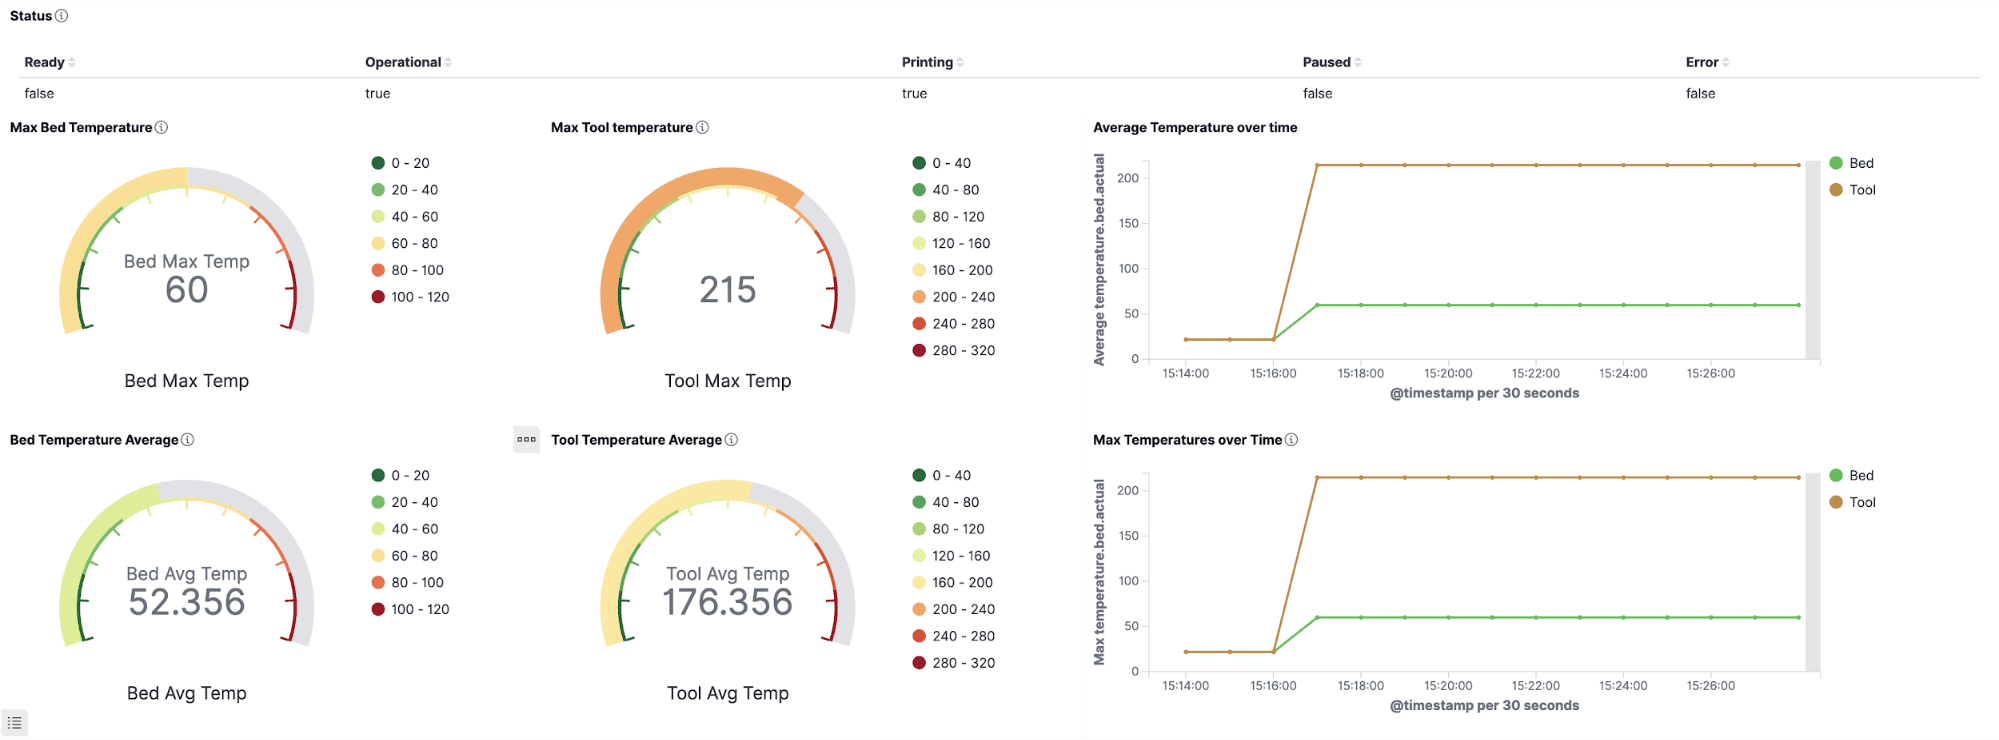
This data can also be used in OpenSearch dashboards to represent it visually!
Get Started Using Stream
Are you interested in routing OctoPrint Logs, or any other data, to OpenSearch? It’s easy to get started on using Stream to route and transform your logs, by signing up for Cribl.Cloud and instantly provisioning an instance of Stream Cloud. Once connected to data sources, you can process up to 1TB per day for free!