
Here at Cribl, we have a cloud offering of our Stream product. In building and supporting our cloud product, we have a service-based architecture. And we want to be able to gather metrics from our services, in order to monitor those services and make sure we meet our SLAs.
In order to do this, we needed to find a vendor that would suit our business needs, and we wanted to try out many different products quickly. Insert Stream, where we can POC many products very quickly, without being locked into a specific vendor. The first step in this process is instrumenting our services with AppScope, in order to gather metrics about the service. AppScope is a new approach to black-box instrumentation delivering ubiquitous, unified telemetry from any Linux executable by simply prepending scope to the command.
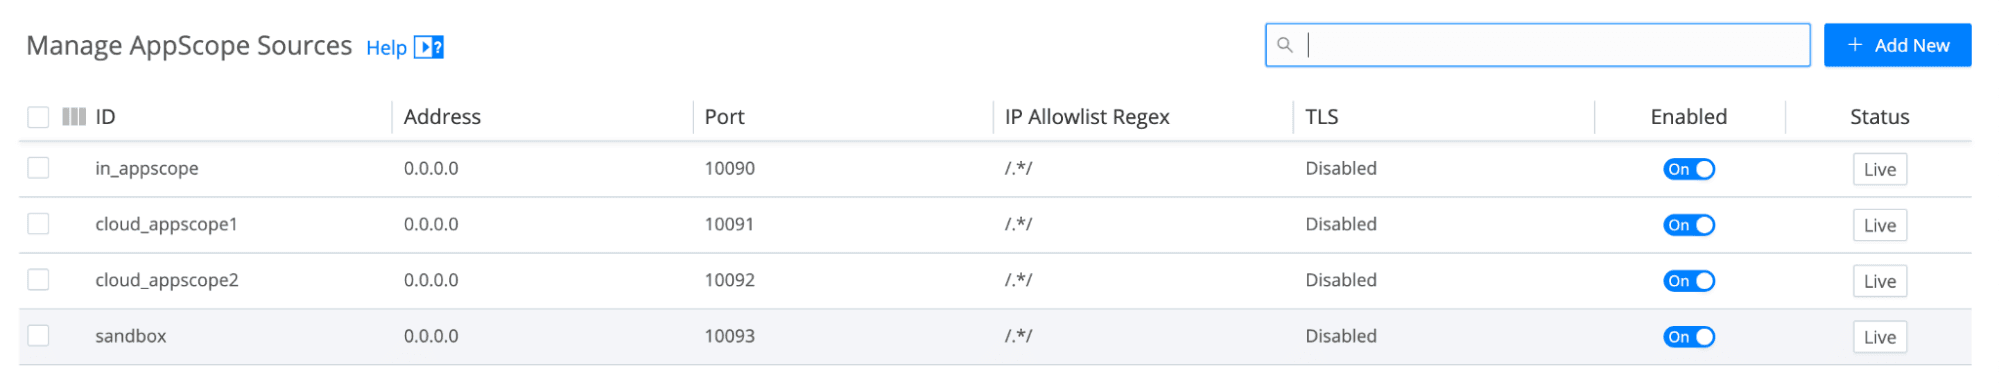
With these metrics, we can easily configure an AppScope Source in Stream to receive these metrics (and logs being sent to stdout as well).
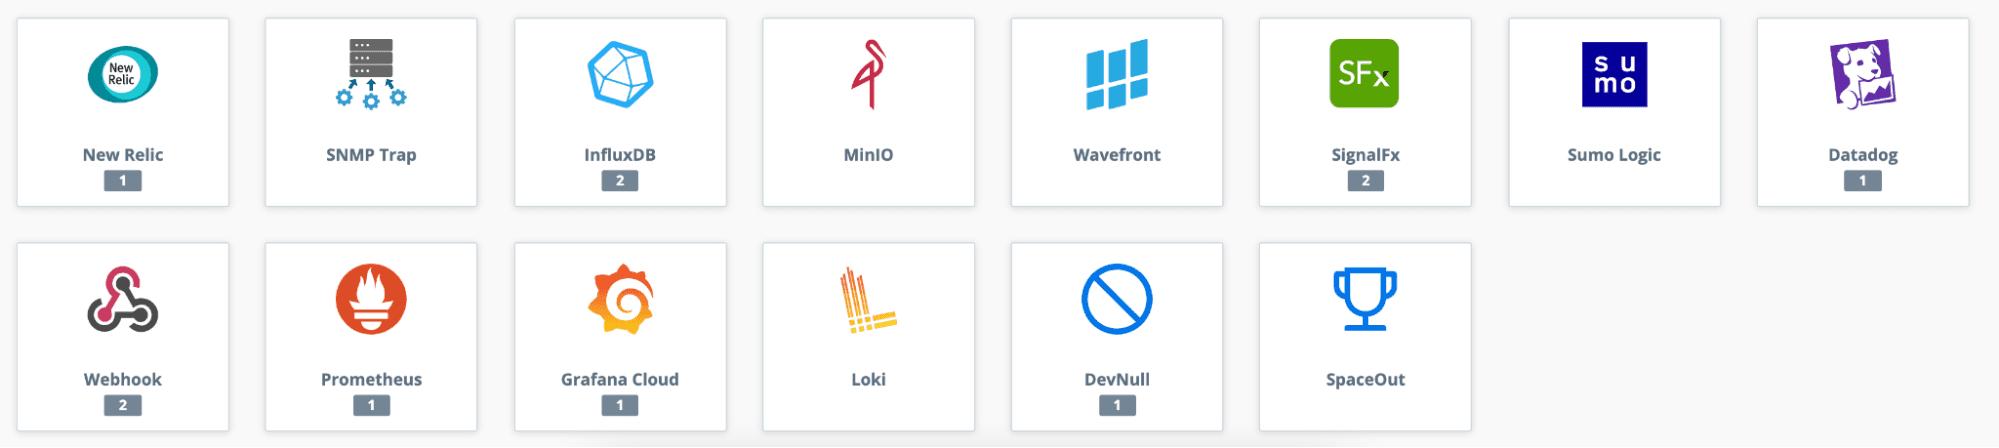
With our metrics being sent into Stream, the fun part began. I went ahead and signed up for five different vendors: Grafana Cloud, InfluxDB Cloud, Datadog, SignalFx, and New Relic. Once I’d configured all the required API keys/credentials, I was able to quickly and easily add all five as Destinations in Stream.
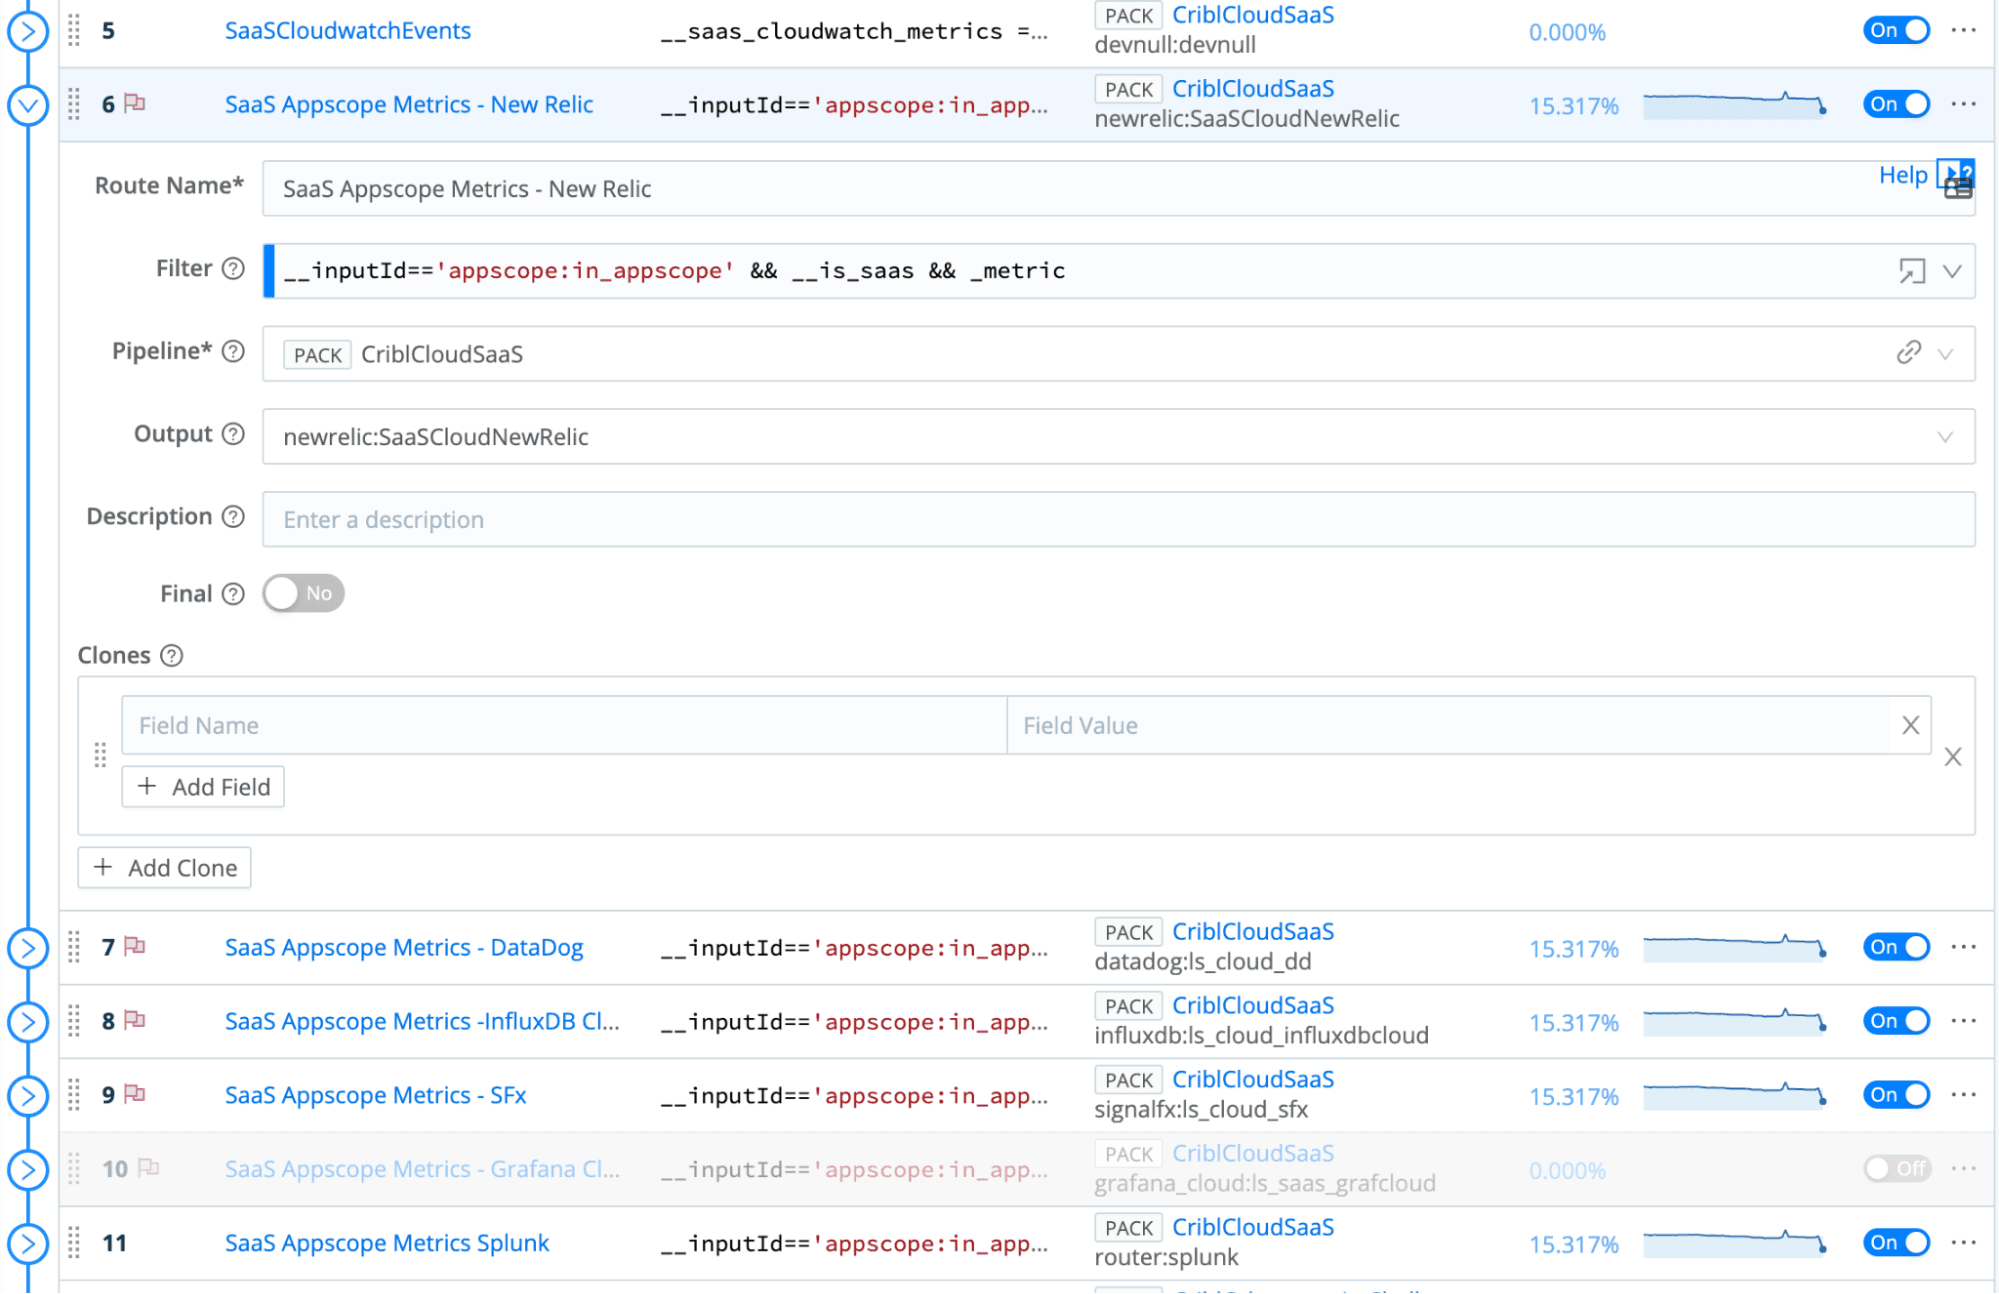
Upon adding all of the required Destinations, I then set up a Pipeline to gather the metrics coming in through our AppScope Source, and a route to send them to the individual Destinations.
Once the metrics were flowing through, I could go ahead and build dashboards in the various POCs to then evaluate each product. It was very easy to compare all of the various vendor’s side by side, with the exact same sets of data flowing through each of them simultaneously. This gave me confidence that I was doing an honest comparison and I didn’t have to worry about any caveats.
After going through each product and building our dashboards, our team was able to arrive at the decision to use New Relic as our metrics vendor, due to the ease of getting data in, the pricing structure, and the dashboarding experience. They also offered useful threshold alerting (and other) features.
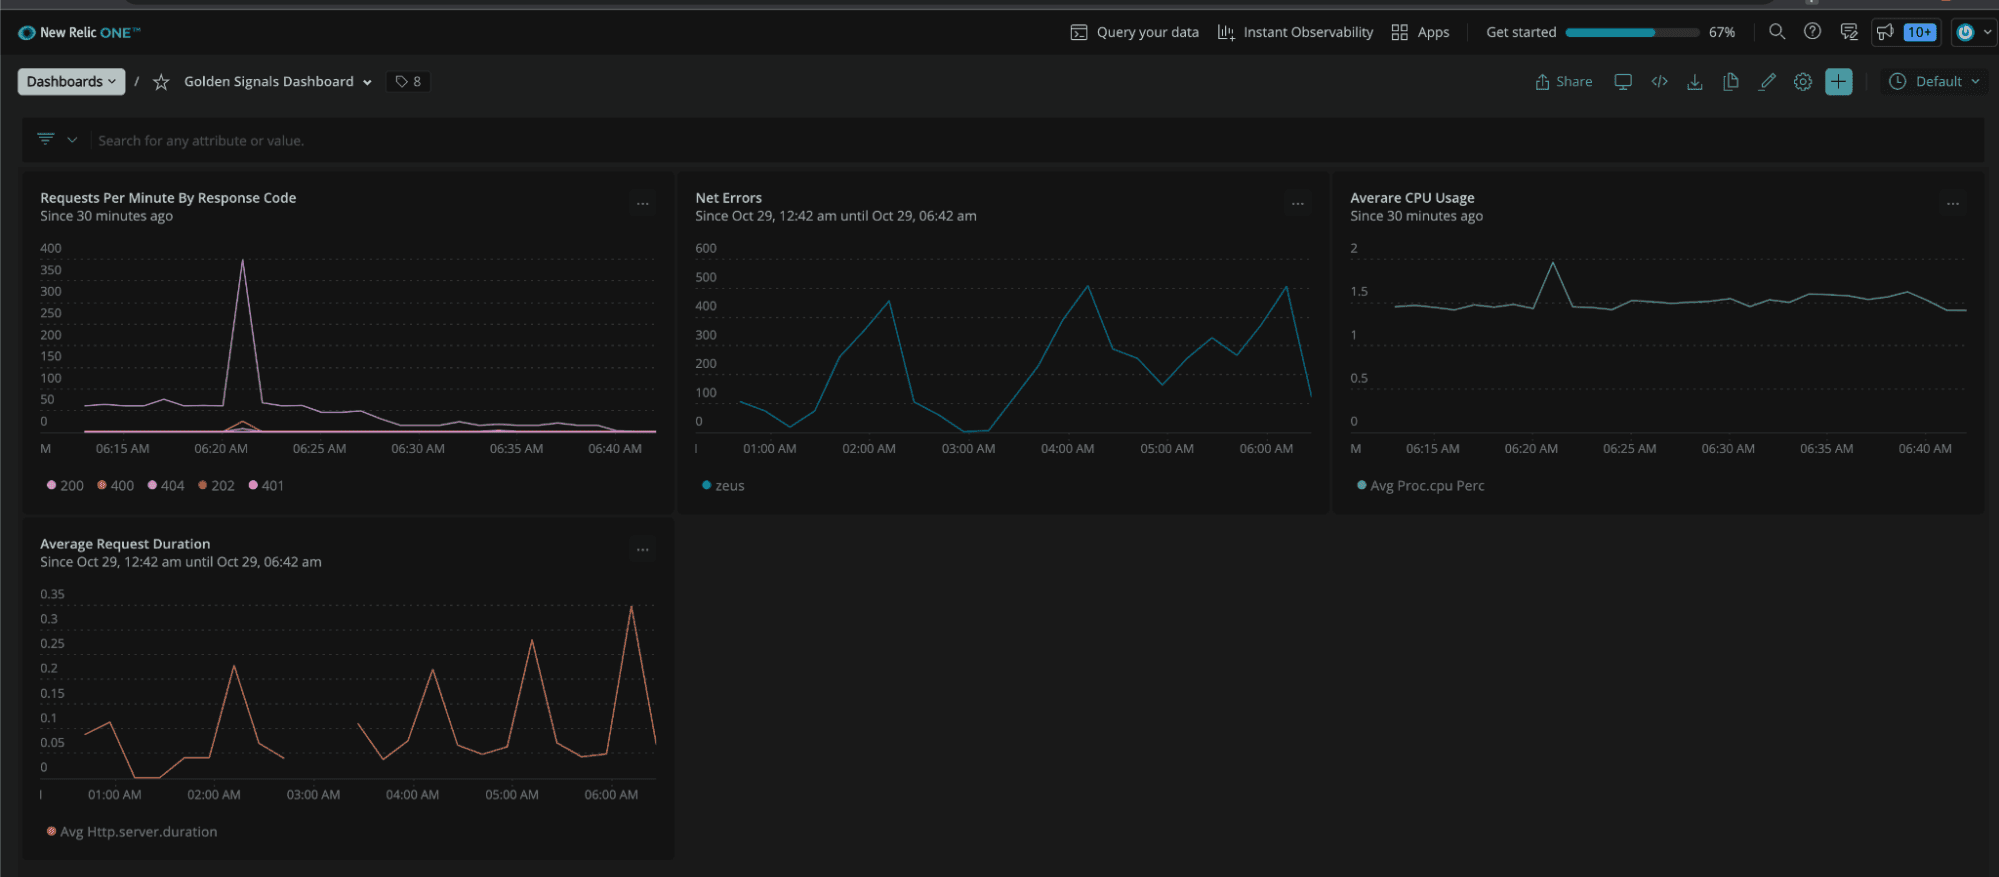
I was able to collect my application’s golden signals (latency, traffic, errors, and saturation) very quickly by using AppScope to scope my application – without adding any logic to my application itself to gather this data. Then, I was able to connect this data to Stream, and quickly send it into the five different metrics databases to easily prove out which vendor best suited my use case.
And in the event that we decide to change vendors, we can easily transition to another vendor without having to change any of the plumbing we’ve already installed to send metrics to my metrics database. We’d simply set up a new Destination and forward the metrics to the new database.
In the arms race to add products to help manage your data, don’t end up with an observability gap. Send your data to Cribl Stream, then take advantage of all its features to shape and transform your data before sending it downstream to multiple destinations. Find the best destinations for your use case and don’t waste precious time configuring multiple vendors to then never use them. Get started today by walking through the sandboxed tutorials or to start using Stream in the Cloud.
The fastest way to get started with Cribl Stream is to sign-up at Cribl.Cloud. You can process up to 1 TB of throughput per day at no cost. Sign-up and start using Stream within a few minutes.