In part one of this blog post, I covered the concept, basic design, and results of using Redis to enrich VPC Flow Logs with security classification data from the GreyNoise API. In this post, I’m covering the details of how to do it. These steps will get you going if you want to try it, but keep in mind you’ll need your own GreyNoise API to run it.
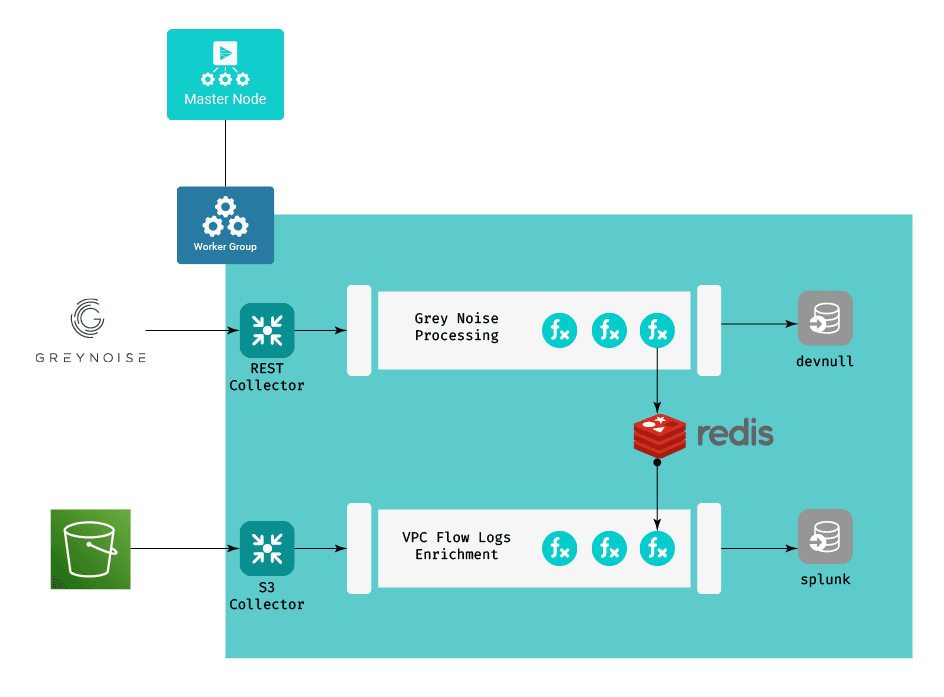
Working from the design diagram from the first post:
Ingesting the Enrichment Data
The approach is two-fold – one set of components to keep the enrichment data up to date in our Redis instance, and one that uses that data to enrich our VPC flow logs. We’ll start with the enrichment data portion.
The Pipeline
The actual pipeline for this consists of a single function, the Redis function. The Redis function is configured to execute a Redis SET command, setting the key gn_ip_${ip} to the field classification. Both of these fields are present in the GreyNoise data that goes through the pipeline. The preface of gn_ip_ is really just a poor man’s approach to creating a namespace within Redis – any keys starting with gn_ip_ are greynoise IP addresses, and their values are the classifications that GreyNoise defined for them.

Collector Configuration
The GreyNoise collector itself is a pretty straightforward REST Collector with parameters, headers and pagination, but we’re going to be a little tricky and use a custom event breaking rule to break the incoming data into individual events. In the LogStream UI’s Knowledge > Event Breaker Rules section, I added a “GreyNoise” rule:
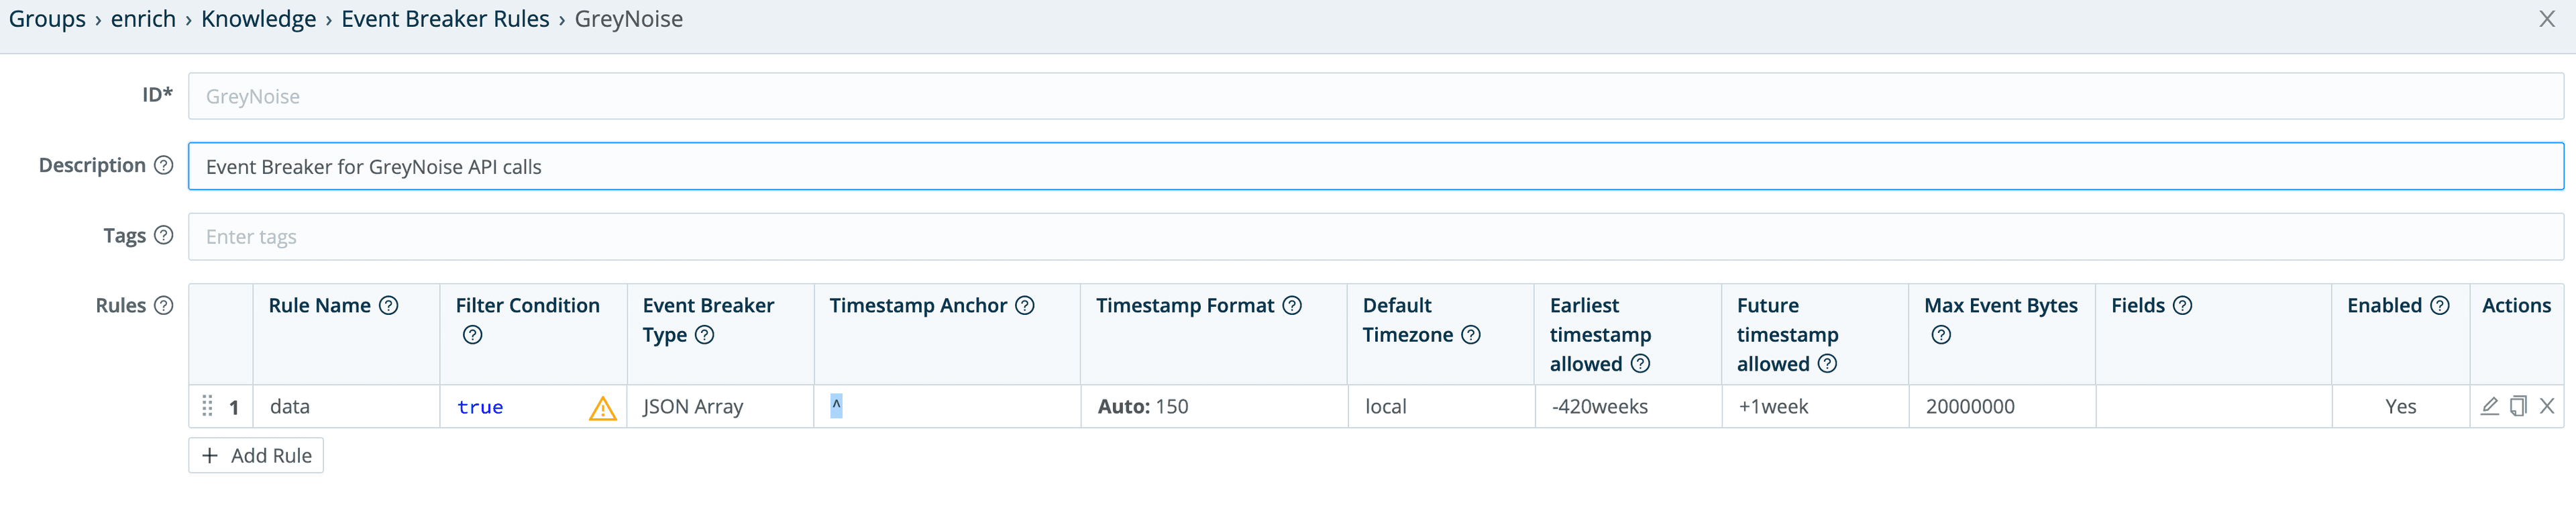
The actual rule looks like this:
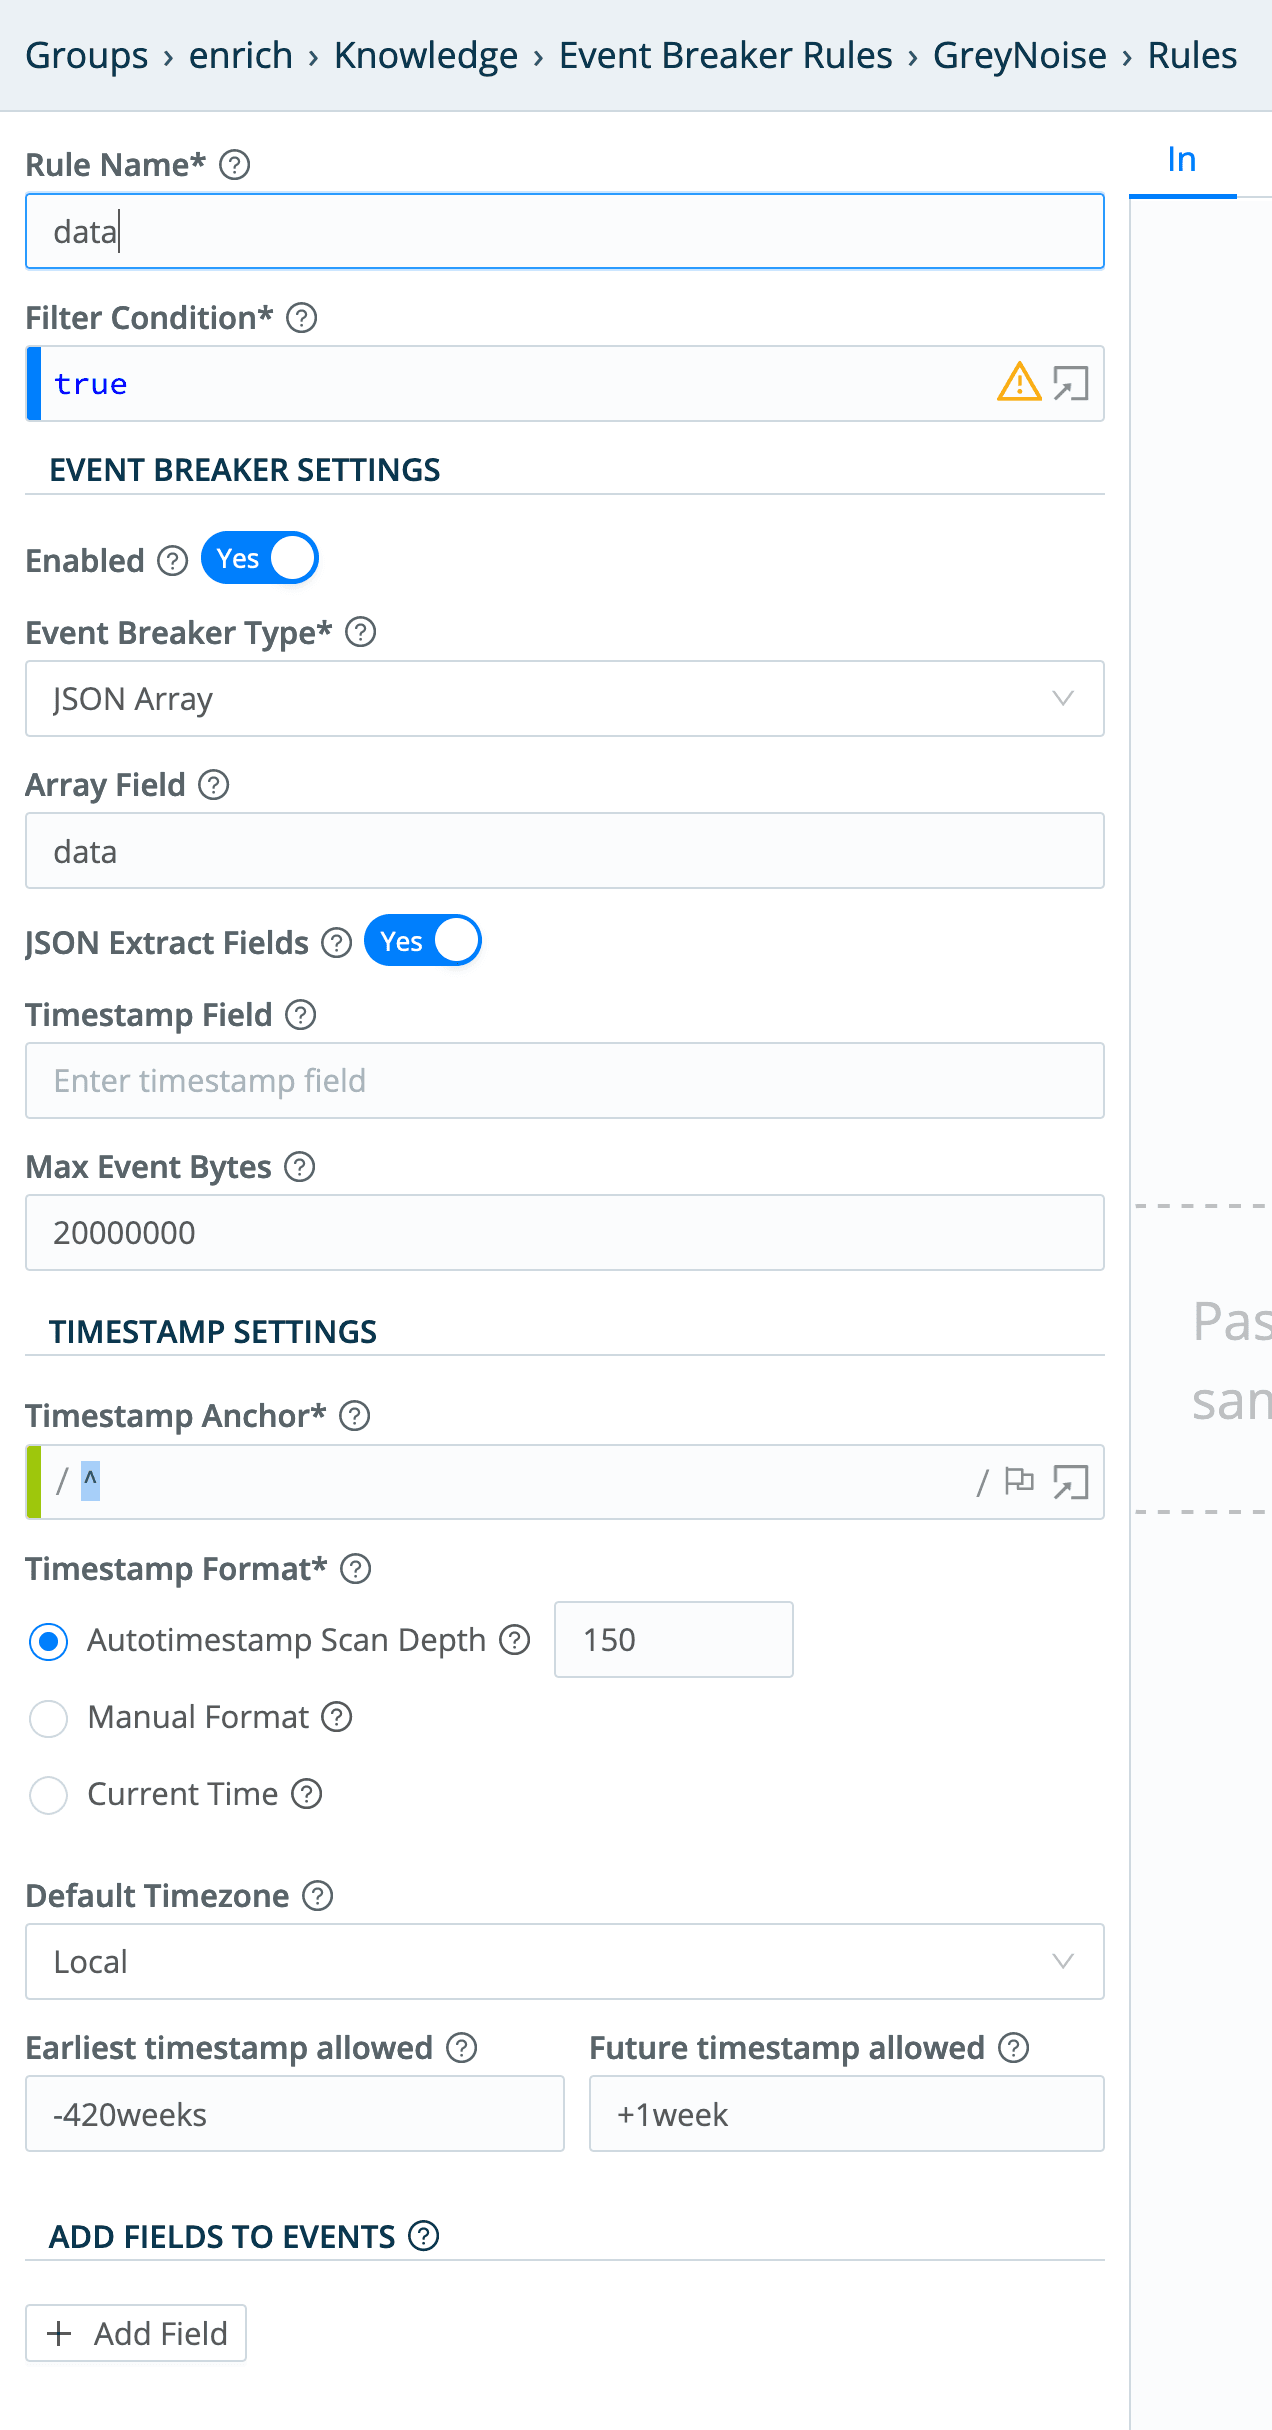
This will basically look at the input events, and extract GreyNoise’s returned data array into individual events.
The actual collector config (in Data > Collectors), looks like this:
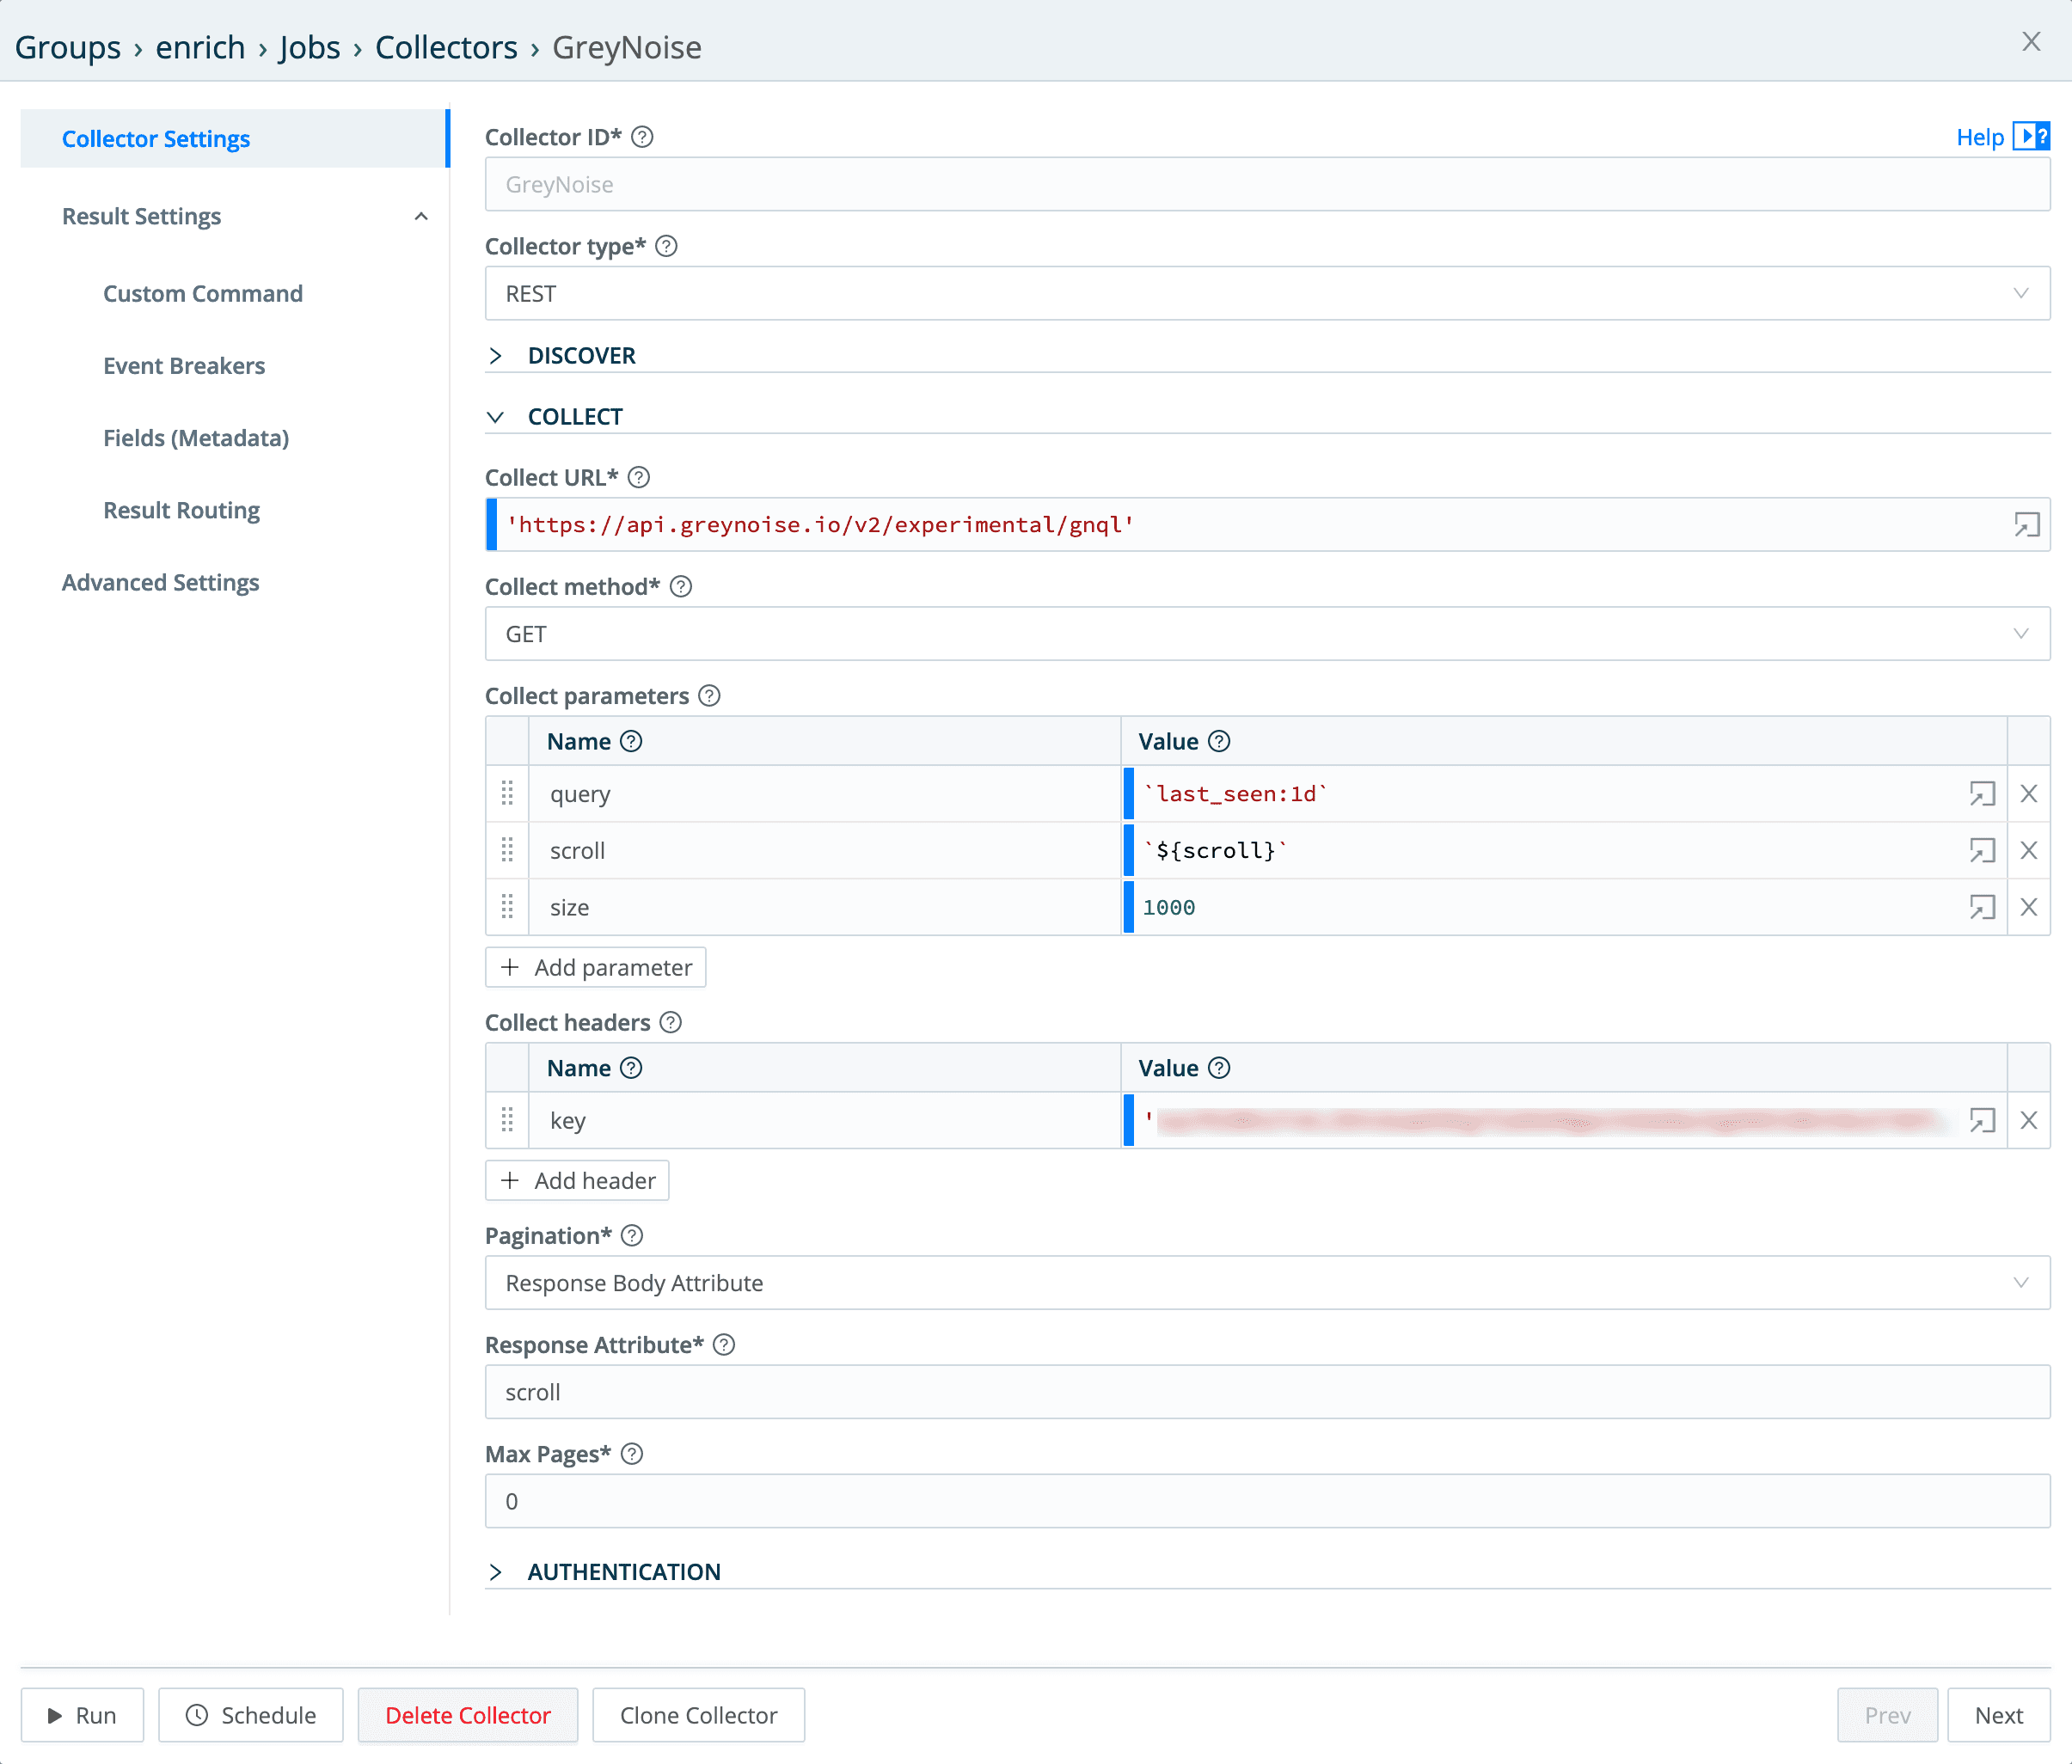
Collect Parameters
query – A simple GreyNoise Query Language (GNQL) query looking for every system it’s seen in the last day.
scroll – this is how we pass back the pagination information to the “next” api call – it evaluates out to the value of the scroll field from the “last” run of the api call.
size – this sets the number of records we want returned per call.
Collect Headers
The only header that needs to be set is the key header, set to the GreyNoise API key. I’ve blurred my GreyNoise API key out, but you can go to GreyNoise.io get your very own! 🙂
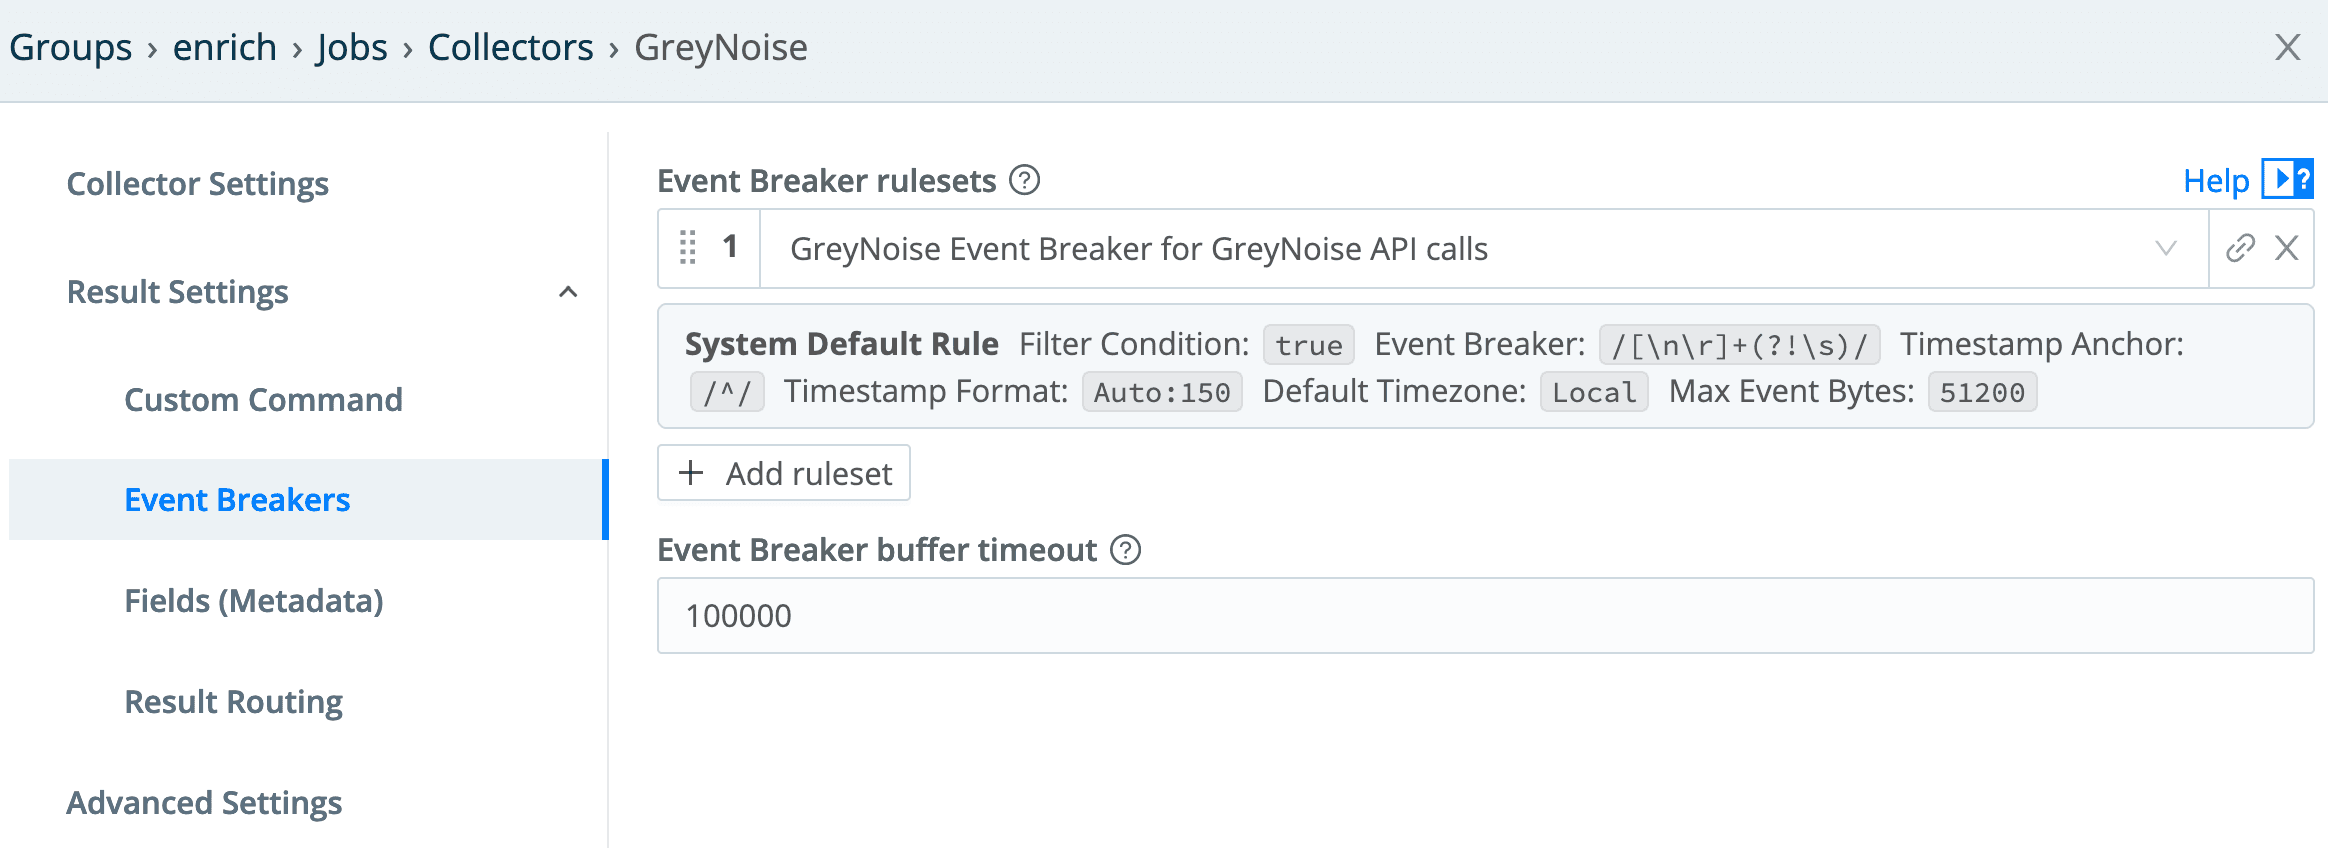
In the Event Breakers section of the collector config, we need to select the GreyNoise breaker rule created earlier:
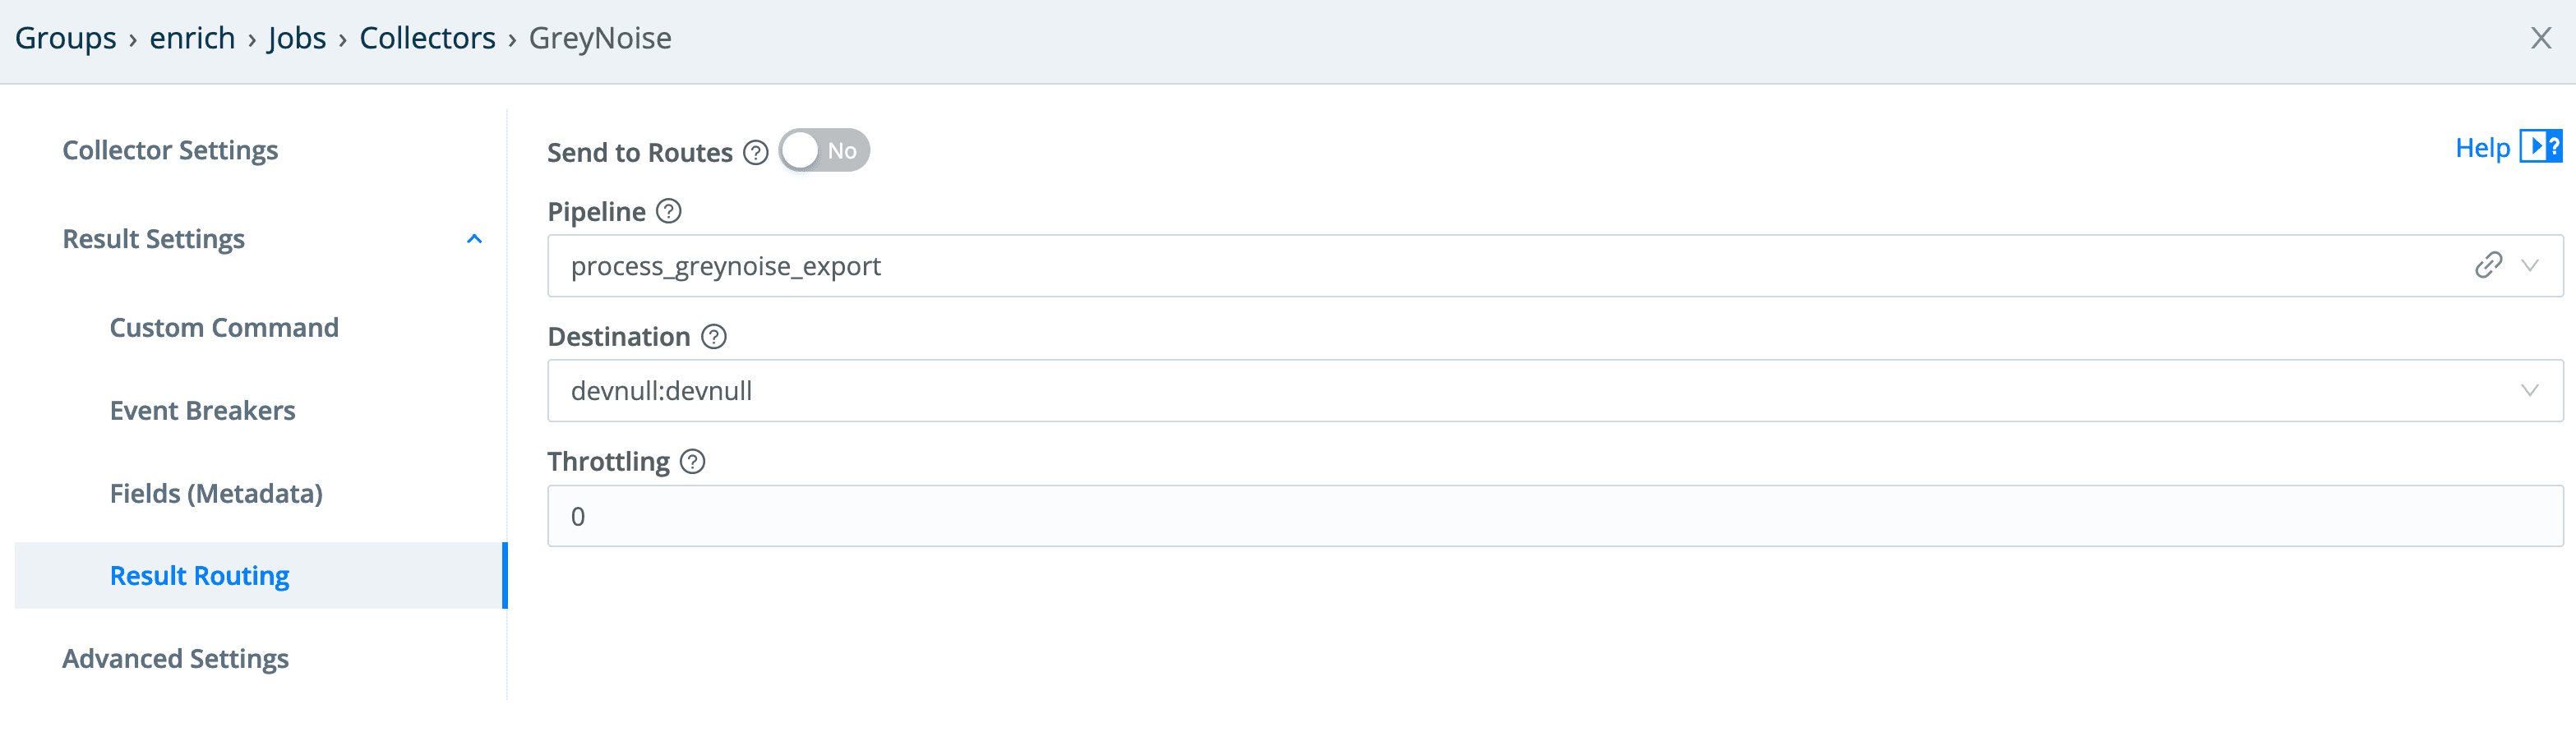
And finally, the result routing needs to go through the pipeline configured for it. Since we do not want any of this data flowing “downstream,” the output is the devnull destination.
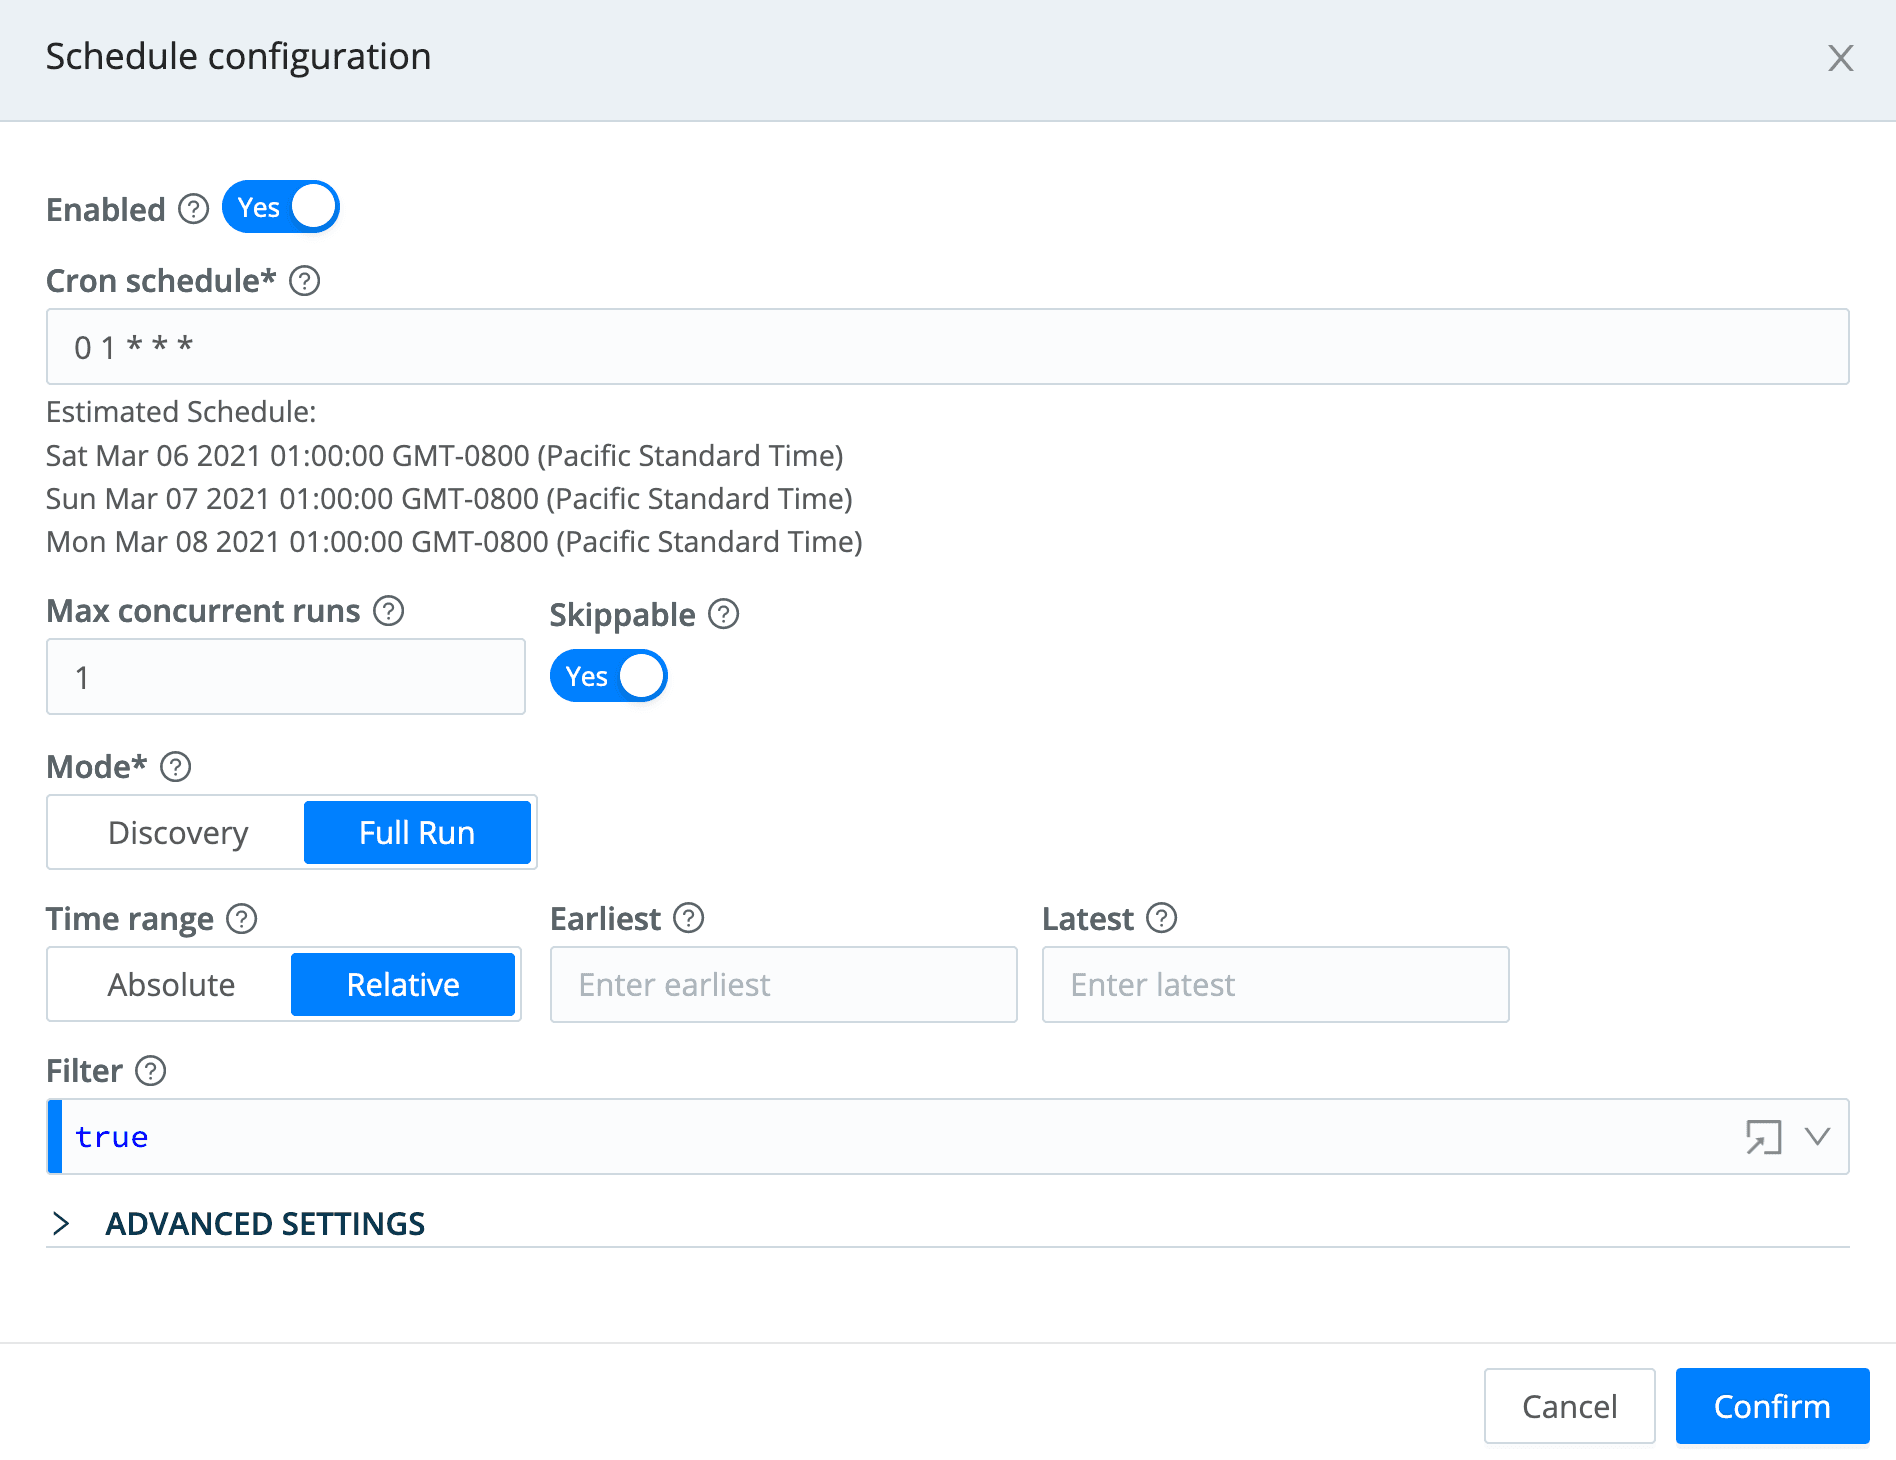
After testing this, I added a schedule to it, by clicking the Manage Collectors page’s Schedule button, and I put in a cron entry to have it run at 1am UTC every day:
Using the Redis Data to Enrich Events
Now that we have the enrichment data loading into our Redis instance, we need to make use of it to enrich our VPC flow logs.
VPC Flow Logs Collector
The VPC Flow Logs collector is a simple S3 collector that points at the bucket where we direct all of our VPC Flow Logs to end up.
The Pipeline
Here is the complete pipeline for the VPC Flow Logs:
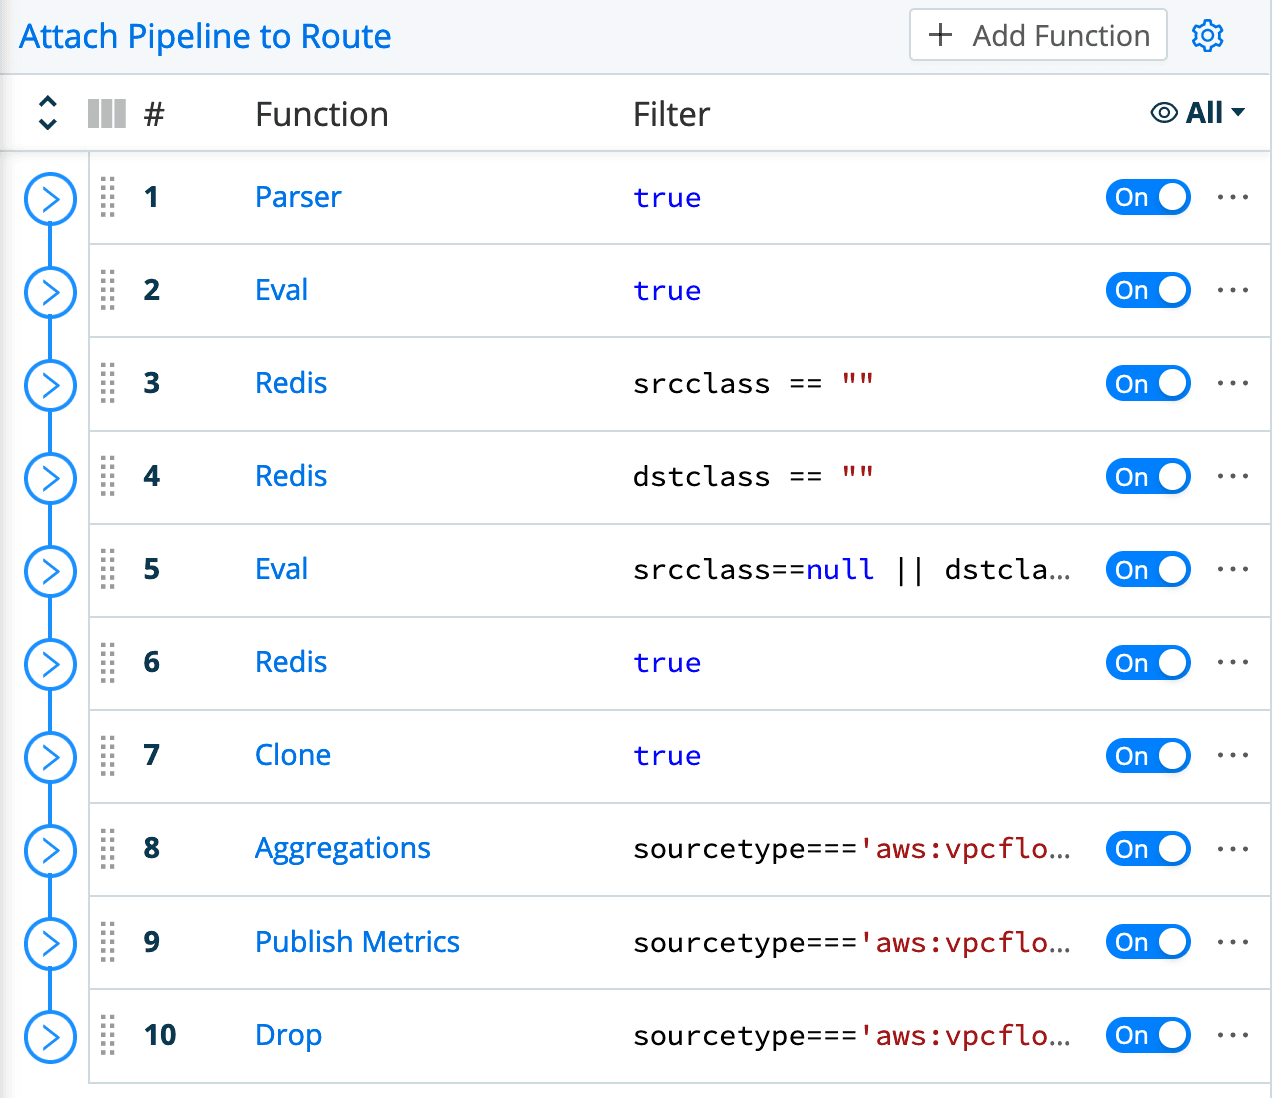
This pipeline is a bit more complicated than the GreyNoise extraction pipeline, for a couple reasons:
Data extraction needs to be done in the pipeline itself (the Parser function at the top), since the data coming in is not a JSON structure/array, like the API data was.
A few things need to be done to achieve the end goal of having both metrics and a filtered set of log events delivered to the destination, and also have the data in the desired form. For example, the second function (Eval) checks if either address is a RFC1918 address, and if so, defaults its classification to “internal” – GreyNoise is not looking at RFC1918 addresses, so this helps the output be consistent and informative.
The first two Redis function entries look up the
src_ipanddest_ipfields against the Redis table. Any IP address that Greynoise hasn’t seen is going to return a null value, so the Eval after the them makes it look a little more consistent and understandable by setting it to “no data”.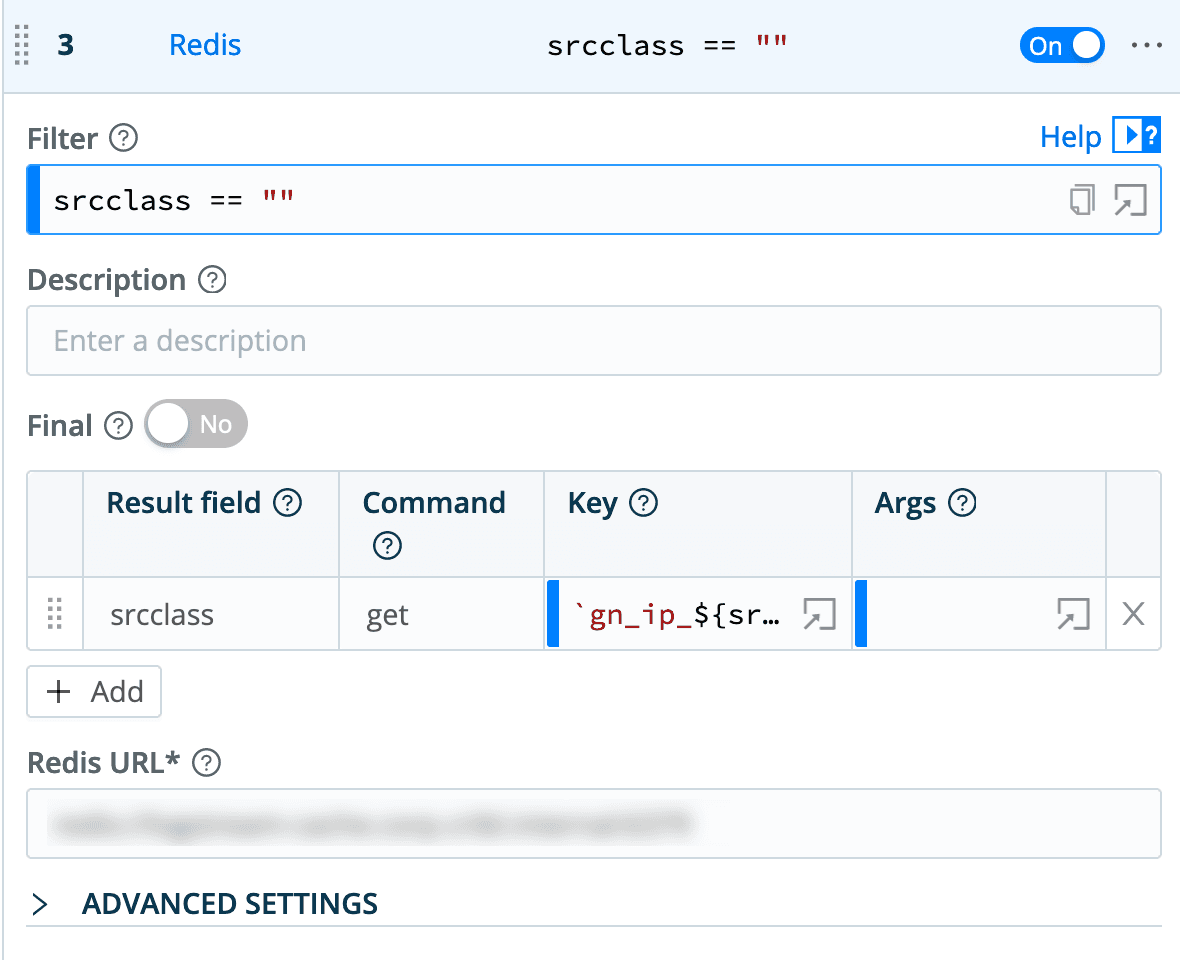
The last Redis function actually pulls AWS account names from our AWS Organizations master. In the downloadable version of this pipeline, I disable this function, and I will likely delete it in the future.
The Clone function is used to clone every event, setting a sourcetype of
aws:vpcflowlogson the clones (and an index ofcribl).The Aggregations function operates only on the original events (which have been assigned the sourcetype of
aws:vpcflowmetrics). It counts events and sums the bytes field of each, setting Group By Fields ofsrcclass,dstclass,aws_acct,action,dstaddr, andsrcaddr.The Publish Metrics function then takes the aggregations created in the previous step and formats them correctly for metrics destinations.
The final Drop function filters out all of the log events that we don’t want to send downstream – specifically, any “east/west” (internal to internal) traffic events, and any events that do not contain a classification of “malicious” or “unknown”.
The Output
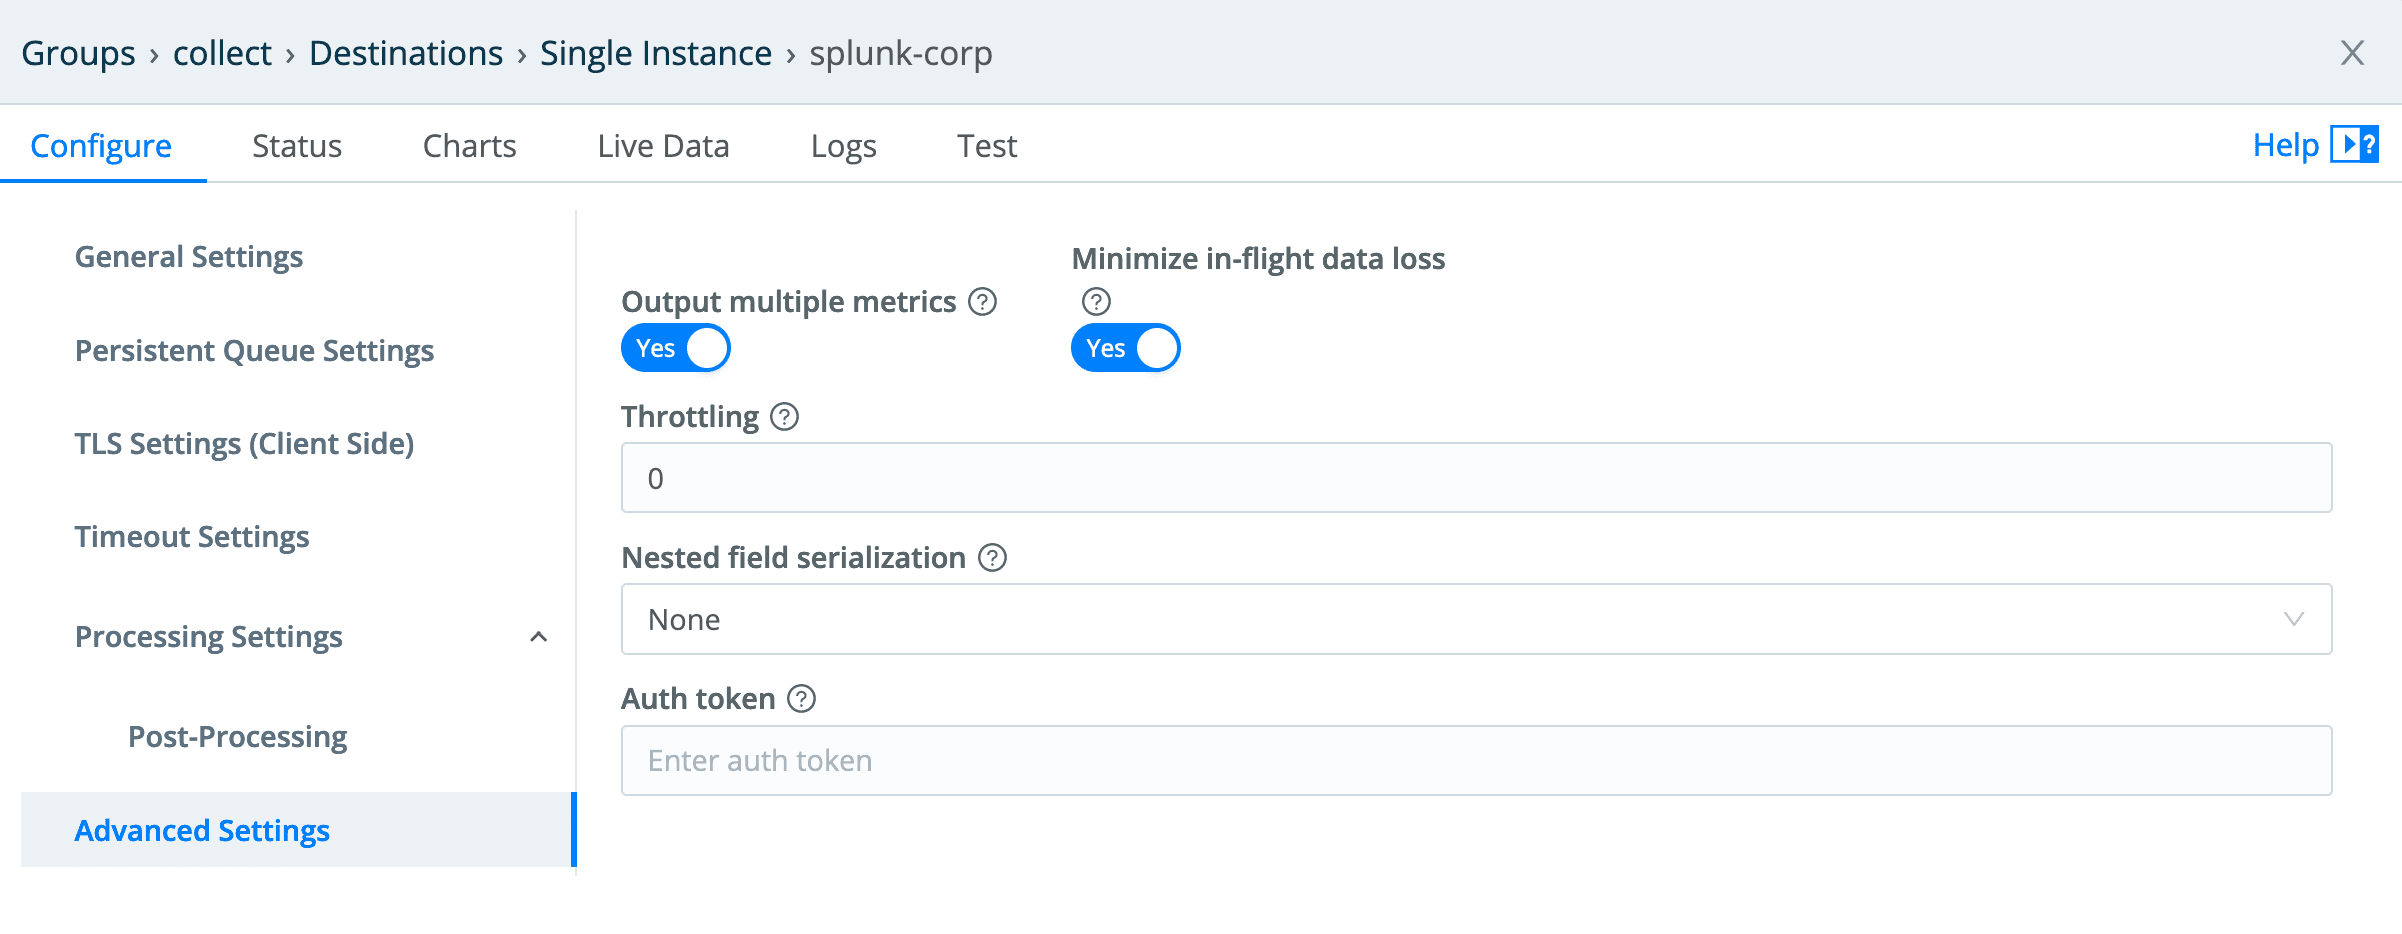
In this case, I’m using a Splunk destination, which I won’t cover in detail. But one important note is that I’m using the new multi-metrics capability that was introduced in LogStream 2.4. In the past, Splunk required metrics to be sent one at a time, so we would take metrics events, break them into single metric events, and send them individually. Splunk 8 introduced multi-metrics, and in 2.4 of LogStream we added support for it. This reduces the overhead of sending metrics to a Splunk destination. The configuration is a simple toggle in the LogStream Splunk destination’s Advanced Settings:
The Collector
The collector is pretty straightforward. As we’re running our LogStream environment in AWS, we run the Worker Groups with an IAM role that provides access to the S3 bucket. I will cover IAM nuances in a future blog post, so feel free to just use an IAM API key for this if you’re not running roles.
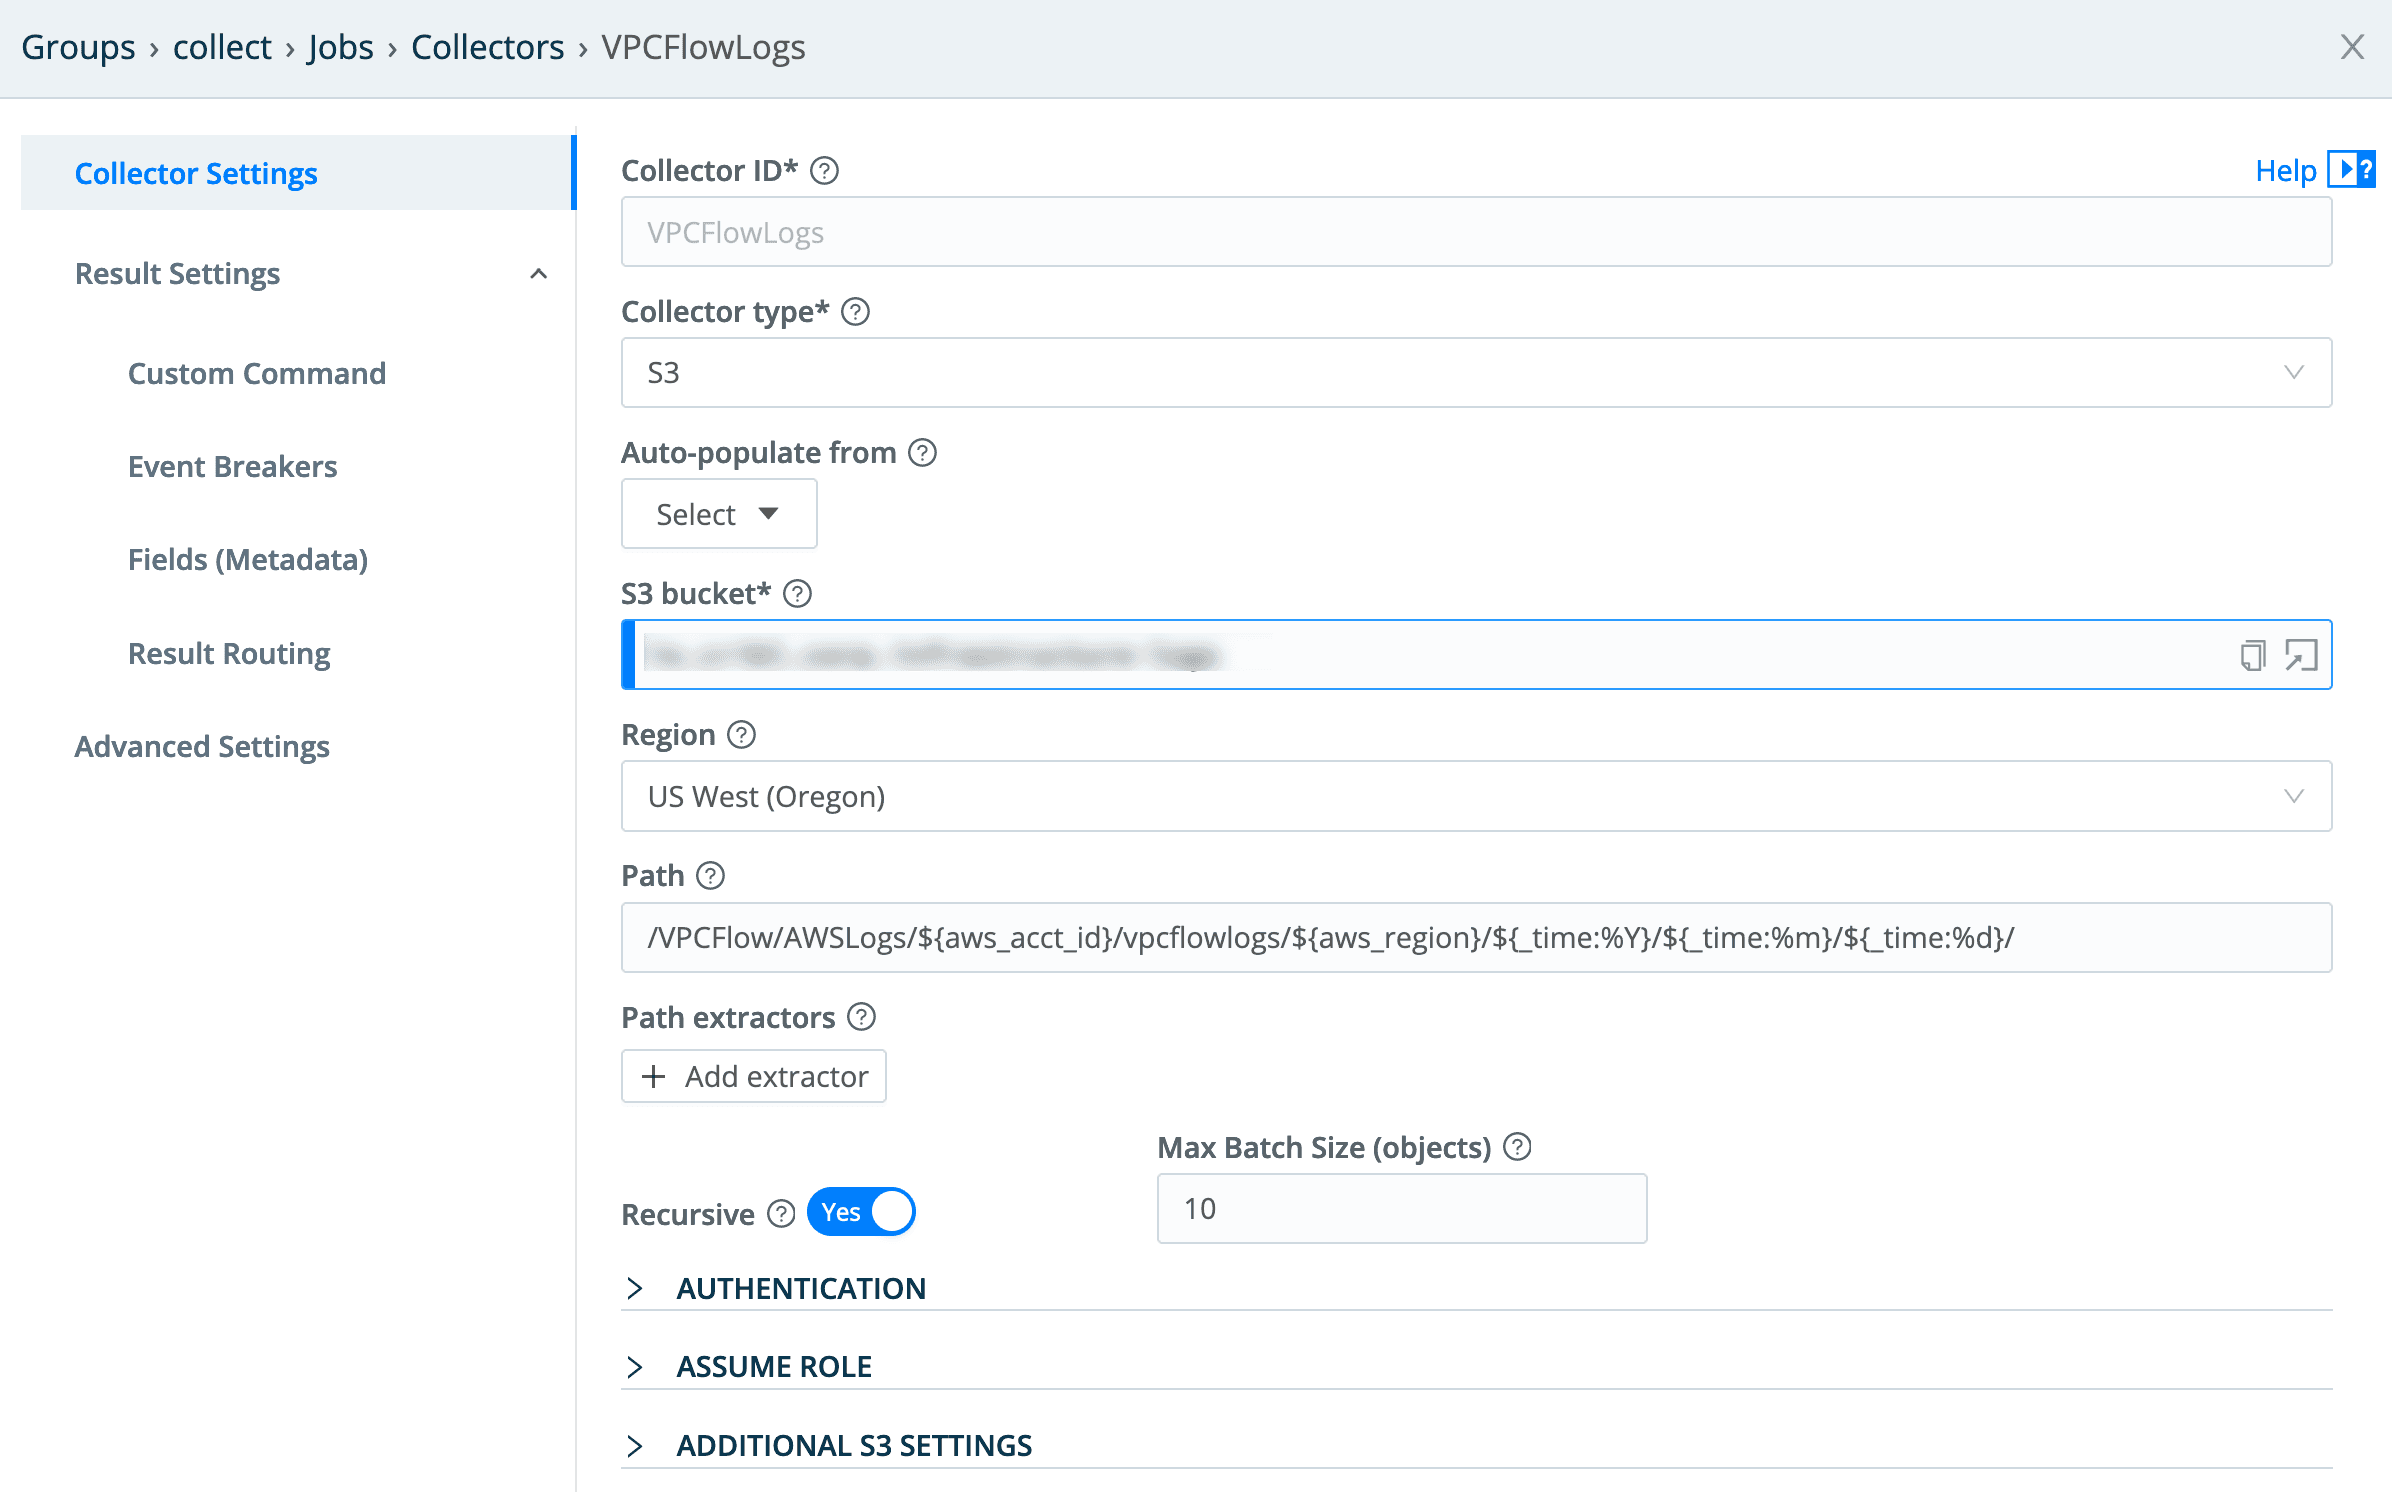
This is a pretty straightforward S3 collector configuration – the only real point of interest is the Path value:
/VPCFlow/AWSLogs/${aws_acct_id}/vpcflowlogs/${aws_region}/${_time:%Y}/${_time:%m}/${_time:%d}/
The first element is the key prefix we set when we set up VPC Flow Logs delivery in our environment, but everything else is standard AWS pathing for these logs. Note the templates I’m pulling out:
${aws_acct_id}– the 12 digit account ID.${aws_region}– the Region the logs are from.${_time*}– the three time elements here are parsing the time of the log from the path value –%Yis year,%mis month, and%dis day. This enables us to set start and end times for a given collection, and have it pull data only within that time window.
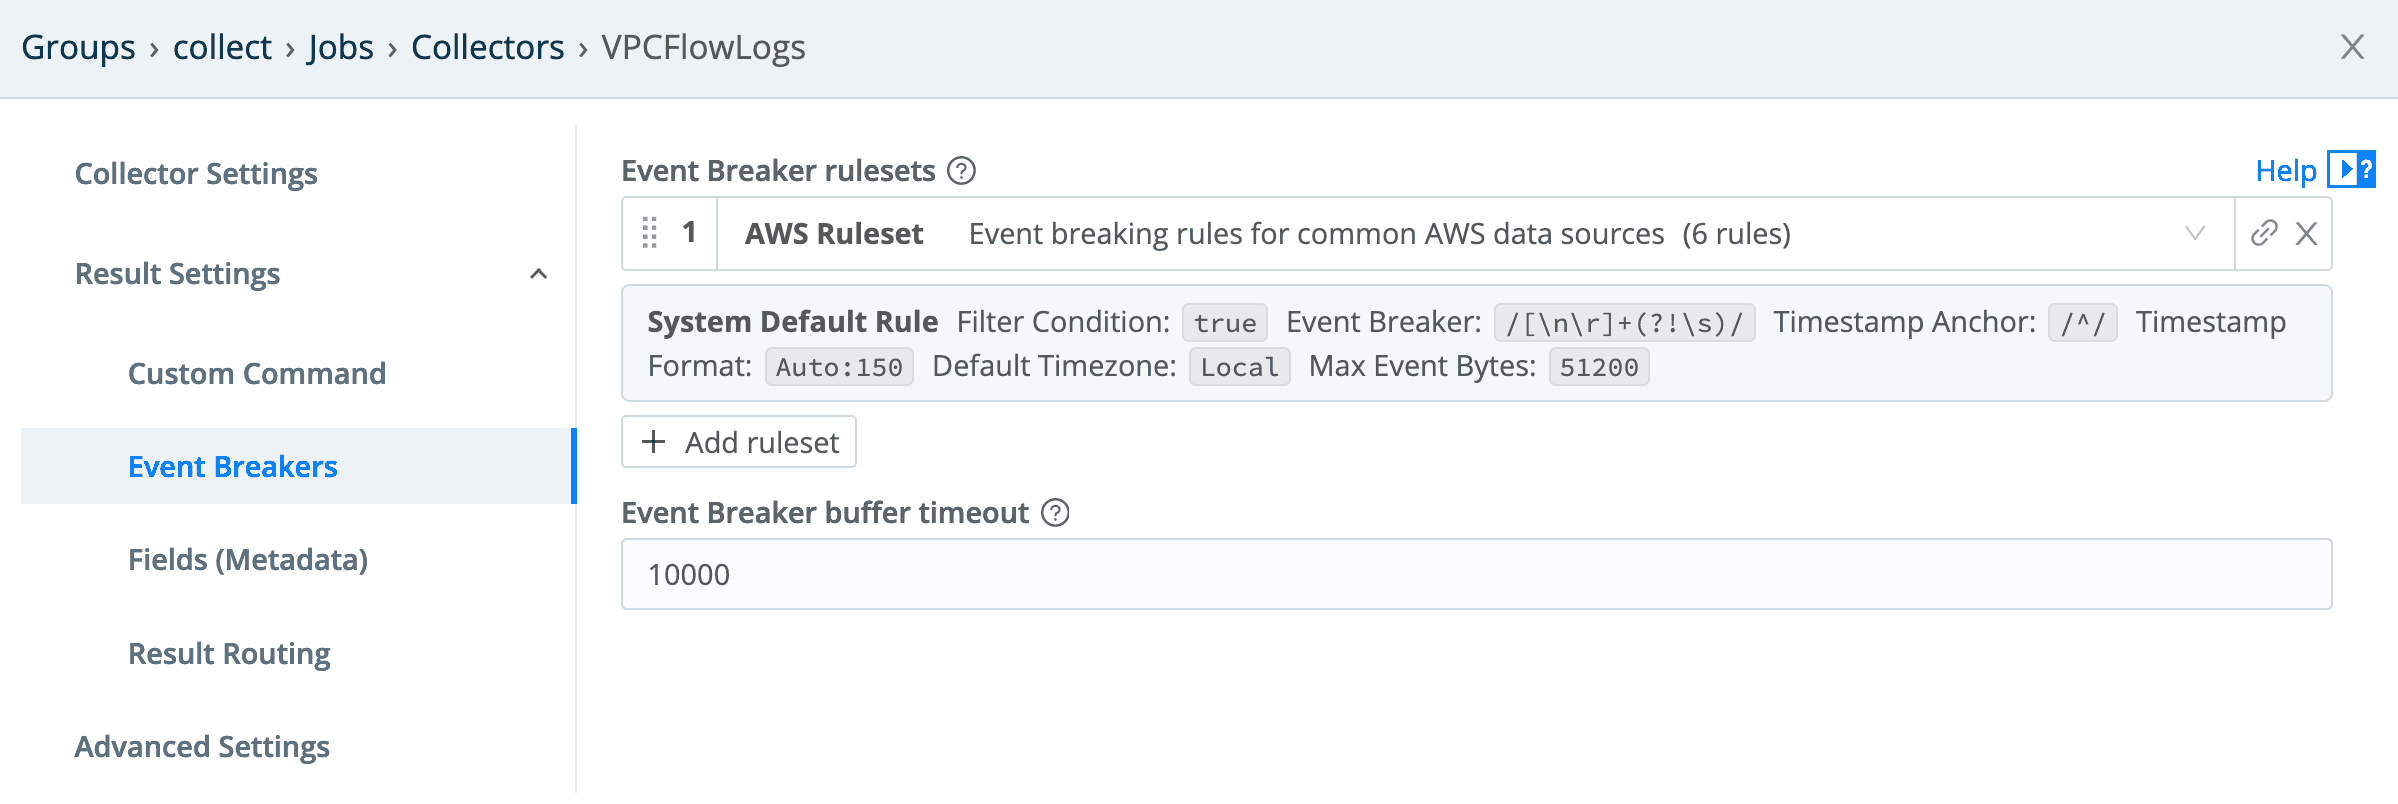
Since these are AWS VPC Flow Logs, the AWS Ruleset should be selected in the Event Breakers config:
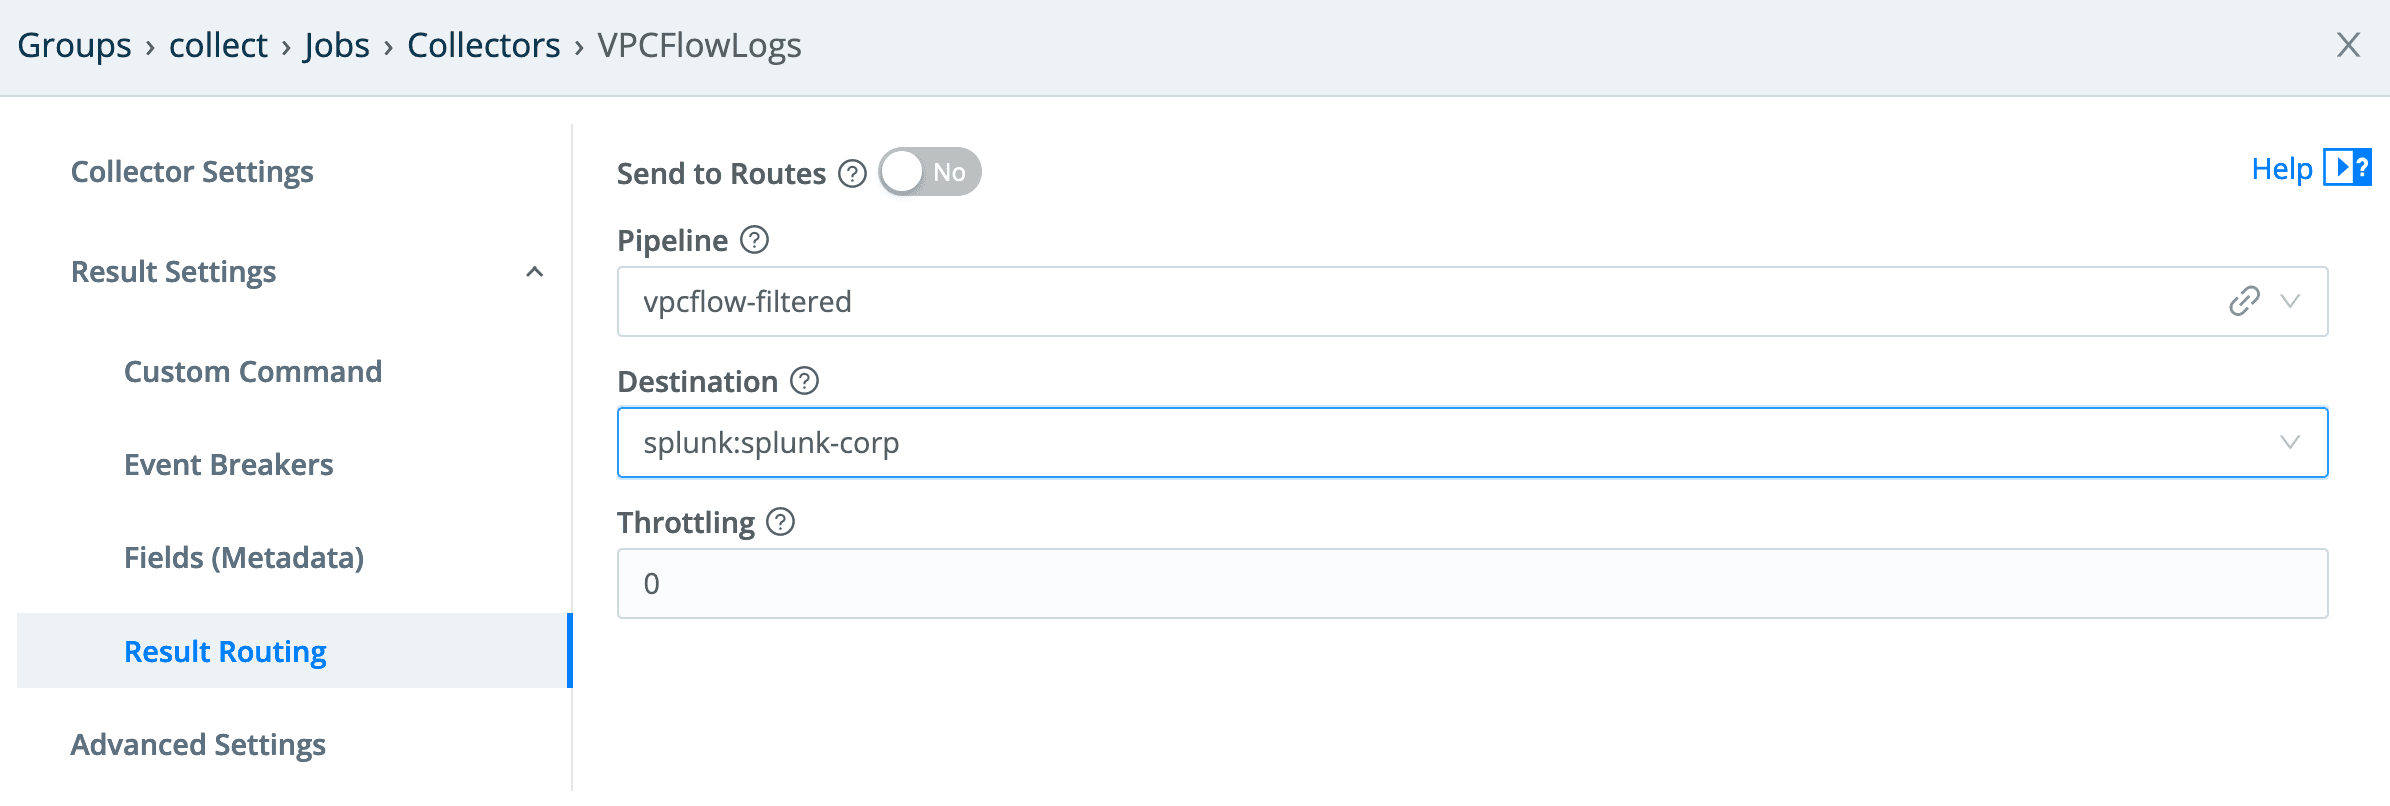
And finally, set our routing to push through the pipeline and out to our Splunk destination:
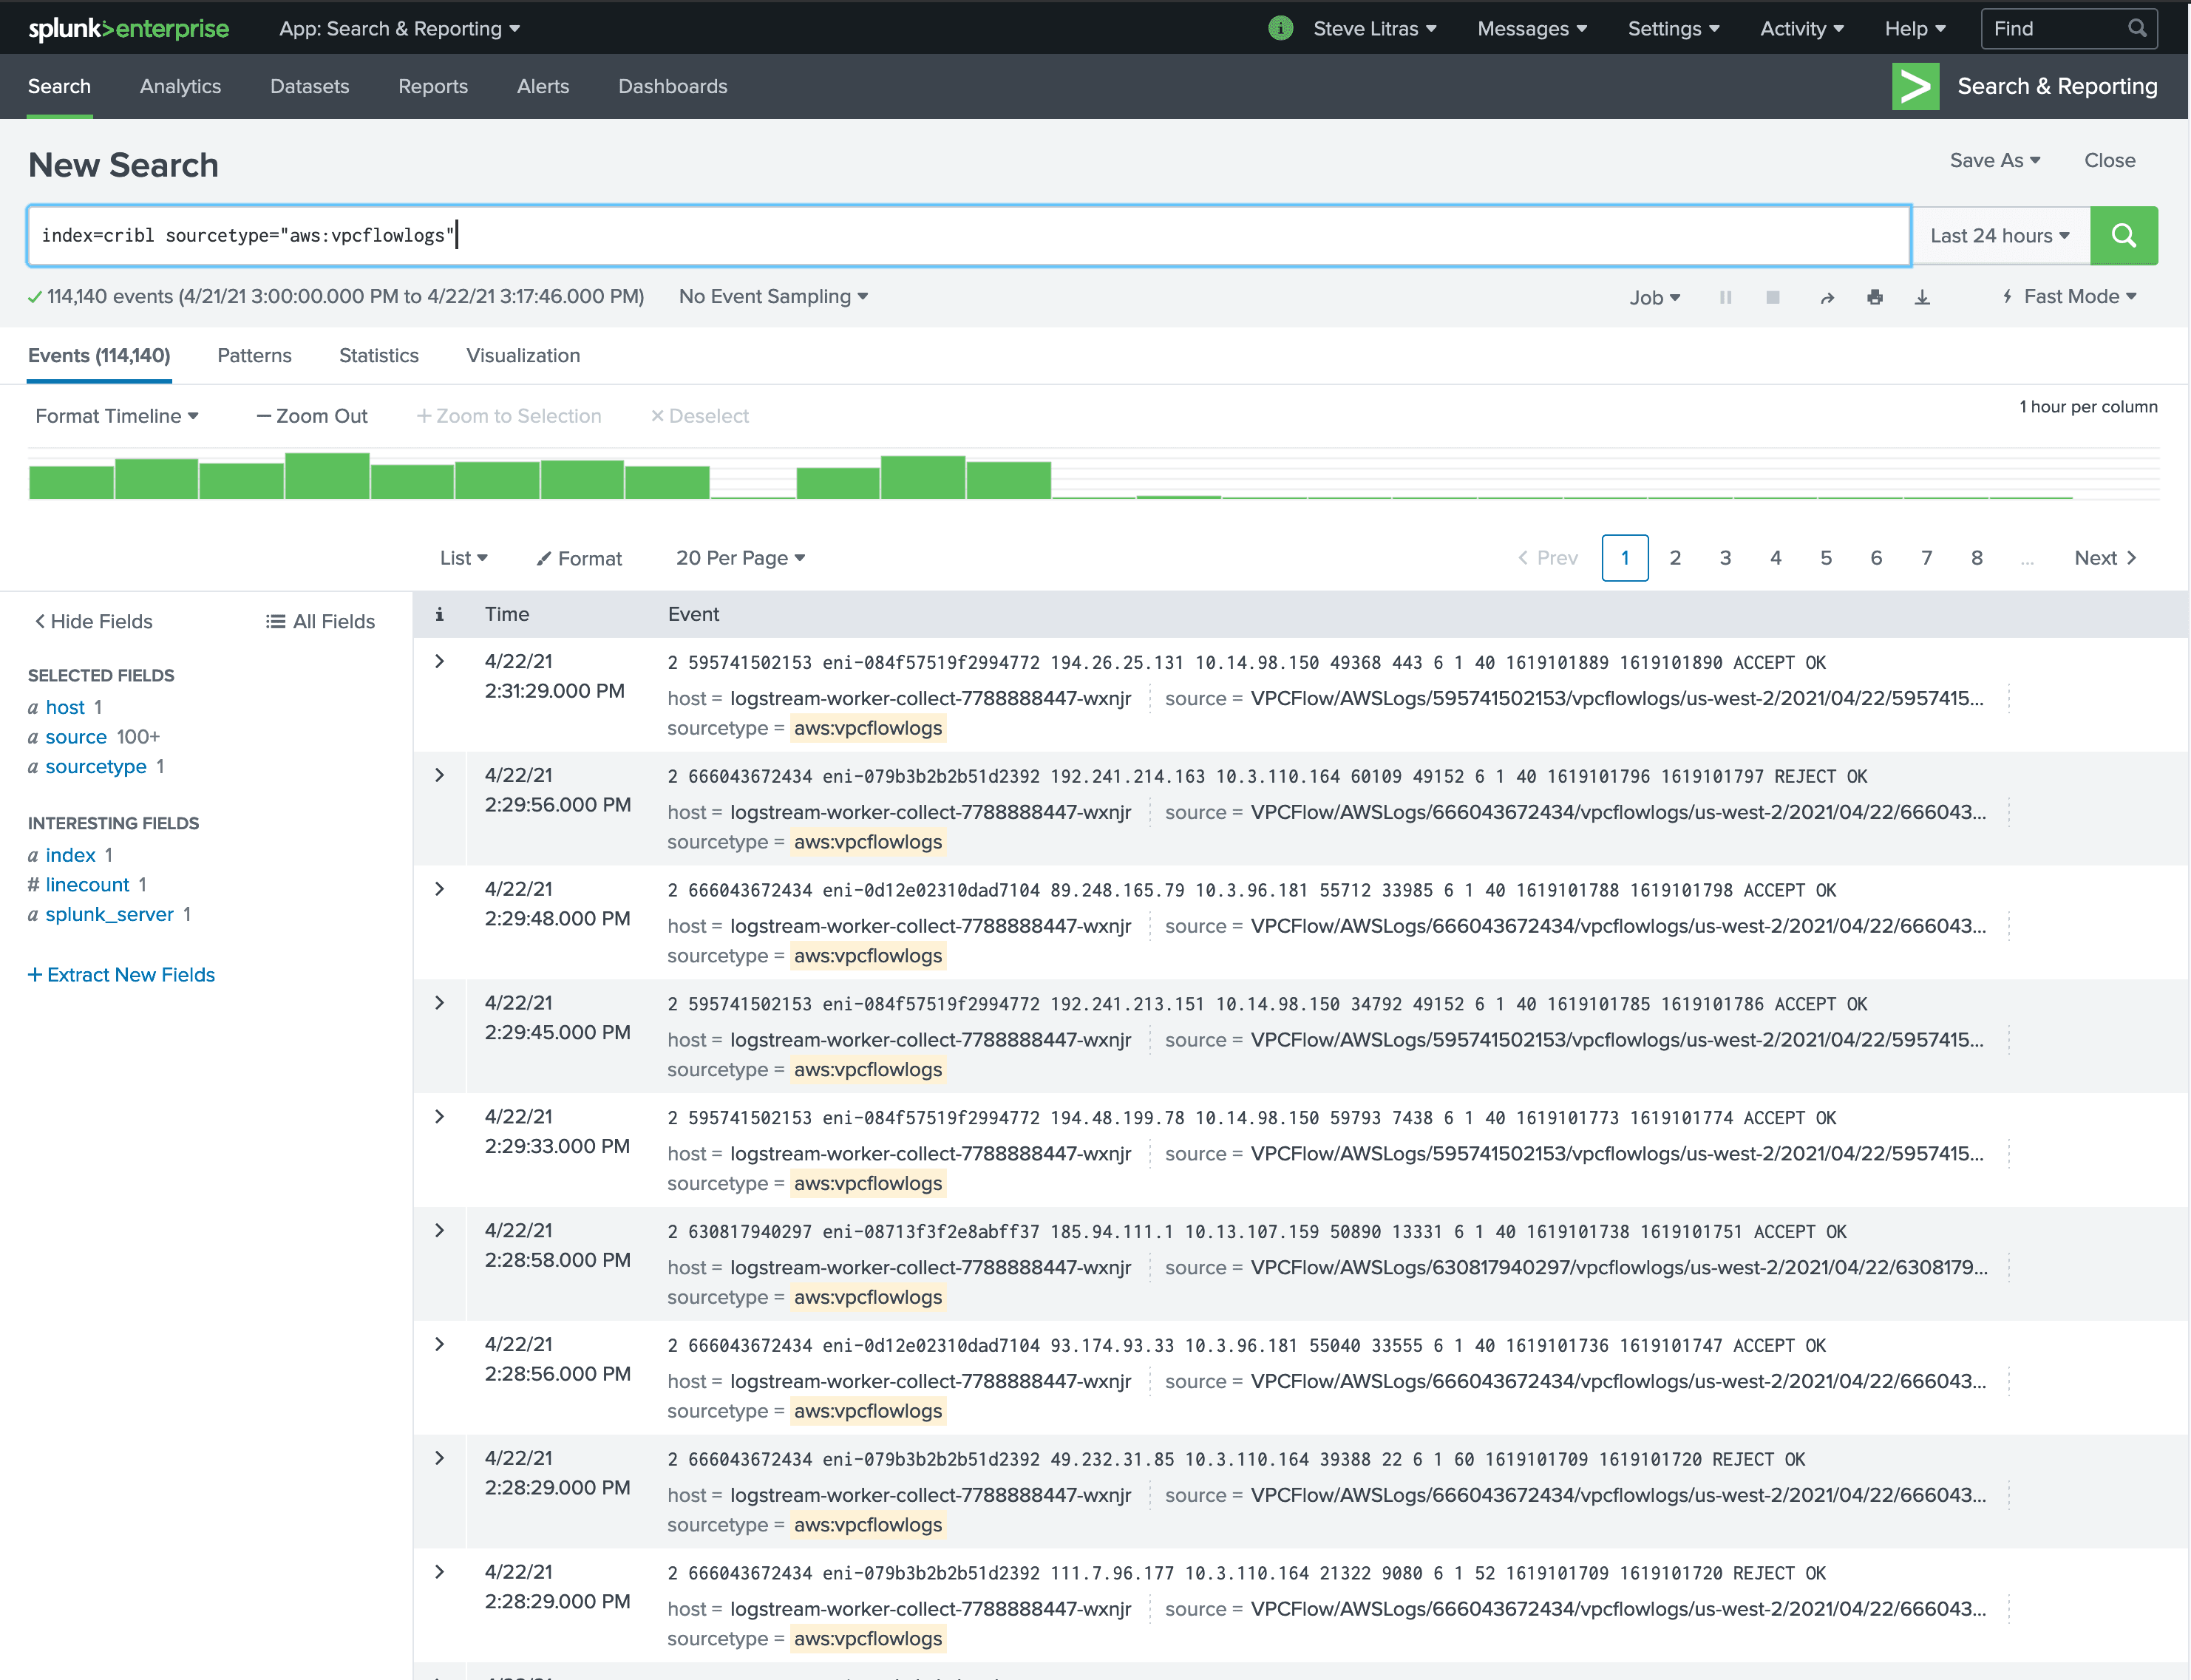
Now, when I execute a Full Run on the collector over a period of time, I see the metrics and logs populate in my Splunk destination.
Summing It All Up
While there is clearly a bit of complexity when trying to do enrichment with large, dynamic data sets, the Redis function in LogStream allows you to keep your lookup table(s) up to date as you see fit, enabling the creation of multiple pipelines using that same lookup table with pretty minimal effort. The use case I walked through here is indicative of many threat intelligence sources, and establishes an easy to replicate pattern for each of those types of sources.
If you want a hands-on introduction to enrichment, try our interactive Enrichment sandbox course. If you’re ready to try this in your own environment, download LogStream and process up to 1 TB of data per day, for free. If you have any questions about this article or anything in the LogStream and Cribl universe, be sure to join our community and share what you are doing there.