Cribl released Stream Cloud to the world in the Spring of 2021, making it easier than ever to stand up a functional o11y pipeline. The service is free for up to 1TB per day and can be upgraded to unlock all the features and support with paid plans starting at $0.17 per GB so you pay for only exactly what you use.
In this blog post, we’ll go over how to quickly get data flowing into Stream Cloud from a few common log sources.
Get Your Free Stream Cloud Instance
Head over to Cribl.Cloud and get yourself a free account now. After you have the account established, you’ll be presented with a list of input endpoints available for sending data into the service. Several ports are predefined and ready to receive data. There are also 11 ports (20000–20010) that you can define for yourself with new sources.
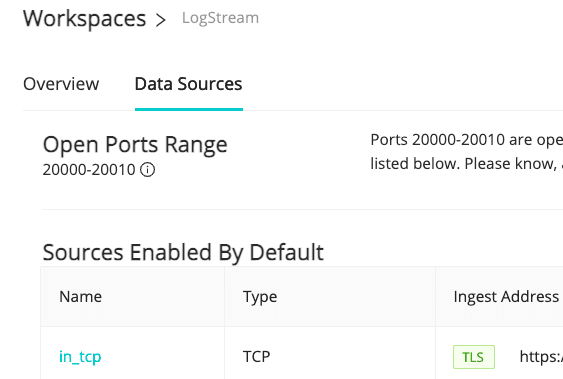
Only a few of the listed inputs reference actual products. The majority are open protocols that many different collection agents can use to send data into Stream. This is not intended to be a ground-up how-to for each source type. We’re assuming you are already using the source in question, and are simply looking for how to add a new destination pointing at Stream.
Sending Data to Stream Cloud from Various Agents
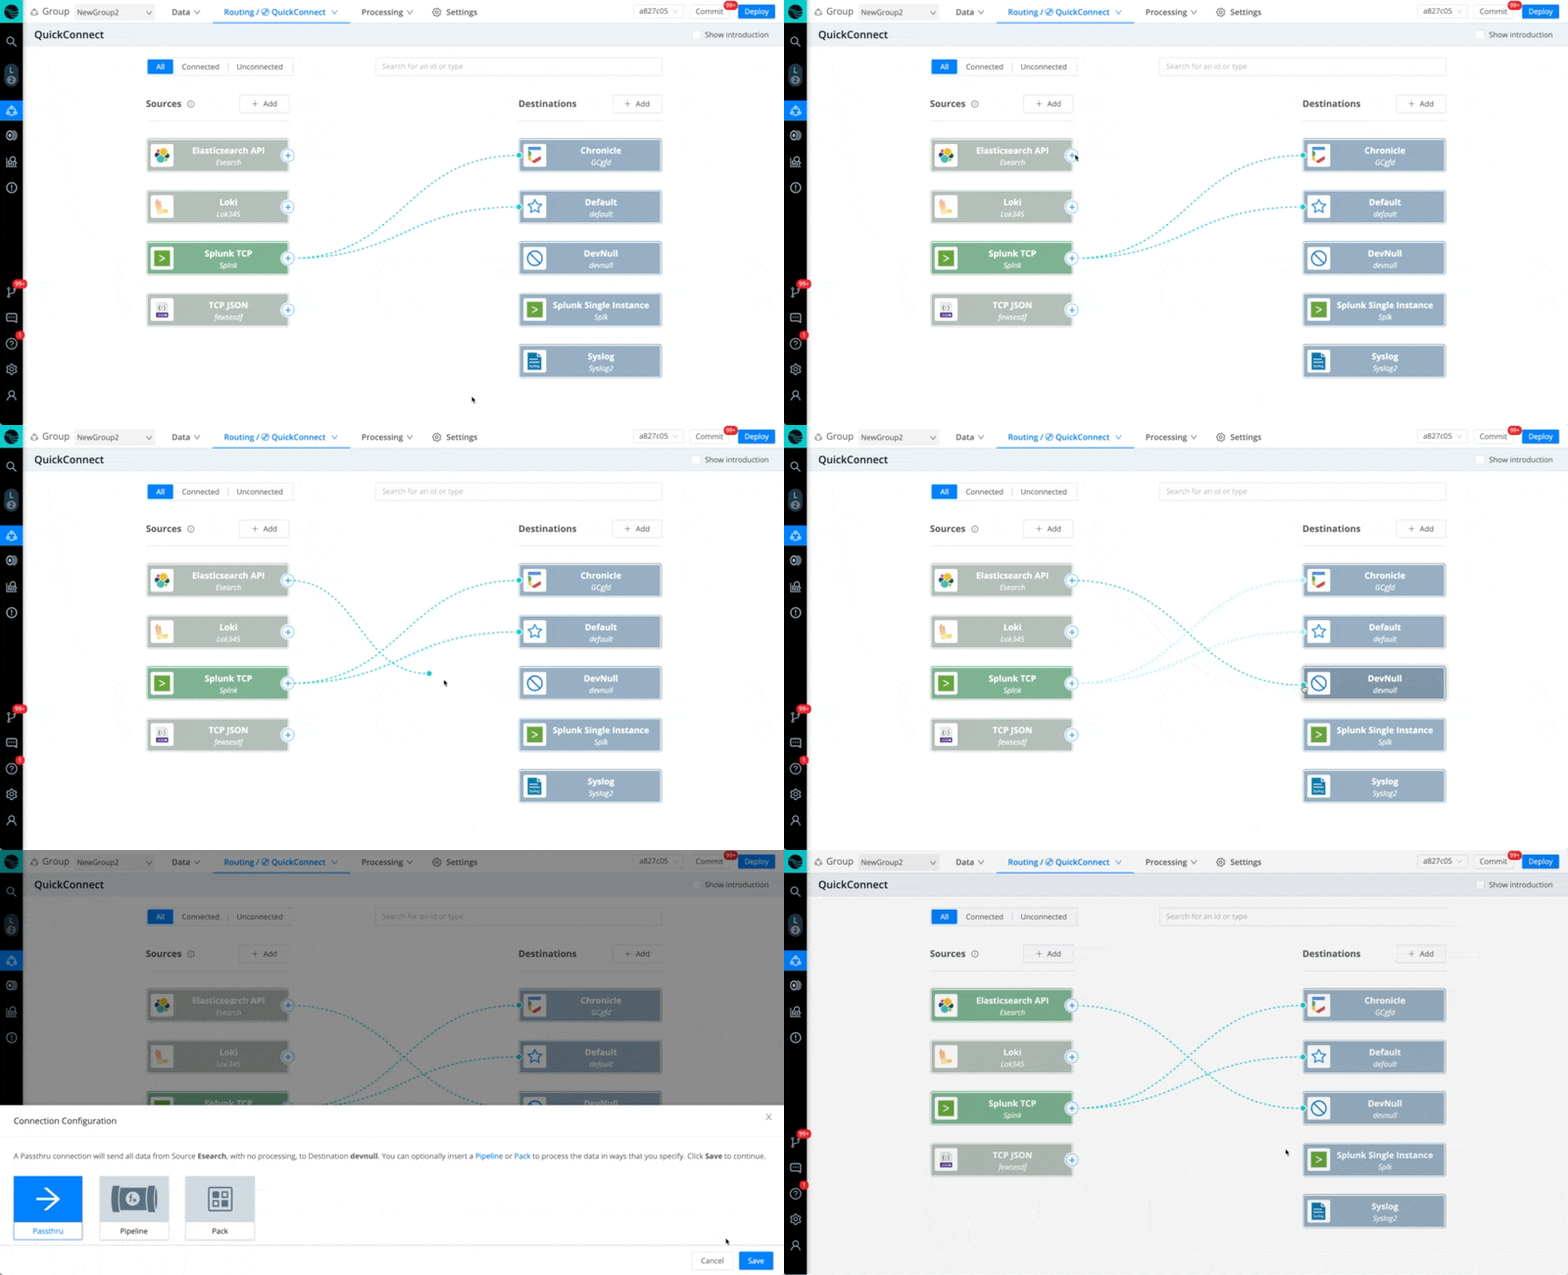
In every case below, we recommend starting a live capture on the Source in Stream once you activate Stream Cloud, to check and verify that the data is coming in. Also, save your capture to a sample file to work with while you build your Pipelines.
Finally, you can use these examples to configure on-prem or self-hosted Stream as well. The Stream Cloud offering simply comes with many ready to roll.
Fluent Bit to HEC
There are many output options for Fluent Bit, and several that would work with Stream. For this case, we’ll choose the Splunk HEC formatting option. You will need the Ingest Address for in_splunk_hec from Cribl.Cloud’s Network page. And you’ll need the HEC token from Sources -> Splunk HEC -> input def -> Auth Tokens. Finally, you’ll want to adjust match as appropriate for your use case. With an asterisk (wildcard) value there, we’ll be sending all events to the endpoint. Restart the td-agent-bit service after making the change. Fluent Bit settings are usually in /etc/td-agent-bit/td-agent-bit.conf.
[OUTPUT]
name         splunk
match        *
host         in.logstream.something.cribl.cloud
port         8088
splunk_token your_hec_token_here
tls          on
# optional
event_source logs_from_fluentd
Fluentd to HEC
We have the same caveats and pre-reqs as for Fluent Bit above, but the config is a bit different. You’ll need to install the splunk_hec fluentd mod if you don’t already have it, like so: sudo gem install fluent-plugin-splunk-hec. This config snippet will send all logs to the HEC endpoint. Restart fluentd after putting it in place.
  @type splunk_hec
  @log_level info
  hec_host in.logstream.something.cribl.cloud
  hec_port 8088
  hec_token your_hec_token_here
  index your_index_here
  source_key file_path

    @type json
Splunk Forwarder (Universal or Heavy) to Splunk TCP
Stream can ingest the native Splunk2Splunk (S2S) protocol directly. For Stream Cloud especially, we recommend setting an authorization token in Sources -> Splunk TCP -> Auth Tokens so that your receiver will accept only your traffic. You’ll also want to decide if all your traffic will be delivered, or if you want to create filters in Splunk to only send some traffic. In the stanza below, we assume all traffic. Restart the Splunk service after making the change in $splunk/etc/system/local/outputs.conf:
[tcpout]
disabled       = false
defaultGroup   = criblcloud

[tcpout:criblcloud]
server         = in.logstream.something.cribl.cloud:9997
sslRootCAPath  = $SPLUNK_HOME/etc/auth/cacert.pem
useSSL         = true
sendCookedData = true
token          = optional-but-recommended
Elastic Filebeats
Stream can ingest the native Elasticsearch streaming protocol directly. We recommend setting an authorization token in Sources -> ElasticSearch API -> General Settings -> Auth Tokens so that your receiver will accept only your traffic. (Note: To enable basic authentication, you’ll need to base64 encode a username:password combo, grab that string, and put it in the Auth token area of the Elasticsearch API input with “Basic “ prepended.)
output.elasticsearch:
  hosts: ["in.logstream.something.cribl.cloud:9200/search"]
  protocol: "https"
  ssl.verification_mode: "full"
  username: some_username
  sassword: some_password
If you use basic auth, the Stream side would look something like this (see note above re: base64 encode):

syslog-ng (UDP or TCP)
⚠️ We do not recommend using UDP over the public internet for at least two reasons: 1) it’s not secure; and 2) there is no guarantee of delivery. TCP handles the second problem, but open text is still an issue. See TLS-enabled delivery in the next section for the recommended way to deliver syslog. The below example is included for testing purposes only. Substitute UDP for TCP to switch protocols. Restart the syslog-ng service after making the change.
destination d_syslog {
    syslog("in.logstream.something.cribl.cloud"
        transport("tcp")
        port(9514)
    );
};

log {
    source(s_network);
    destination(d_syslog);
};
syslog-ng (TLS over TCP)
This is the recommended way to deliver syslog data from syslog-ng. All event data will be encrypted on the way to Stream Cloud. Restart the syslog-ng service after making the change.
destination d_syslog {
    syslog("in.logstream.something.cribl.cloud"
        transport("tls")
        port(6514)
        tls(
            peer-verify(required-trusted)
            ca-dir("/etc/syslog-ng/ca.d")
        )
    );
};

log {
    source(s_network);
    destination(d_syslog);
};
rsyslog (UDP or TCP)
⚠️ See previous warning in the syslog-ng section re: TLS – it’s the same with rsyslog.
*.*action(
         type="omfwd"
         target="in.logstream.something.cribl.cloud"
         port="9514"
         protocol="tcp"
         action.resumeRetryCount="100"
         queue.type="linkedList"
         queue.size="10000"
)
rsyslog (TLS over TCP)
This is the recommended way to deliver syslog data from rsyslog. All event data will be encrypted on the way to Stream Cloud. Restart the rsyslog service after making the change. Your system will need the rsyslog-gnutls package installed if it’s not already. (E.g.: apt install rsyslog-gnutls)
# path to the crt file.
# You will need a valid ca cert file. Most linux distros come with this
$DefaultNetstreamDriverCAFile /etc/ssl/certs/ca-certificates.crt

*.*action(
         type="omfwd"
         target="in.logstream.something.cribl.cloud"
         port="6514"
         protocol="tcp"
         action.resumeRetryCount="100"
         queue.type="linkedList"
         queue.size="10000"
         StreamDriver="gtls"
         StreamDriverMode="1" # run driver in TLS-only mode
)
Vector to HEC
Vector comes with HTTP Event Collector (HEC) support. We’ll use the HEC source as with the above examples for Fluentd/Fluent Bit. For Stream Cloud especially, we recommend setting an authorization token in Sources -> Splunk HEC -> Auth Tokens so that your receiver will accept only your traffic. The below example references a random syslog generator called dummy_logsfor testing purposes. Update to your own source definition(s) as appropriate.
[sinks.my_sink_id]
type           = "splunk_hec"
inputs         = [ "dummy_logs" ]
endpoint       = "https://in.logstream.something.cribl.cloud:8088"
compression    = "gzip"
token          = "optional-but-recommended"
encoding.codec = "json"
Vector to ElasticSearch
Vector comes with Elasticsearch API support. The below example references a random syslog generator called dummy_logs for testing purposes. Update to your own source definition(s) as appropriate. (Note: To enable basic authentication, you’ll need to base64 encode a username:password combo, grab that string and put it in the Auth token area of the Elasticsearch API input with “Basic “ prepended. See previous ElasticSearch API section for an example.)
[sinks.elastic_test]
type          = "elasticsearch"
inputs        = [ "dummy_logs" ]
endpoint = "https://in.logstream.something.cribl.cloud:9200/search"
compression   = "gzip"
index         = "my_es_index"
auth.user     = "some_username"
auth.password = "some_password"
auth.strategy = "basic"
AppScope
AppScope integration is dead simple. There are a few ways to do it, but the easiest way to integrate a single ad hoc process is to set an environment variable pointing to your Stream Cloud instance on port 10090:
SCOPE_CRIBL=tls://in.logstream.something.cribl.cloud:10090 scope cmd…Appliances that Send syslog
There are many, many appliances that send their logs over syslog. If possible, always choose sending over TCP with TLS enabled. Alternatively, and perhaps preferably, stand up a Stream instance near the appliances producing the logs. Have the appliances send to the nearby Stream, optionally transform, filter, or enhance the logs there; and then pass them through to a more centralized Stream cluster or the Stream Cloud offering.
The middle-tier Stream worker will use TCP JSON, with TLS enabled, to send to the upstream instance. The sending side will use the TCP JSON output, also with TLS enabled.

The first Stream stop serves a few purposes: First, it’s “close” to the log producer. UDP could be an option here, since there are fewer network hops. If TCP is used, it can still be quite a bit more performant here than TCP across the internet. Next, we can perform some of the reduction work, which will reduce what hits the wire on the way to the next hop. Finally, we will compress before sending to the next hop, further reducing the volume sent.
A Few Pull-based Sources
Not all data is pushed to your log pipeline. Some will need to be pulled. Stream Cloud can handle this as well.
Below are rough config concepts for some commonly used Sources.
Kafka
The Kafka Source configuration process in Stream Cloud is the same as how you would set up on-prem or self-hosted Stream for Kafka.
AWS Kinesis Firehose
Stream Cloud currently sits behind an NLB, which Kinesis Firehose does not support. A better option would be to write to S3 and collect from there. The exact process won’t differ from how you would set up on-prem or self-hosted Stream for S3 Sources. You’ll need to point your KDF Stream to an S3 bucket, and then proceed with a normal S3 source def (next section).
AWS S3
The S3 Source configuration process in Stream Cloud is the same as how you would set up on-prem or self-hosted Stream for S3 Sources. We have also previously published more in-depth info on S3 Sources, which also applies to Stream Cloud. Here’s a summary:
Configure an S3 bucket to send
s3:ObjectCreated:* events to an SQS queue.Configure Stream’s S3 Pull Source (not Collector) to subscribe to your SQS feed from step 1. Note: Permissions will need to be properly configured for the Secret/Access keys you use under authentication.
Set up Event Breaker rules as required based on the contents of your log files.
Office 365 Service, Activity, or Message Trace
The O365 Source configuration process in Stream Cloud is the same as how you would set up on-prem or self-hosted Stream. If you’re new to O365 content, be sure to read up on how to activate the subscription, which needs to be done from the O365 side of the conversation before any data will be available to pull.
Conclusion
Cribl Stream has changed the machine data game with an easily configurable, high-performance o11y pipeline to transform, route, reduce, and replay your digital exhaust. Stream Cloud makes it even easier to get started making Pipelines, by providing a free, ready-to-run instance just waiting for data to process. This document didn’t cover all the Sources Stream can handle, instead of focusing on the most popular ones. Check out the complete list of Stream integrations.
If the examples above don’t cover your particular situation, our Community Slack is a great resource to get help.
The fastest way to get started with Cribl Stream is to sign-up at Cribl.Cloud. You can process up to 1 TB of throughput per day at no cost. Sign-up and start using Stream within a few minutes.


