
In the last few years, many organizations I worked with have significantly increased their cloud footprint. I’ve also seen a large percentage of newly launched companies go with cloud services almost exclusively, limiting their on-premises infrastructure to what cannot be done in the cloud — things like WiFi access points in offices or point of sale (POS) hardware for physical stores.
As a result, security teams at these organizations need better visibility into what’s actually going on in their cloud environments. Cloud providers help with visibility somewhat, but that is just not enough for security teams. After all, that’s what the cloud providers are saying: it’s a shared security responsibility model, and security teams need to do their part.
Challenges with VPC Flow Logs
You cannot just not monitor and analyze your security data sources in the cloud, so you already have some sort of solution in place. But are you currently monitoring and analyzing all of those data sources? For example, if you use AWS, you likely started from looking at CloudTrail logs, AWS Config, maybe S3 access logs. But when you go through the list of AWS log sources, you inevitably get to VPC Flow Logs that can easily be several times larger than all your other AWS logs combined. And you ask yourself: “Can I afford sending that much data to my security tool (Splunk or Elasticsearch, SIEM, UBA, etc.)?” The answer can often be no, especially if your tools are licensed based on data volume or you require extra infrastructure to run the tool on.
If you’re not looking at what’s happening on your network in the cloud, it’s easy to miss anomalous network traffic patterns that can alert you to potentially malicious activities like data exfiltration, lateral movement attempts, communication with a command-and-control (C2) hosts, and so on.
Another challenge I consistently see is the lack of context. Even if you start analyzing VPC Flow Logs, how easy is it to figure out what each IP address means in your environment? In a cloud environment where many things are ephemeral, the issue with context becomes even bigger. You cannot just look up which container or instance had a specific IP address. That container or instance might have existed for a brief moment last Friday. If the VPC Flow Logs are not enriched with host information at the time the logs are collected, figuring out the meaning of those IPs can be very difficult later. But if you start enriching already voluminous flow logs, the volume will go up even more.
Cribl Stream and Packs to the Rescue
So what can you do? In this post, I’ll share a practical approach using Stream to simultaneously add context to logs while reducing their volume. We’ll use AWS VPC Flow Logs as an example here, but the logic can be applied to other cloud flow logs and security data sources.
The steps to configure Cribl Stream and VPC Flow Logs are:
Step 1. Add the VPC Flow Logs Pack for Security Teams to your Stream environment. Add this pack to your Stream or Stream Cloud environment. If you haven’t used Packs yet, this is a good overview.
Step 2. Select the transformations you’d like to apply, such as data reduction, enrichment, and format changes. Select the VPC Flow Logs sample that comes with the Pack and experiment with enabling and disabling Function Groups to see what the events look like when you toggle optional groups on and off. We will go over that in a bit. On the screenshot below you can see the Function groups that have comments above them describing what each group does, and whether a group is optional or required for the pack to function.

Step 3. Create a Route in Stream and attach the Pack to the Route. Create a Route from the source where your logs are coming from (e.g., S3, Kinesis Firehose) to your security tool, and select the Pack’s pipeline called VPC Flow Logs for Security Teams in the dropdown list for the Pipeline field.
Step 4. Configure VPC Flow Logs to be sent to Stream. Follow these AWS instructions to publish the logs to S3, or send them to AWS Kinesis Data Firehose. If you are using the S3 method, you will benefit from hooking up AWS SQS to avoid scanning S3 for what’s new on a schedule. Once you are done with configuration on the AWS side, enable the matching Stream input (called Amazon SQS or Amazon Firehose in the Stream UI).
A Closer Look at Reduction, Aggregation, and Enrichment
Let’s dive a bit deeper into some of the Pack functionality and the Function Groups, starting from data reduction. You can begin by focusing on passing events containing flows to/from public IPs only; this will drop all East-West traffic events (communication between private IPs as defined in RFC1918). Another way to reduce data volume is to aggregate similar events. VPC Flow records are already aggregated, and you can configure aggregation intervals in AWS. You can further aggregate the events over longer windows and remove some information like port numbers for rejected traffic. Remember, you can still have all of the original events sent to S3 and, using Stream Replay, bring in the original events to your security analytics tool if you need more granularity to, for example, investigate all the accepted and rejected communication attempts from an external IP.
This is a good time to mention that it would be a great idea to have an in-memory database like Redis connected to Stream. The in-memory part is important since we are streaming large volumes of data through Stream. Also, going to disk to query a database will easily introduce latency that is unacceptable for streaming. Plus, when we aggregate events, an in-memory database can be accessed by multiple Worker Nodes, and the aggregation will be done across a Worker Group that will result in a better data reduction. AWS provides a managed Redis service as ElastiCache for Redis. When using the Pack with Redis, remember to specify where your Redis is by adding the Redis URL in the Redis Functions of the Pack.
You can decide to have JSON formatter flow events going to your security analytics tool, but if your tool can work with CSV events you can also use the CSV format to lower the data volume.
Now to the enrichment part. You can add Geo IP location data to your flow events (see this blog for an overview). You can also add asset information to your flow events. For example, if there is an IP address like 10.0.123.123 in your log, what does it tell you? Not much on its own, typically. But what if you can see in the same event that the IP address 10.0.123.123 is a critical EC2 instance with the hostname of customer_accounts_db? That would be more meaningful for alerting, investigations, threat hunting, etc.
There are two ways to enrich the events: via a lookup and using Redis. The lookup assets.csv is included with the Pack. You can upload your asset information with the columns matching the ones in the lookup. The other option is to use Redis. Using Redis gives you more flexibility in how you create, read, update and delete asset data, and you don’t need to re-upload your CSV lookup files to Stream Leader Node which, in turn, needs to distribute the lookups to the Worker Nodes.
The Result
VPC Flow Logs are now reduced and enriched. The screenshot below shows some example data reduction and enrichment results: 92% event count reduction and 89% data volume reduction in a small lab. Your data reduction mileage will vary depending on your environment, but it can be significant enough for you to start sending VPC Flow Logs to your security analytics tool without blowing up your license or infrastructure costs. Also, take a look at the before and after tables for the data context that makes your security team more efficient, and eliminates guesswork when it comes to IP addresses’ location a year ago, or mapping IPs to hosts at a later time when those hosts no longer exist.
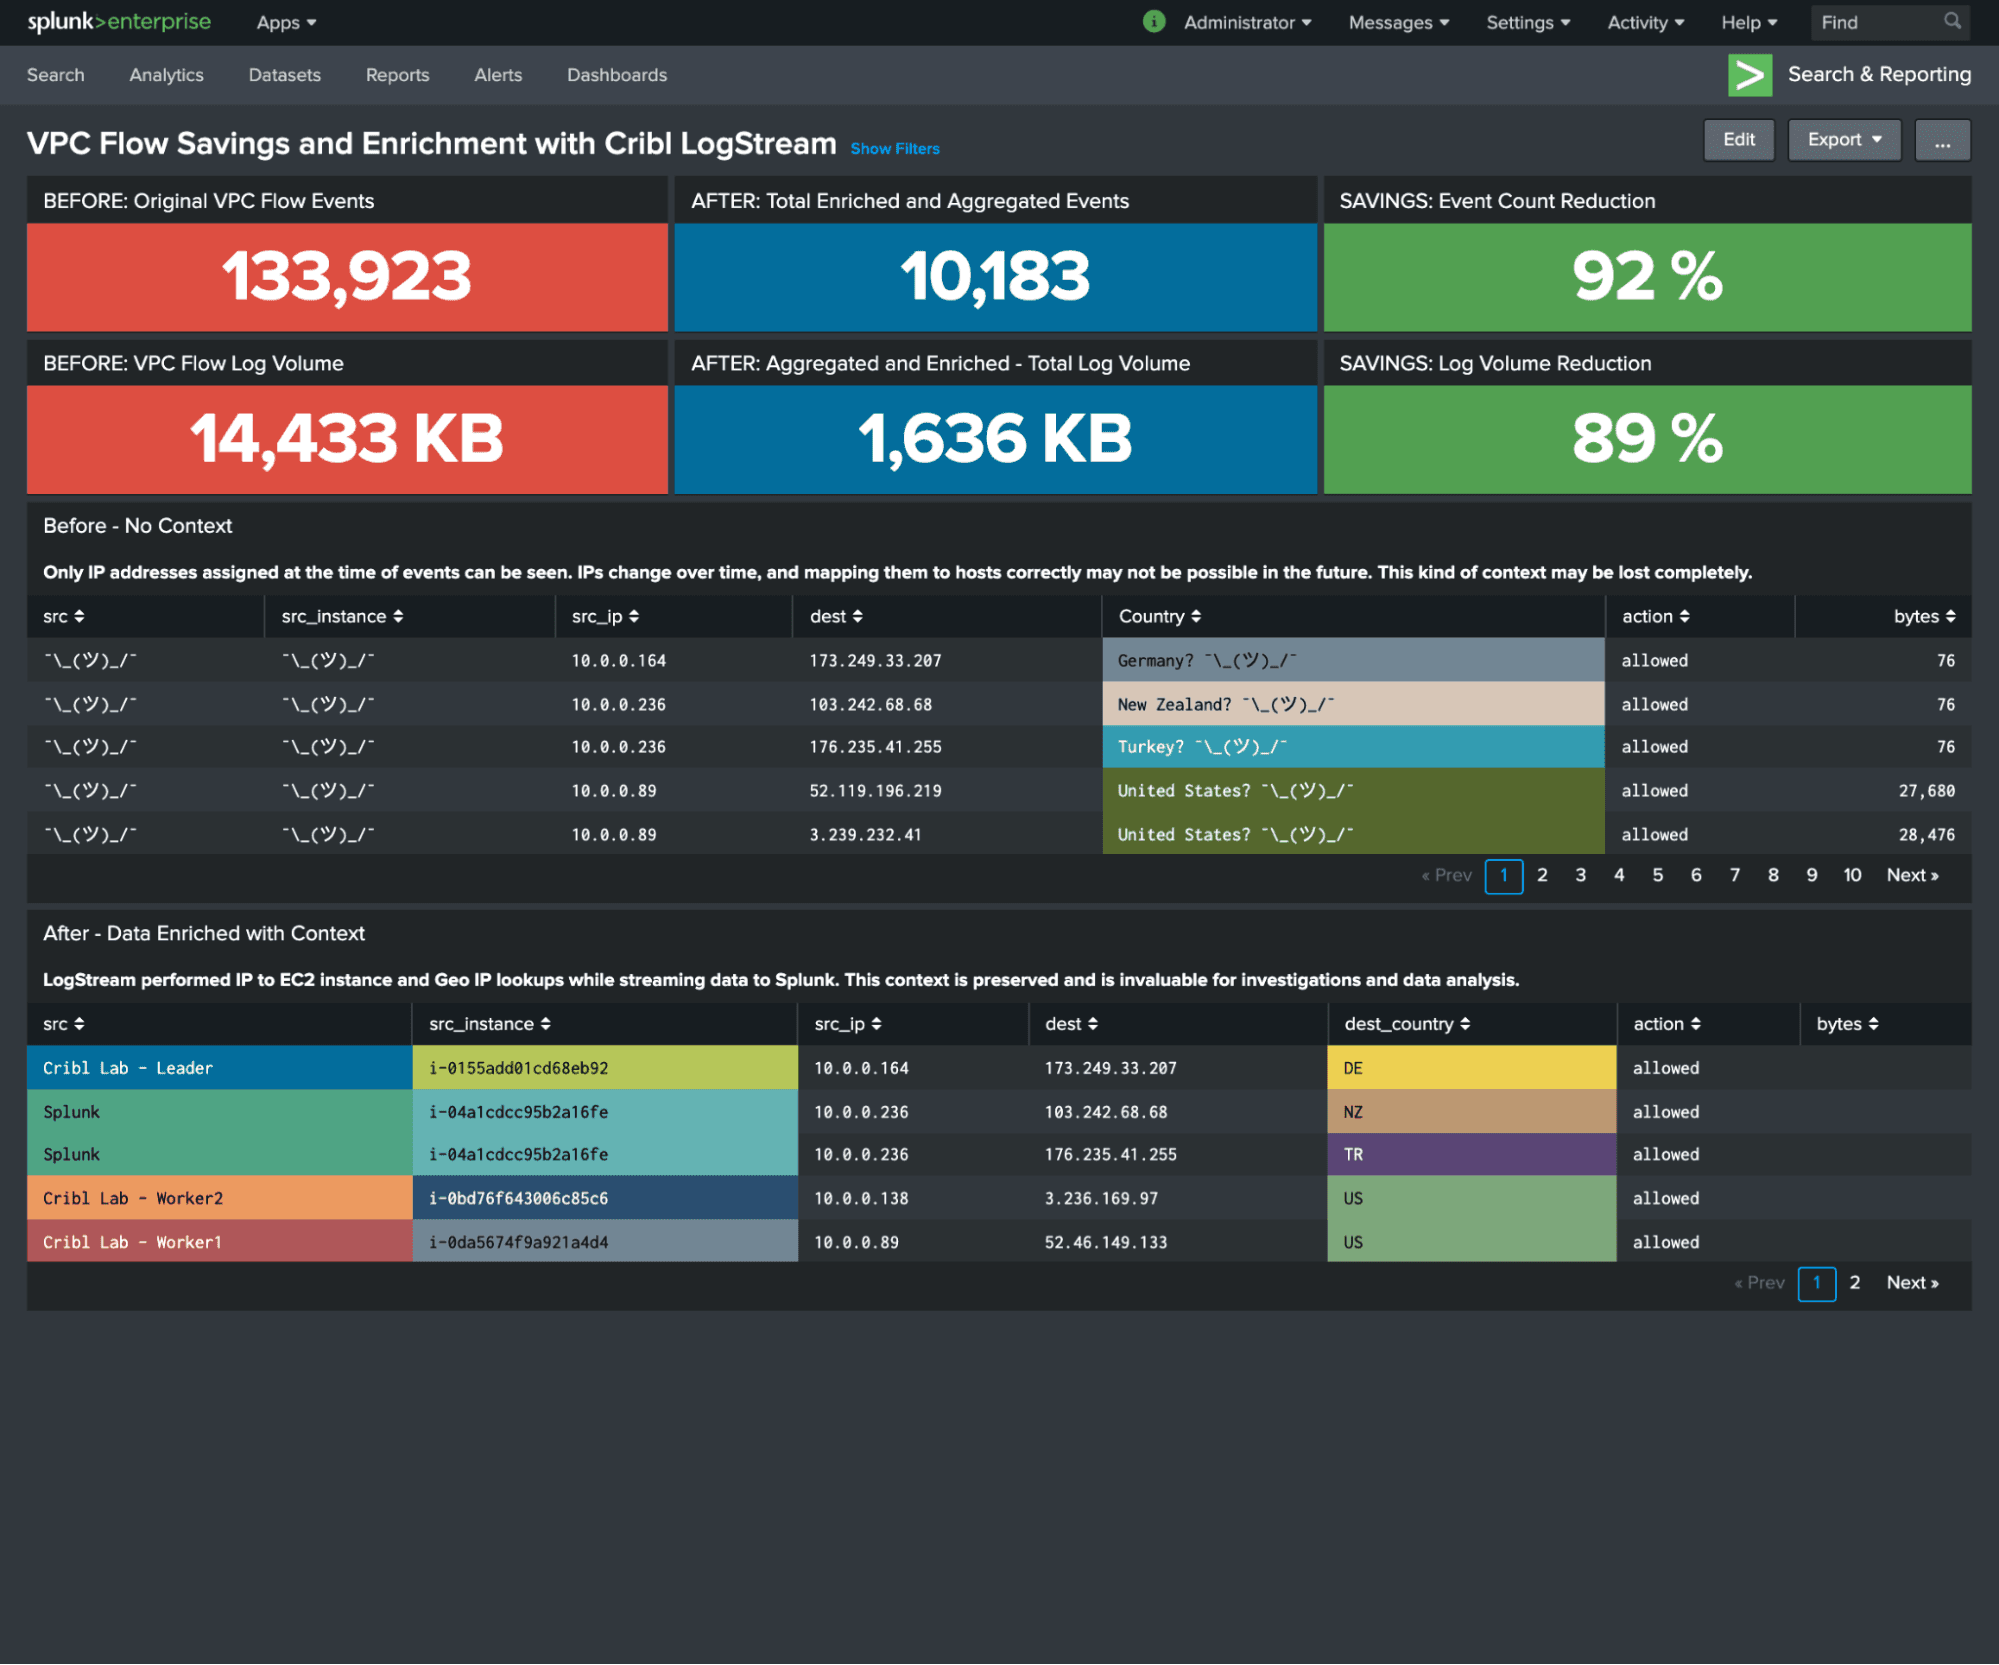
As you can see in the example below, after significantly trimming down the volume, you still have good visibility into what’s happening on your network in the cloud — who talks to whom, over what protocol, who transferred a significant amount of data, what was let through, and what communication was blocked. You are sacrificing some granularity but, again, you can always get the original VPC Flow Log data using Stream Replay.

Summary
The example I’ve walked through here shows that you can reduce data volume and enrich events at the same time. Even better, you may not need to get yet another security tool just to analyze VPC Flow Logs because those are too voluminous to put into the security analytics tool that you already use.If you don’t run Cribl Stream yet, and would like to learn more about it and experiment with sample data, Stream Sandboxes are free. They’re the best way to quickly see what’s possible and how easy it is to achieve great data manipulation results.
The fastest way to get started with Cribl Stream is to sign-up at Cribl.Cloud. You can process up to 1 TB of throughput per day at no cost. Sign-up and start using Stream within a few minutes.