Cribl’s suite of products excel at collecting and organizing your IT and security event data. Did you know it can also help with IoT data collection and analysis? If you can get the text of the data into Cribl, in most cases, we can process it, transform it, and send it to where you want it to go.
A few years ago, I bought a weather station. I immediately hooked up some home automation gear to show me the temperature, humidity, and air quality. But the geek in me wants more. What was the temp like a year ago today? Three years ago today? Unless I’m storing that data in a reliable and durable location and have a search tool that can use that archived data, I’m out of luck.
In this post, we’ll cover onboarding weather data from a PurpleAir weather station, add some simple processing, and store the data in a data lake. Once in the lake, we can easily use Cribl Search to generate reports, build dashboards, trigger alerts, or collect the data to send to another analysis tool.
TL;DR: The Overall Process:
- Understand your data source and the data itself
- Get it flowing into Cribl Steam
- Make a list of goals/requirements for the data
- Create a pipeline to fix it up (if required)
- Create the object store destination (or use one that already exists)
- Create a route: source -> pipeline -> destination
- Use Cribl Search to analyze the stored data
What is PurpleAir
PurpleAir provides an “air quality monitoring network built on a new generation of ‘Internet of Things’ sensors.” You can join their research by deploying a station and also indulge your inner geek with all the data it provides. Sensors include various forms of air quality, temperature, and pressure. While you might not be deploying one of this for your IT needs, I wanted to use it as a test case, showing how easy IoT data is to manage with Cribl’s products
The great thing about the PurpleAir device is that if you run an HTTP GET on /json you get plain ol’ JSON payload on one line. I like simple. Example GET, piped through jq to pretty-print it:
$ curl -s https://yourPA/json | jq

{

"SensorId": "84:f3:eb:xx:xx:xx",

"DateTime": "2024/01/28T01:38:29z",

"Geo": "PurpleAir-xxxx",

"Mem": 20152,

<snip>

"place": "outside",

"version": "7.02",

"uptime": 86531,

"rssi": -58,

"period": 120,

"httpsuccess": 1467,

"httpsends": 1467,

"hardwareversion": "2.0",

"hardwarediscovered": "2.0+BME280+PMSX003-B+PMSX003-A",

"current_temp_f": 80,

"current_humidity": 22,

"current_dewpoint_f": 38,

"pressure": 1013.53,

<snip>

}
The revision of my hardware has a known issue where the temperature is reported to be 8 degrees too high. This will be one of the things we’ll fix in Cribl before sending it off to my data lake. Easy fix! Imagine how useful this will be for critical security data for adding context to it.
The tricky part of the device is that it has no memory or storage and doesn’t provide a method to push data out to a location of my choosing. I need a way to pull the data, a way to store it reliably, and a way to search it.
Source: Getting The Data Into Cribl Stream
Option 1:
The best way to get data in is to run a Cribl Stream node on the same network as the PA device and schedule a REST Collector to GET from the URL.
- In Cribl Stream, go to Data > Sources > REST Collector > Add Collector.
- Give it a name
- Discover mode should be none (the default)
- Collect URL:
https://yourPA/json (replace your)
- Collect method is GET
- Under the Event Breaker tab on the left, choose Cribl (for new line delimited JSON data)
- Under fields, add
sourcetype with value purpleair. This will help in routing and filtering.
- Save the Collector, then run a test to validate you’re getting data
- If that works, click the Schedule link in the Collector config and schedule it to run at whatever frequency makes you happy. I chose 5 minutes (cron schedule: */5 * * * *)
- Don’t forget to commit and deploy (assuming you’re in a distributed Cribl install)
- In my case, I will connect this Collector to a destination pointing to my Cribl.Cloud instance. I could use Result Routing in the Collector configuration or the Routing table. I will manage data repair, normalization, and delivery from the Cloud instance into the data lake.
Option 2:
Run a simple cron job to grab the data and pipe it into OpenSSL to send to one of the default listening ports in my Cribl Cloud instance. For example, this will send the output of the curl command to a Cribl Cloud instance’s TCP JSON input:
curl -s https://yourpa/json | openssl s_client -connect \ default.your_instance_id.cribl.cloud:10070
This concept makes it very easy to collect data from devices that are too restricted or simple to install agents on.
I recommend setting up a pipeline to pre-process the data coming into the TCP JSON input. Use this pipeline to classify the data based on fields and/or patterns. Create a sourcetype field to identify the data further down the road. With this mechanism in place, you can send different types of data to the same port, and classify it as it comes in.
In your Cribl Worker Group:
- Processing –
> Pipelines
- Add a new pipeline named
tcp-json-preproc
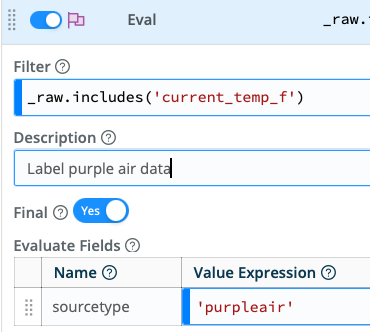
- Add an Eval function
- Filter:
_raw.includes('current_temp_f')
- Add field:
sourcetype => 'purpleair'
- Toggle the Final flag to on
- Add more Eval functions as you onboard more types of data
- Save the pipeline
- Navigate back to your TCP JSON source and enable this pipeline under Pre-Processing
- Save

What we’re doing: If the event contains the string current_temp_f, we will add a field to the event called sourcetype with a value of ‘purpleair‘. If sourcetype already exists, it will be overwritten.
You may need to adjust the filter statement depending on what your data looks like when it arrives in Cribl Stream. As presented here, it depends on _raw being a string.
Fix The Data
Let’s grab a capture of the incoming data, as presented to Cribl, so we can make the rules to prep it for storage and reporting, including fixing that errant temperature reading.
For the REST Collector method, please navigate to the setup page and run it in preview mode. Save the collected sample as a file.
For the TCP JSON style, In the Worker Group, navigate to your TCP JSON source and click on Live. Change the capture point to stage 2, before the routes, so that we capture after the pre-processing pipeline. Once you have data captured, save it as a sample file.
Requirements
Any time you’re onboarding new data, you should have a plan of what you want to do with it. After inspecting the data, I have a few goals:
- Make sure it’s parsed JSON, and move all fields to the top level of the event
- Fix
current_temp_f by subtracting 8
- Remove fields:
p25aqic* lat lon period (just as a demo of what the remove fields can be used for)
The Pipeline
To do this in Cribl Stream:
- Under Processing, head to Pipelines and create a new one
- Open your sample file by clicking on the name in the Preview pane
- In my case, the data is coming through as JSON in the _raw field
- If your fields are already in the top level of the event, you won’t need the Parser function below
- Add a Parser function (unless your data is already parsed JSON)
- Mode: Extract, Type: JSON Object, Source field: _raw
- Leave the rest as the defaults
- Add an Eval function
- Add a field: current_temp_f => current_temp_f – 8
- Put
_raw p25aqic* lat lon period into Remove fields
- Save and check the Out tab on the preview side
Destination: Storing the Data
As always, with Cribl Stream, you can send your data to any destination that supports open protocols and many proprietary ones. It’s your data – Do with it what you like. Aamzon S3, Azure Blob, Google Cloud Storage, or self-hosted solutions from Pure Storage, MinIO, and more. For this example, we will send it to an object store.
Remember that to use Cribl Search, the object store you choose must be accessible from AWS Lambda for optimal performance. There are some workarounds for using on-prem object stores, but that’s beyond the scope of this article. Join our Community Slack channel, or contact your favorite SE for ideas.
One key point in the setup is the partitioning scheme. This is essentially the path to your objects, but it can also give us tokens, or metadata, to help search and replay. See our docs and previous blogs for more info and tips on partitioning.
SIEMs and Search Tools
And, of course, Cribl Stream can deliver several analysis tools. Often, we can connect to them with their native/defined protocols (e.g., Dataset or Exabeam). Other times, you’ll need to use an open protocol or maybe even an object store as an intermediary (e.g., Snowflake as of Jan 2024). One way or another, we can talk to dozens of search tools. But remember, we always recommend sending it to an object store for safekeeping. Never rely on your analysis tier for retention duties.
Test
Once you have your destination set up, use the built-in tester (available in the destination config screen) to test delivery. After receiving a green check mark for “success,” you should be able to find the test events in your storage and/or system of analysis.
Route to the Destination Through the Pipeline
Create a Route entry named iot-purpleair with a filter or sourcetype == 'purpleair'. If you set up the pre-processor pipeline above, this will catch your events. For the Pipeline, choose iot-purpleair which we built above. Finally, choose your output – in my case, I’m sending it to my S3 destination I named iot.
( —---------- CRIBL –------------)

PA <- curl -> (TCP JSON -> pre-proc -> pipeline) -> obj store
Save, commit, and deploy. After a few minutes to settle and after your schedule fires, your first run of the collector should be in your destination.
Search It
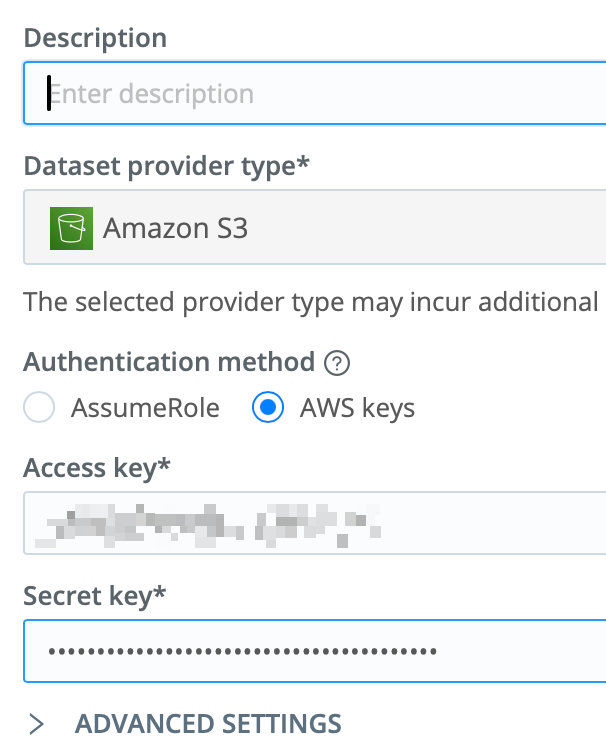
Cribl Search will also need to know how to access your object store. For my data, I created an access key and secret with appropriate permissions and filled out the Dataset Provider info:

Each provider can have multiple datasets defined.
Dataset Provider: Here is the service where I store my stuff, with auth credentials. There could be all kinds of data here, organized in different ways.
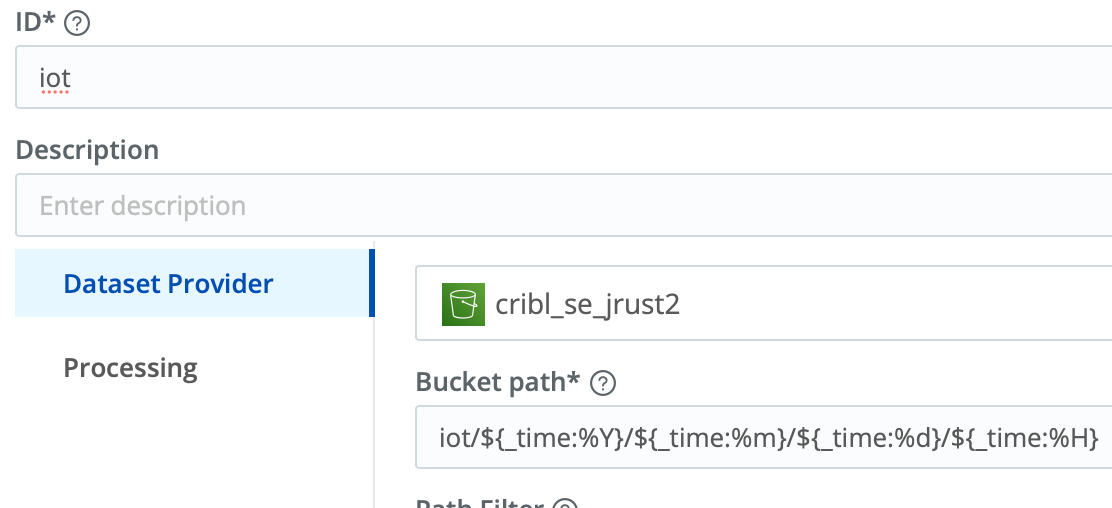
Dataset: With that Provider, here is information related to a particular data set.
Here’s a sample Dataset config:

Note the Bucket path should match the partitioning expression you defined for your Destination in Stream above.
My brilliant colleague, Sidd Shah, wrote a blog covering this setup. I’d also recommend this introductory post and our sandbox for Search.
Finally, let’s start building something cool in Cribl Search:
- I like to start with a command to list the available objects to validate we’re talking to the Dataset. My dataset is name iot, so adjust these as needed for yours.
.show objects('iot') | limit 10- What: Shows available native objects in the dataset in list form
- Why: Validate you’re finding any data in your dataset
- Success? Continue…
- Data appears to be there. Great! Let’s check it out:
dataset='iot' sourcetype=='purpleair' | limit 10- What: See a sample of the actual data you’ve stored
- Why: More validation
- Success? Continue…
- Tasty weather stats are there. Let’s make a chart:
dataset='iot' sourcetype=='purpleair' | timestats F=max(current_temp_f)- What: Show a temperature chart over time, labeled F. We get the max reading for any bin of time. If you instead want the average, use
avg() or the last reading findlatest()
- Why: Trend of temp over time
- Let’s make it more interesting by adding more series:
dataset='iot' sourcetype=='purpleair' | timestats F=max(current_temp_f), H=max(current_humidity), AQ=findlatest('pm2.5_aqi')- What: Show a chart of temperature, humidity (H), and air quality (AQ) at a 2.5-micron level over time
- Why: Rounding out our chart.
- Change up the chart style
- Click the paintbrush on the right side of the chart
- Under the data heading, set F and H to line and AQ to bar
- What: Change the format so AQ stands out from temp and humidity
- Why: Better organization makes the chart more useful
Build the Dashboard
- Save the panel from above to a new dashboard
- Under Actions, Add to the dashboard
- Create a new one, and name it Purple
- Let’s add more panels!
- With the Purple dashboard up, hit the … in the corner and go to Edit
- Then Add -> Panel
- Title it Latest Temp
- Search content:
dataset='iot' sourcetype=='purpleair' | summarize Temp=findlatest('current_temp_f')
- Shrink the search window to 1hr
- Make it a gauge style. Fill in thresholds if you want.
- Close and save that panel
- Add another by cloning the Latest Temp panel
- Title it Latest AQI
- Update the search to reference AQI instead: …
summarize AQ=findlatest('pm2.5_aqi')
- Change the gauge thresholds if you want.
- Close and save
- Arrange and resize your panels as you want. Drag and drop quickly!
- Save
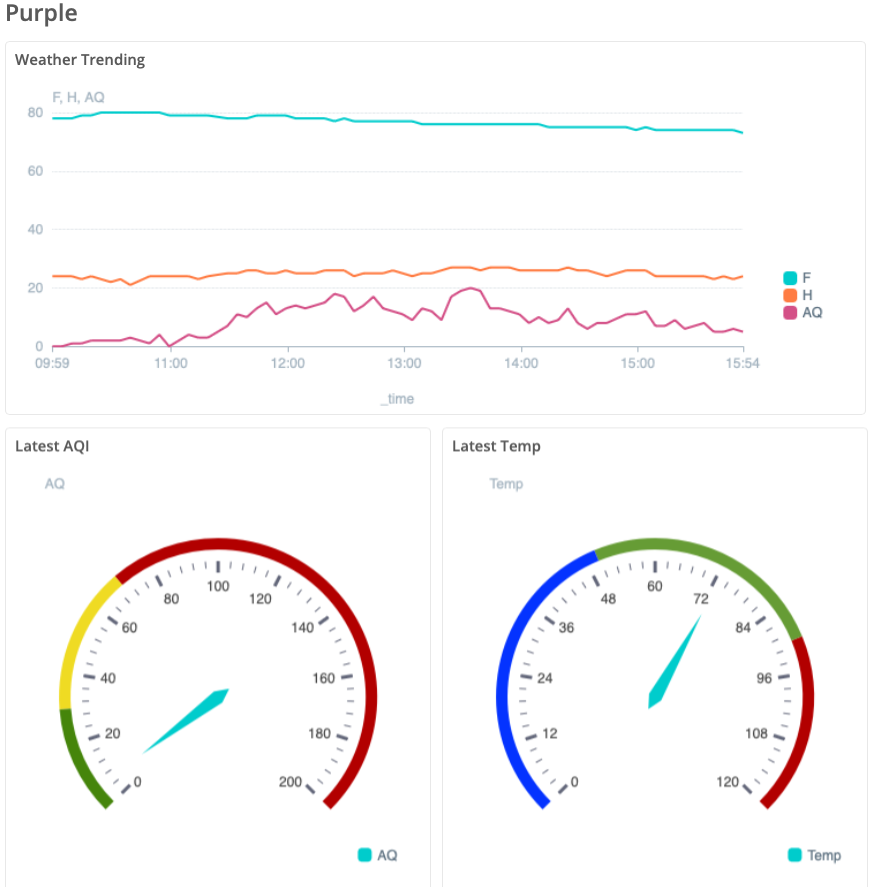
My finished product is below. How did yours turn out?

Where To Go From Here
- You could send data from any number of sources to that same TCP port or create more REST Collectors.
- Cribl Search also allows for arbitrary REST collection at search time, requiring no storage. See externaldata command, as well as our API-based Dataset Providers.
- For this specific data, you could convert it to metrics for more space savings and faster searches.
There are so many possibilities with an omnivorous consumer like Cribl. Share your ideas in our Slack community!
Conclusion
Cribl Suite continues to evolve, adding new ways to collect, transport, manage, and use your data. The growing data output from IOT can benefit from an o11y pipeline and data lake strategy. And we can help. Cribl Search is rapidly maturing and gives one more arrow in your quiver, making it much easier to get started on your long-term data strategy.
Whether you use Cribl Search or your existing familiar search tool, Cribl’s here to help you manage all your data. Collect it, normalize it, route it, optimize it, enrich it, archive it, replay it: This ultimately helps you get value from your data when you need it and stop burning expensive resources on it when you don’t.
Cribl, the Data Engine for IT and Security, empowers organizations to transform their data strategy. Customers use Cribl’s suite of products to collect, process, route, and analyze all IT and security data, delivering the flexibility, choice, and control required to adapt to their ever-changing needs.
We offer free training, certifications, and a free tier across our products. Our community Slack features Cribl engineers, partners, and customers who can answer your questions as you get started and continue to build and evolve. We also offer a variety of hands-on Sandboxes for those interested in how companies globally leverage our products for their data challenges.
Use Cases
Initiatives
Technologies
Industries
RouteOverview
Products
Services
Customer Stories
Customer Highlights


Cribl
Partners
Find a Partner


